Zip Codes with the Highest Percentage of Population Employed in Arts, Entertainment & Recreation in Grand Junction, CO
RELATED REPORTS & OPTIONS
Arts, Entertainment & Recreation
Grand Junction
Compare Zip Codes
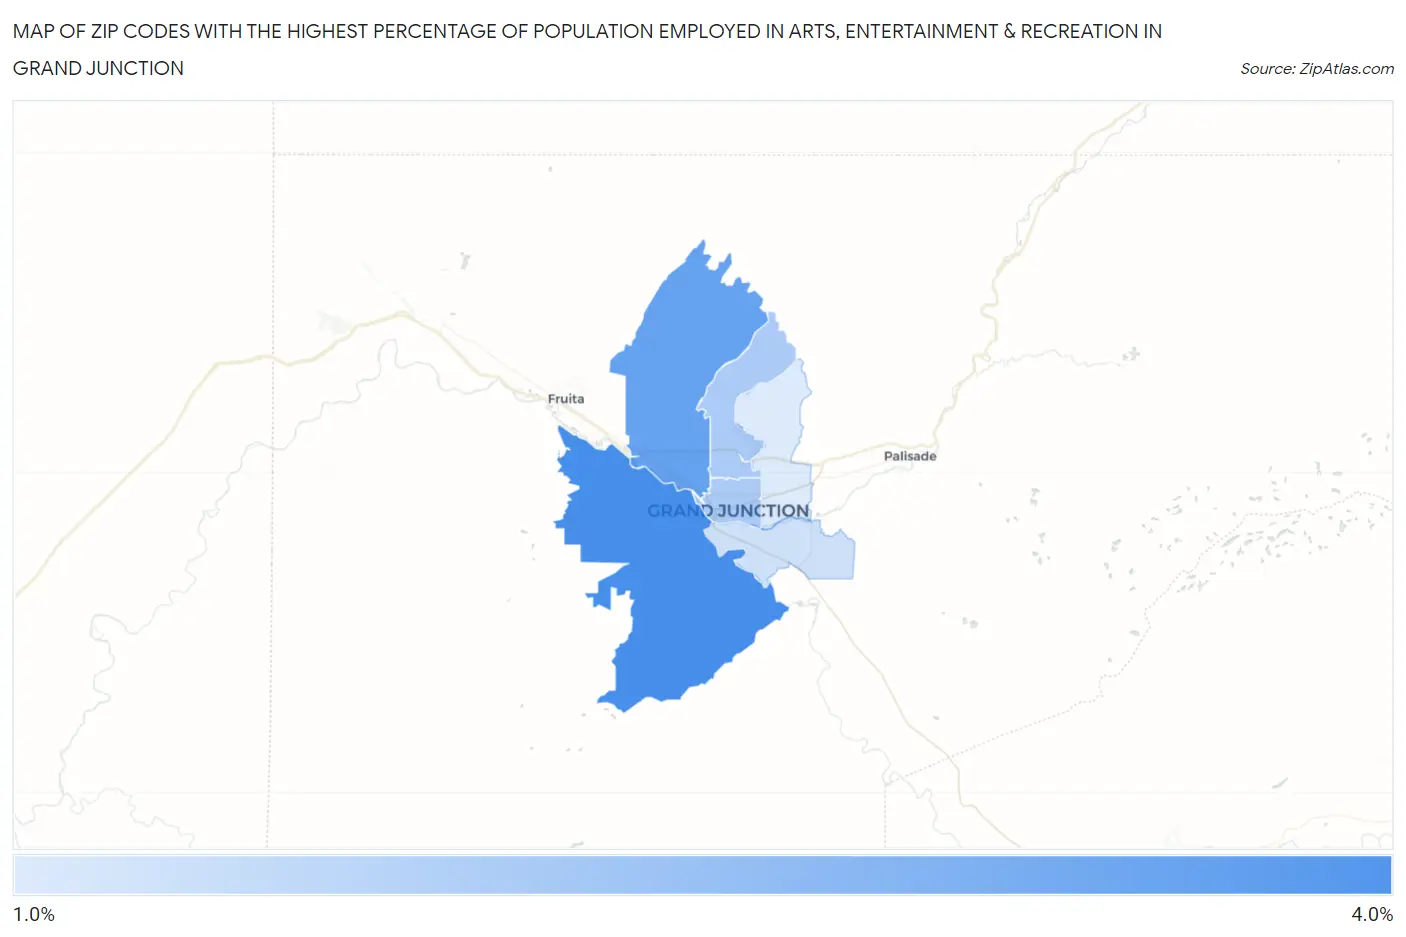
Map of Zip Codes with the Highest Percentage of Population Employed in Arts, Entertainment & Recreation in Grand Junction
0.0%
4.0%
Zip Codes with the Highest Percentage of Population Employed in Arts, Entertainment & Recreation in Grand Junction, CO
| Zip Code | % Employed | vs State | vs National | |
| 1. | 81507 | 3.5% | 2.6%(+0.931)#115 | 2.1%(+1.42)#4,125 |
| 2. | 81505 | 3.0% | 2.6%(+0.468)#145 | 2.1%(+0.956)#5,245 |
| 3. | 81506 | 2.0% | 2.6%(-0.545)#236 | 2.1%(-0.056)#9,621 |
| 4. | 81501 | 2.0% | 2.6%(-0.554)#237 | 2.1%(-0.066)#9,671 |
| 5. | 81503 | 1.5% | 2.6%(-1.11)#289 | 2.1%(-0.619)#13,494 |
| 6. | 81504 | 1.3% | 2.6%(-1.30)#301 | 2.1%(-0.808)#14,902 |
1
Common Questions
What are the Top 5 Zip Codes with the Highest Percentage of Population Employed in Arts, Entertainment & Recreation in Grand Junction, CO?
Top 5 Zip Codes with the Highest Percentage of Population Employed in Arts, Entertainment & Recreation in Grand Junction, CO are:
What zip code has the Highest Percentage of Population Employed in Arts, Entertainment & Recreation in Grand Junction, CO?
81507 has the Highest Percentage of Population Employed in Arts, Entertainment & Recreation in Grand Junction, CO with 3.5%.
What is the Percentage of Population Employed in Arts, Entertainment & Recreation in Grand Junction, CO?
Percentage of Population Employed in Arts, Entertainment & Recreation in Grand Junction is 2.5%.
What is the Percentage of Population Employed in Arts, Entertainment & Recreation in Colorado?
Percentage of Population Employed in Arts, Entertainment & Recreation in Colorado is 2.6%.
What is the Percentage of Population Employed in Arts, Entertainment & Recreation in the United States?
Percentage of Population Employed in Arts, Entertainment & Recreation in the United States is 2.1%.