Zip Codes with the Highest Percentage of Population Employed in Agriculture, Fishing & Hunting in Grand Junction, CO
RELATED REPORTS & OPTIONS
Agriculture, Fishing & Hunting
Grand Junction
Compare Zip Codes
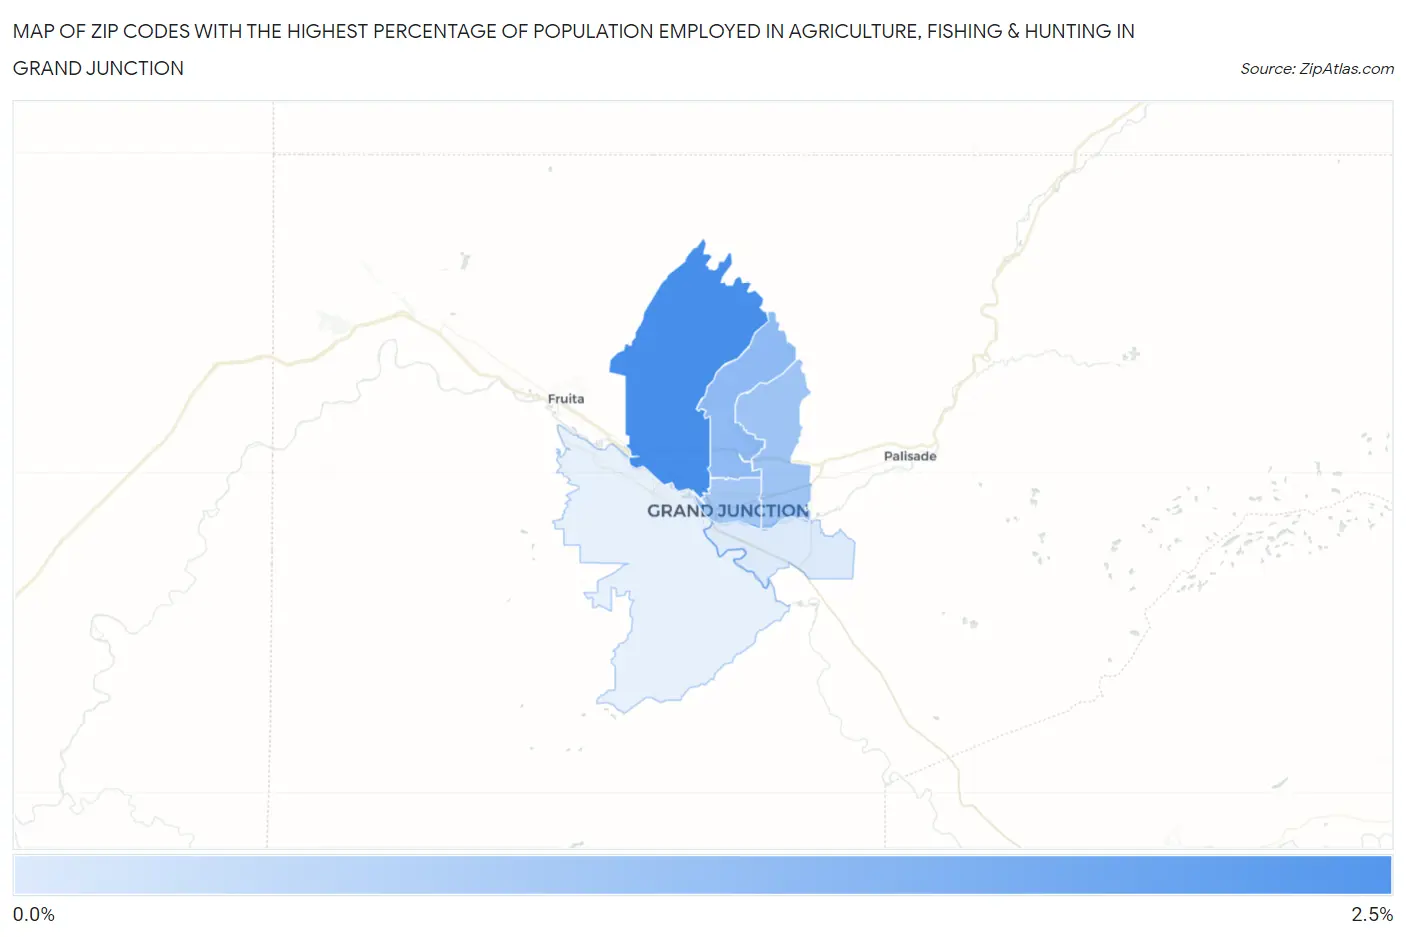
Map of Zip Codes with the Highest Percentage of Population Employed in Agriculture, Fishing & Hunting in Grand Junction
0.0%
2.5%
Zip Codes with the Highest Percentage of Population Employed in Agriculture, Fishing & Hunting in Grand Junction, CO
| Zip Code | % Employed | vs State | vs National | |
| 1. | 81505 | 2.4% | 1.1%(+1.25)#212 | 1.2%(+1.20)#11,789 |
| 2. | 81506 | 1.4% | 1.1%(+0.232)#255 | 1.2%(+0.181)#14,718 |
| 3. | 81504 | 1.1% | 1.1%(-0.003)#269 | 1.2%(-0.055)#15,615 |
| 4. | 81501 | 1.1% | 1.1%(-0.066)#275 | 1.2%(-0.117)#15,877 |
| 5. | 81503 | 0.25% | 1.1%(-0.897)#395 | 1.2%(-0.948)#21,749 |
1
Common Questions
What are the Top 5 Zip Codes with the Highest Percentage of Population Employed in Agriculture, Fishing & Hunting in Grand Junction, CO?
Top 5 Zip Codes with the Highest Percentage of Population Employed in Agriculture, Fishing & Hunting in Grand Junction, CO are:
What zip code has the Highest Percentage of Population Employed in Agriculture, Fishing & Hunting in Grand Junction, CO?
81505 has the Highest Percentage of Population Employed in Agriculture, Fishing & Hunting in Grand Junction, CO with 2.4%.
What is the Percentage of Population Employed in Agriculture, Fishing & Hunting in Grand Junction, CO?
Percentage of Population Employed in Agriculture, Fishing & Hunting in Grand Junction is 1.1%.
What is the Percentage of Population Employed in Agriculture, Fishing & Hunting in Colorado?
Percentage of Population Employed in Agriculture, Fishing & Hunting in Colorado is 1.1%.
What is the Percentage of Population Employed in Agriculture, Fishing & Hunting in the United States?
Percentage of Population Employed in Agriculture, Fishing & Hunting in the United States is 1.2%.