Zip Codes with the Highest Percentage of Population Employed in Agriculture, Fishing & Hunting in Fort Collins, CO
RELATED REPORTS & OPTIONS
Agriculture, Fishing & Hunting
Fort Collins
Compare Zip Codes
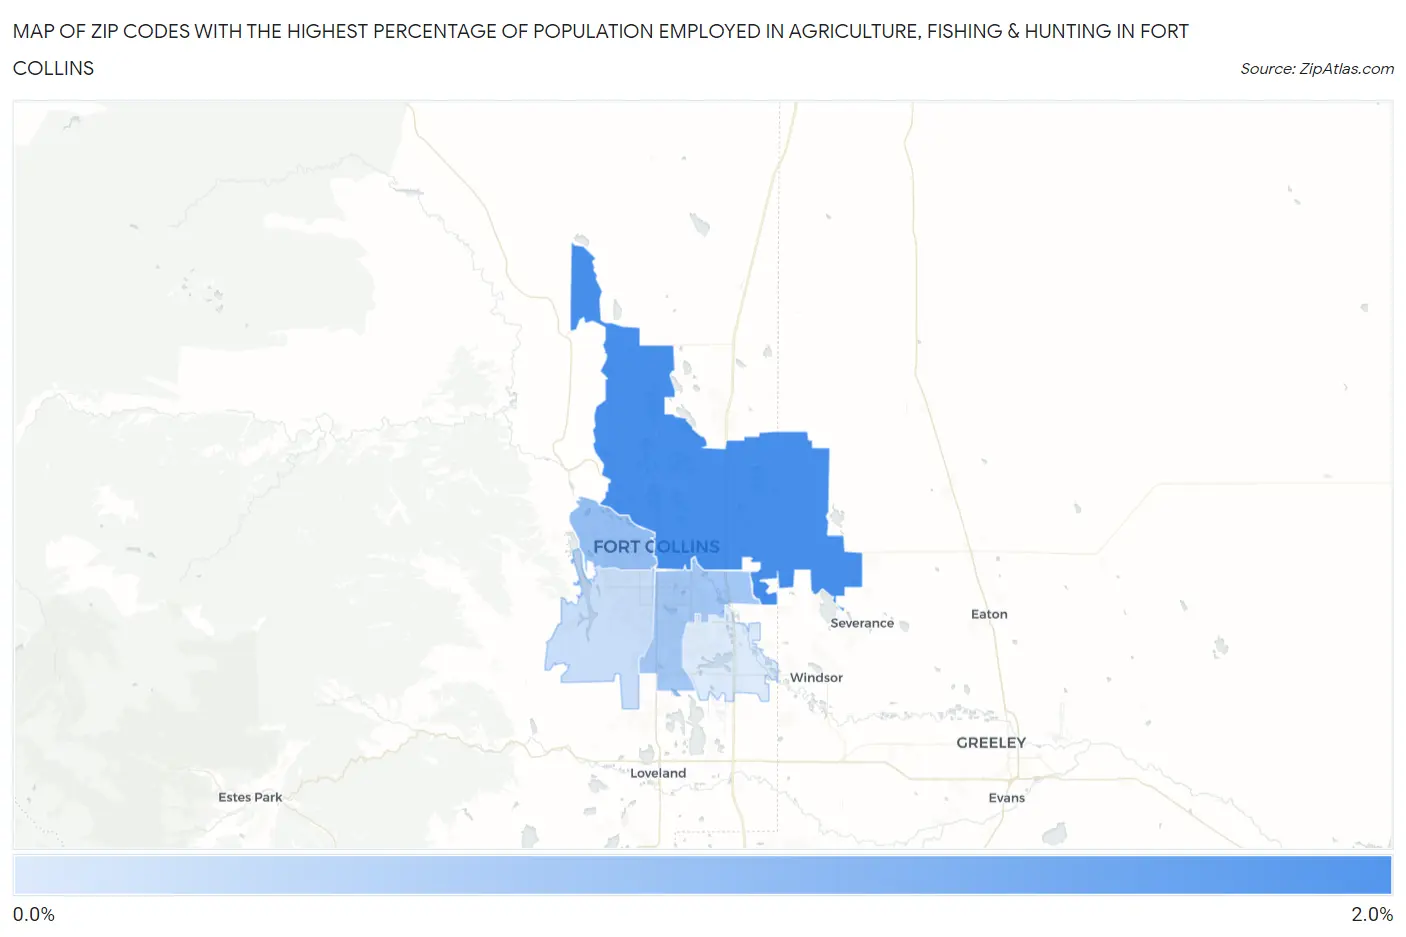
Map of Zip Codes with the Highest Percentage of Population Employed in Agriculture, Fishing & Hunting in Fort Collins
0.0%
2.0%
Zip Codes with the Highest Percentage of Population Employed in Agriculture, Fishing & Hunting in Fort Collins, CO
| Zip Code | % Employed | vs State | vs National | |
| 1. | 80524 | 1.9% | 1.1%(+0.791)#227 | 1.2%(+0.739)#12,929 |
| 2. | 80521 | 1.1% | 1.1%(-0.033)#271 | 1.2%(-0.085)#15,744 |
| 3. | 80525 | 0.94% | 1.1%(-0.206)#289 | 1.2%(-0.258)#16,488 |
| 4. | 80526 | 0.52% | 1.1%(-0.623)#327 | 1.2%(-0.675)#19,066 |
| 5. | 80528 | 0.31% | 1.1%(-0.838)#373 | 1.2%(-0.890)#21,060 |
1
Common Questions
What are the Top 3 Zip Codes with the Highest Percentage of Population Employed in Agriculture, Fishing & Hunting in Fort Collins, CO?
Top 3 Zip Codes with the Highest Percentage of Population Employed in Agriculture, Fishing & Hunting in Fort Collins, CO are:
What zip code has the Highest Percentage of Population Employed in Agriculture, Fishing & Hunting in Fort Collins, CO?
80524 has the Highest Percentage of Population Employed in Agriculture, Fishing & Hunting in Fort Collins, CO with 1.9%.
What is the Percentage of Population Employed in Agriculture, Fishing & Hunting in Fort Collins, CO?
Percentage of Population Employed in Agriculture, Fishing & Hunting in Fort Collins is 0.81%.
What is the Percentage of Population Employed in Agriculture, Fishing & Hunting in Colorado?
Percentage of Population Employed in Agriculture, Fishing & Hunting in Colorado is 1.1%.
What is the Percentage of Population Employed in Agriculture, Fishing & Hunting in the United States?
Percentage of Population Employed in Agriculture, Fishing & Hunting in the United States is 1.2%.