Zip Codes with the Highest Percentage of Population Employed in Farming, Fishing & Forestry in Fort Collins, CO
RELATED REPORTS & OPTIONS
Farming, Fishing & Forestry
Fort Collins
Compare Zip Codes
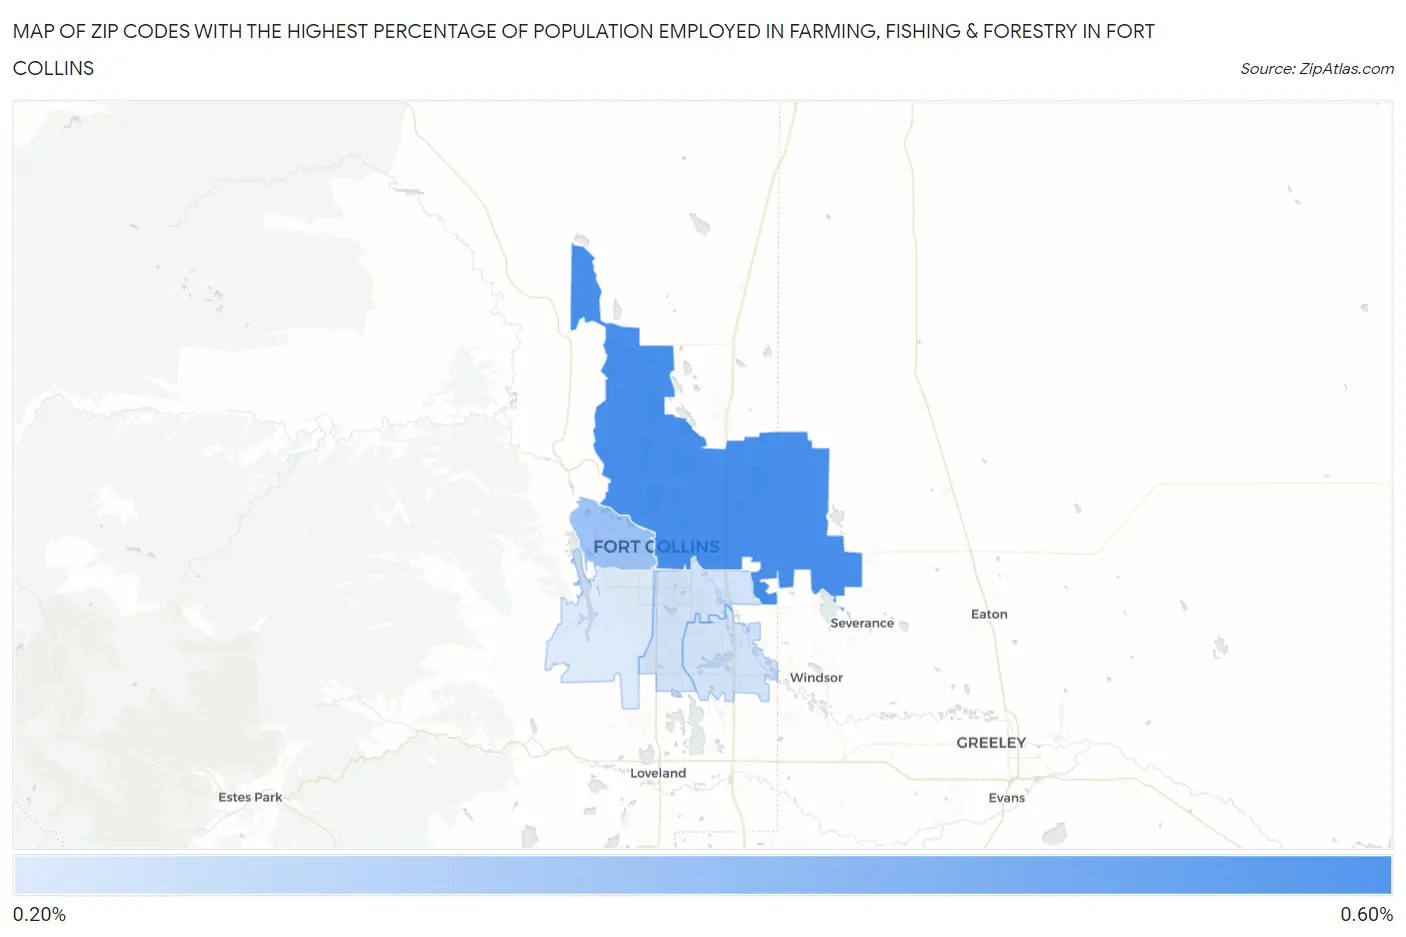
Map of Zip Codes with the Highest Percentage of Population Employed in Farming, Fishing & Forestry in Fort Collins
0.0%
0.60%
Zip Codes with the Highest Percentage of Population Employed in Farming, Fishing & Forestry in Fort Collins, CO
| Zip Code | % Employed | vs State | vs National | |
| 1. | 80524 | 0.57% | 0.49%(+0.084)#189 | 0.61%(-0.034)#12,282 |
| 2. | 80521 | 0.38% | 0.49%(-0.109)#227 | 0.61%(-0.228)#13,970 |
| 3. | 80528 | 0.26% | 0.49%(-0.226)#255 | 0.61%(-0.345)#15,275 |
| 4. | 80525 | 0.26% | 0.49%(-0.231)#256 | 0.61%(-0.349)#15,328 |
| 5. | 80526 | 0.23% | 0.49%(-0.255)#261 | 0.61%(-0.373)#15,655 |
1
Common Questions
What are the Top 3 Zip Codes with the Highest Percentage of Population Employed in Farming, Fishing & Forestry in Fort Collins, CO?
Top 3 Zip Codes with the Highest Percentage of Population Employed in Farming, Fishing & Forestry in Fort Collins, CO are:
What zip code has the Highest Percentage of Population Employed in Farming, Fishing & Forestry in Fort Collins, CO?
80524 has the Highest Percentage of Population Employed in Farming, Fishing & Forestry in Fort Collins, CO with 0.57%.
What is the Percentage of Population Employed in Farming, Fishing & Forestry in Fort Collins, CO?
Percentage of Population Employed in Farming, Fishing & Forestry in Fort Collins is 0.30%.
What is the Percentage of Population Employed in Farming, Fishing & Forestry in Colorado?
Percentage of Population Employed in Farming, Fishing & Forestry in Colorado is 0.49%.
What is the Percentage of Population Employed in Farming, Fishing & Forestry in the United States?
Percentage of Population Employed in Farming, Fishing & Forestry in the United States is 0.61%.