Zip Codes with the Highest Percentage of Population Walking to Work in Crested Butte, CO
RELATED REPORTS & OPTIONS
Walk to Work
Crested Butte
Compare Zip Codes
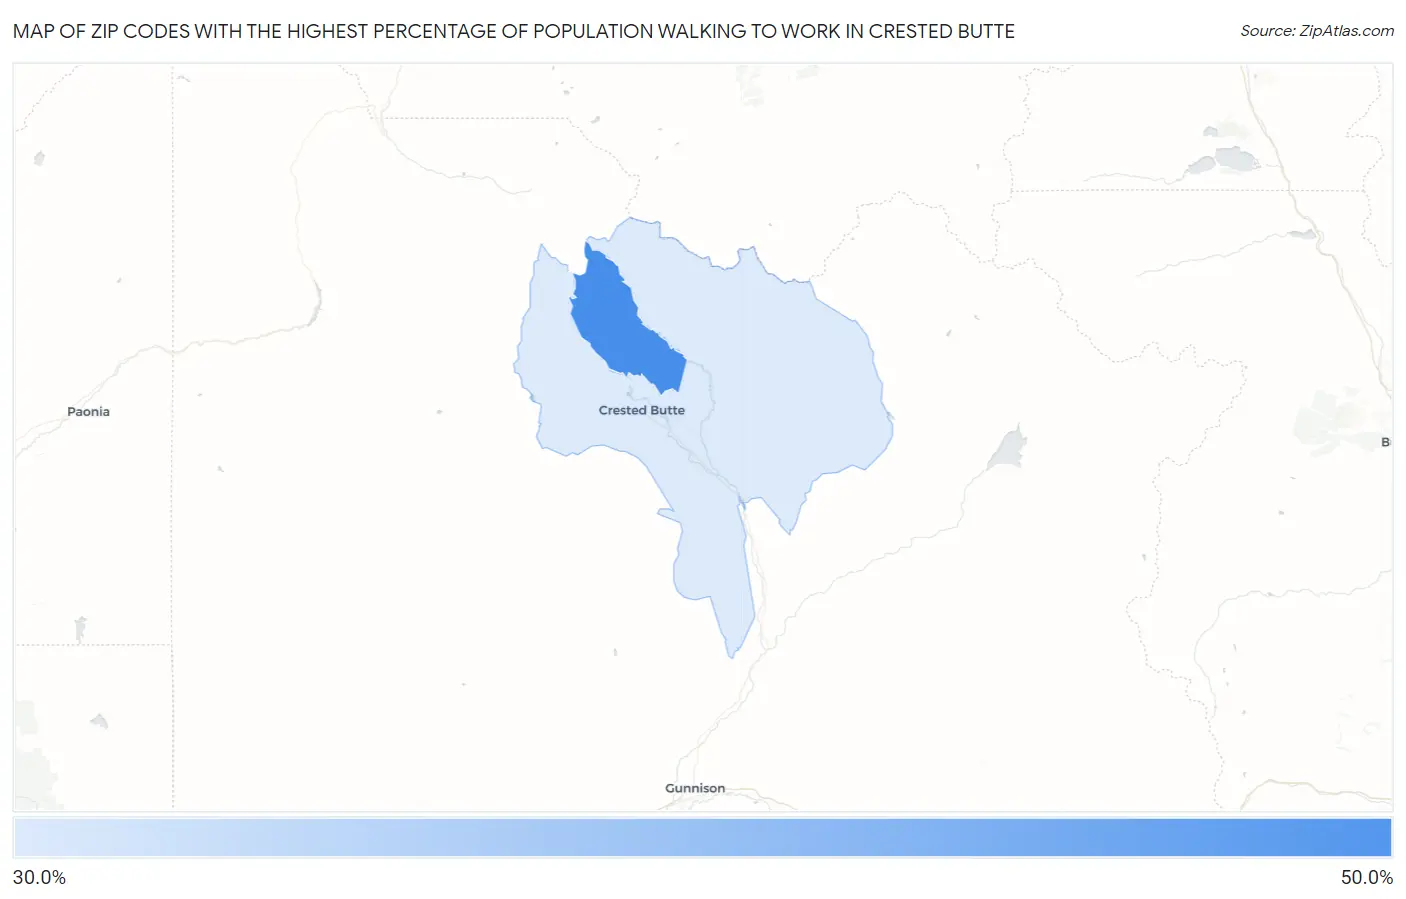
Map of Zip Codes with the Highest Percentage of Population Walking to Work in Crested Butte
32.0%
43.9%
Zip Codes with the Highest Percentage of Population Walking to Work in Crested Butte, CO
| Zip Code | % Walk to Work | vs State | vs National | |
| 1. | 81225 | 43.9% | 31.3%(+12.6)#102 | 33.4%(+10.5)#6,843 |
| 2. | 81224 | 32.0% | 31.3%(+0.700)#207 | 33.4%(-1.40)#11,781 |
1
Common Questions
What are the Top Zip Codes with the Highest Percentage of Population Walking to Work in Crested Butte, CO?
Top Zip Codes with the Highest Percentage of Population Walking to Work in Crested Butte, CO are:
What zip code has the Highest Percentage of Population Walking to Work in Crested Butte, CO?
81225 has the Highest Percentage of Population Walking to Work in Crested Butte, CO with 43.9%.
What is the Percentage of Population Walking to Work in Crested Butte, CO?
Percentage of Population Walking to Work in Crested Butte is 33.2%.
What is the Percentage of Population Walking to Work in Colorado?
Percentage of Population Walking to Work in Colorado is 31.3%.
What is the Percentage of Population Walking to Work in the United States?
Percentage of Population Walking to Work in the United States is 33.4%.