Zip Codes with the Highest Percentage of Population Working from Home in California
RELATED REPORTS & OPTIONS
Work from Home
California
Compare Zip Codes
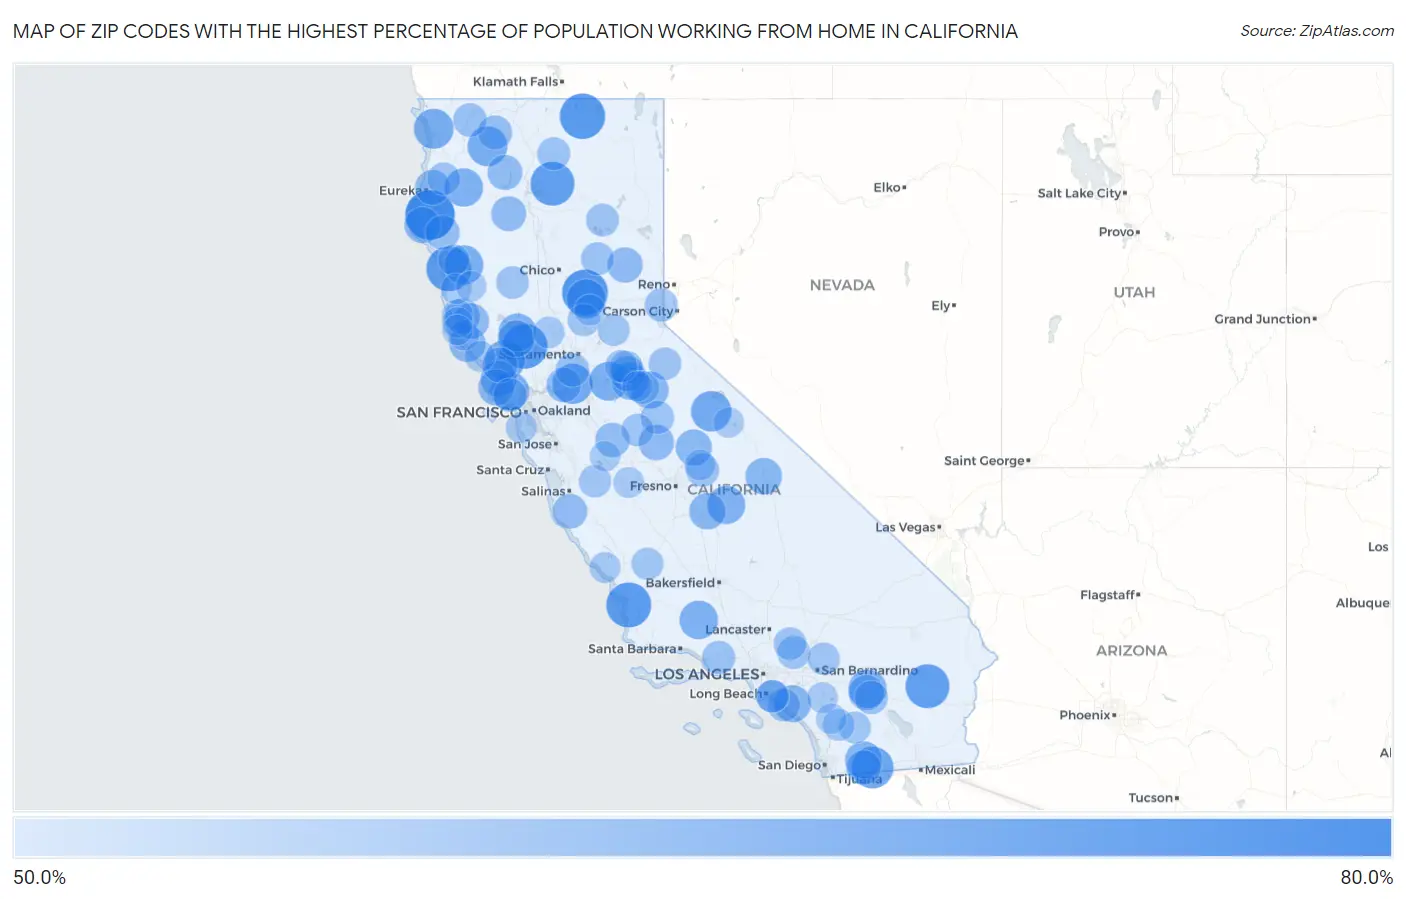
Map of Zip Codes with the Highest Percentage of Population Working from Home in California
50.0%
80.0%
Zip Codes with the Highest Percentage of Population Working from Home in California
| Zip Code | % Work from Home | vs State | vs National | |
| 1. | 95562 | 79.2% | 43.4%(+35.8)#1 | 44.0%(+35.2)#23 |
| 2. | 95914 | 75.2% | 43.4%(+31.8)#2 | 44.0%(+31.2)#62 |
| 3. | 96134 | 74.7% | 43.4%(+31.3)#3 | 44.0%(+30.7)#66 |
| 4. | 93445 | 74.3% | 43.4%(+30.9)#4 | 44.0%(+30.3)#69 |
| 5. | 94567 | 74.2% | 43.4%(+30.8)#5 | 44.0%(+30.2)#77 |
| 6. | 95488 | 74.1% | 43.4%(+30.7)#6 | 44.0%(+30.1)#82 |
| 7. | 96065 | 73.3% | 43.4%(+29.9)#7 | 44.0%(+29.3)#92 |
| 8. | 92239 | 73.2% | 43.4%(+29.8)#8 | 44.0%(+29.2)#102 |
| 9. | 91905 | 71.1% | 43.4%(+27.7)#9 | 44.0%(+27.1)#177 |
| 10. | 93529 | 69.6% | 43.4%(+26.2)#10 | 44.0%(+25.6)#226 |
| 11. | 95641 | 69.4% | 43.4%(+26.0)#11 | 44.0%(+25.4)#234 |
| 12. | 95439 | 69.3% | 43.4%(+25.9)#12 | 44.0%(+25.3)#242 |
| 13. | 96027 | 68.9% | 43.4%(+25.5)#13 | 44.0%(+24.9)#276 |
| 14. | 95548 | 68.8% | 43.4%(+25.4)#14 | 44.0%(+24.8)#279 |
| 15. | 95454 | 68.3% | 43.4%(+24.9)#15 | 44.0%(+24.3)#309 |
| 16. | 95918 | 68.2% | 43.4%(+24.8)#16 | 44.0%(+24.2)#318 |
| 17. | 95254 | 68.2% | 43.4%(+24.8)#17 | 44.0%(+24.2)#328 |
| 18. | 93252 | 67.5% | 43.4%(+24.1)#18 | 44.0%(+23.5)#369 |
| 19. | 95563 | 67.5% | 43.4%(+24.1)#19 | 44.0%(+23.5)#374 |
| 20. | 94946 | 67.3% | 43.4%(+23.9)#20 | 44.0%(+23.3)#398 |
| 21. | 92276 | 67.1% | 43.4%(+23.7)#21 | 44.0%(+23.1)#417 |
| 22. | 93237 | 67.1% | 43.4%(+23.7)#22 | 44.0%(+23.1)#428 |
| 23. | 95457 | 67.0% | 43.4%(+23.6)#23 | 44.0%(+23.0)#430 |
| 24. | 91962 | 66.3% | 43.4%(+22.9)#24 | 44.0%(+22.3)#488 |
| 25. | 95383 | 66.1% | 43.4%(+22.7)#25 | 44.0%(+22.1)#511 |
| 26. | 92637 | 66.0% | 43.4%(+22.6)#26 | 44.0%(+22.0)#529 |
| 27. | 95249 | 66.0% | 43.4%(+22.6)#27 | 44.0%(+22.0)#531 |
| 28. | 95461 | 65.7% | 43.4%(+22.3)#28 | 44.0%(+21.7)#557 |
| 29. | 93526 | 65.5% | 43.4%(+22.1)#29 | 44.0%(+21.5)#583 |
| 30. | 93235 | 65.4% | 43.4%(+22.0)#30 | 44.0%(+21.4)#592 |
| 31. | 95497 | 65.3% | 43.4%(+21.9)#31 | 44.0%(+21.3)#614 |
| 32. | 94971 | 65.2% | 43.4%(+21.8)#32 | 44.0%(+21.2)#639 |
| 33. | 95558 | 65.2% | 43.4%(+21.8)#33 | 44.0%(+21.2)#642 |
| 34. | 93643 | 65.1% | 43.4%(+21.7)#34 | 44.0%(+21.1)#653 |
| 35. | 94937 | 64.9% | 43.4%(+21.5)#35 | 44.0%(+20.9)#687 |
| 36. | 95306 | 64.5% | 43.4%(+21.1)#36 | 44.0%(+20.5)#744 |
| 37. | 95415 | 64.4% | 43.4%(+21.0)#37 | 44.0%(+20.4)#765 |
| 38. | 95466 | 64.4% | 43.4%(+21.0)#38 | 44.0%(+20.4)#768 |
| 39. | 92270 | 64.2% | 43.4%(+20.8)#39 | 44.0%(+20.2)#807 |
| 40. | 96103 | 64.2% | 43.4%(+20.8)#40 | 44.0%(+20.2)#818 |
| 41. | 95245 | 64.1% | 43.4%(+20.7)#41 | 44.0%(+20.1)#835 |
| 42. | 95444 | 64.1% | 43.4%(+20.7)#42 | 44.0%(+20.1)#848 |
| 43. | 95524 | 63.9% | 43.4%(+20.5)#43 | 44.0%(+19.9)#871 |
| 44. | 96047 | 63.8% | 43.4%(+20.4)#44 | 44.0%(+19.8)#890 |
| 45. | 96091 | 63.8% | 43.4%(+20.4)#45 | 44.0%(+19.8)#892 |
| 46. | 93924 | 63.6% | 43.4%(+20.2)#46 | 44.0%(+19.6)#905 |
| 47. | 94571 | 63.5% | 43.4%(+20.1)#47 | 44.0%(+19.5)#923 |
| 48. | 91906 | 63.5% | 43.4%(+20.1)#48 | 44.0%(+19.5)#926 |
| 49. | 95324 | 63.4% | 43.4%(+20.0)#49 | 44.0%(+19.4)#952 |
| 50. | 95553 | 63.3% | 43.4%(+19.9)#50 | 44.0%(+19.3)#984 |
| 51. | 96032 | 63.1% | 43.4%(+19.7)#51 | 44.0%(+19.1)#1,041 |
| 52. | 96039 | 62.5% | 43.4%(+19.1)#52 | 44.0%(+18.5)#1,173 |
| 53. | 95612 | 62.4% | 43.4%(+19.0)#53 | 44.0%(+18.4)#1,206 |
| 54. | 94933 | 62.3% | 43.4%(+18.9)#54 | 44.0%(+18.3)#1,232 |
| 55. | 93667 | 62.2% | 43.4%(+18.8)#55 | 44.0%(+18.2)#1,258 |
| 56. | 92210 | 62.1% | 43.4%(+18.7)#56 | 44.0%(+18.1)#1,286 |
| 57. | 95665 | 62.0% | 43.4%(+18.6)#57 | 44.0%(+18.0)#1,321 |
| 58. | 96143 | 62.0% | 43.4%(+18.6)#58 | 44.0%(+18.0)#1,322 |
| 59. | 93066 | 62.0% | 43.4%(+18.6)#59 | 44.0%(+18.0)#1,323 |
| 60. | 95311 | 62.0% | 43.4%(+18.6)#60 | 44.0%(+18.0)#1,324 |
| 61. | 92397 | 61.8% | 43.4%(+18.4)#61 | 44.0%(+17.8)#1,352 |
| 62. | 95310 | 61.8% | 43.4%(+18.4)#62 | 44.0%(+17.8)#1,359 |
| 63. | 96057 | 61.8% | 43.4%(+18.4)#63 | 44.0%(+17.8)#1,364 |
| 64. | 95956 | 61.8% | 43.4%(+18.4)#64 | 44.0%(+17.8)#1,371 |
| 65. | 96137 | 61.7% | 43.4%(+18.3)#65 | 44.0%(+17.7)#1,379 |
| 66. | 92662 | 61.7% | 43.4%(+18.3)#66 | 44.0%(+17.7)#1,380 |
| 67. | 93544 | 61.5% | 43.4%(+18.1)#67 | 44.0%(+17.5)#1,425 |
| 68. | 90743 | 61.5% | 43.4%(+18.1)#68 | 44.0%(+17.5)#1,440 |
| 69. | 95223 | 61.4% | 43.4%(+18.0)#69 | 44.0%(+17.4)#1,462 |
| 70. | 95525 | 61.4% | 43.4%(+18.0)#70 | 44.0%(+17.4)#1,469 |
| 71. | 95939 | 61.4% | 43.4%(+18.0)#71 | 44.0%(+17.4)#1,484 |
| 72. | 95369 | 61.3% | 43.4%(+17.9)#72 | 44.0%(+17.3)#1,516 |
| 73. | 95692 | 61.2% | 43.4%(+17.8)#73 | 44.0%(+17.2)#1,535 |
| 74. | 92352 | 61.1% | 43.4%(+17.7)#74 | 44.0%(+17.1)#1,580 |
| 75. | 95685 | 61.1% | 43.4%(+17.7)#75 | 44.0%(+17.1)#1,584 |
| 76. | 95075 | 61.1% | 43.4%(+17.7)#76 | 44.0%(+17.1)#1,614 |
| 77. | 90742 | 60.9% | 43.4%(+17.5)#77 | 44.0%(+16.9)#1,670 |
| 78. | 93461 | 60.8% | 43.4%(+17.4)#78 | 44.0%(+16.8)#1,689 |
| 79. | 92086 | 60.7% | 43.4%(+17.3)#79 | 44.0%(+16.7)#1,716 |
| 80. | 95635 | 60.7% | 43.4%(+17.3)#80 | 44.0%(+16.7)#1,721 |
| 81. | 92061 | 60.4% | 43.4%(+17.0)#81 | 44.0%(+16.4)#1,805 |
| 82. | 95937 | 60.4% | 43.4%(+17.0)#82 | 44.0%(+16.4)#1,812 |
| 83. | 95432 | 60.0% | 43.4%(+16.6)#83 | 44.0%(+16.0)#2,002 |
| 84. | 95585 | 59.9% | 43.4%(+16.5)#84 | 44.0%(+15.9)#2,019 |
| 85. | 93428 | 59.8% | 43.4%(+16.4)#85 | 44.0%(+15.8)#2,027 |
| 86. | 94037 | 59.8% | 43.4%(+16.4)#86 | 44.0%(+15.8)#2,032 |
| 87. | 95977 | 59.8% | 43.4%(+16.4)#87 | 44.0%(+15.8)#2,034 |
| 88. | 93622 | 59.5% | 43.4%(+16.1)#88 | 44.0%(+15.5)#2,122 |
| 89. | 93602 | 59.5% | 43.4%(+16.1)#89 | 44.0%(+15.5)#2,131 |
| 90. | 95445 | 59.5% | 43.4%(+16.1)#90 | 44.0%(+15.5)#2,137 |
| 91. | 95450 | 59.5% | 43.4%(+16.1)#91 | 44.0%(+15.5)#2,168 |
| 92. | 92586 | 59.4% | 43.4%(+16.0)#92 | 44.0%(+15.4)#2,176 |
| 93. | 95437 | 59.4% | 43.4%(+16.0)#93 | 44.0%(+15.4)#2,179 |
| 94. | 95459 | 59.4% | 43.4%(+16.0)#94 | 44.0%(+15.4)#2,217 |
| 95. | 95490 | 59.3% | 43.4%(+15.9)#95 | 44.0%(+15.3)#2,229 |
| 96. | 95468 | 59.3% | 43.4%(+15.9)#96 | 44.0%(+15.3)#2,252 |
| 97. | 93546 | 59.2% | 43.4%(+15.8)#97 | 44.0%(+15.2)#2,287 |
| 98. | 92059 | 59.2% | 43.4%(+15.8)#98 | 44.0%(+15.2)#2,318 |
| 99. | 95322 | 59.1% | 43.4%(+15.7)#99 | 44.0%(+15.1)#2,346 |
| 100. | 95247 | 59.1% | 43.4%(+15.7)#100 | 44.0%(+15.1)#2,357 |
Common Questions
What are the Top 10 Zip Codes with the Highest Percentage of Population Working from Home in California?
Top 10 Zip Codes with the Highest Percentage of Population Working from Home in California are:
What zip code has the Highest Percentage of Population Working from Home in California?
95562 has the Highest Percentage of Population Working from Home in California with 79.2%.
What is the Percentage of Population Working from Home in the State of California?
Percentage of Population Working from Home in California is 43.4%.
What is the Percentage of Population Working from Home in the United States?
Percentage of Population Working from Home in the United States is 44.0%.