Zip Codes with the Highest Percentage of Population Employed in Agriculture, Fishing & Hunting in Yuba City, CA
RELATED REPORTS & OPTIONS
Agriculture, Fishing & Hunting
Yuba City
Compare Zip Codes
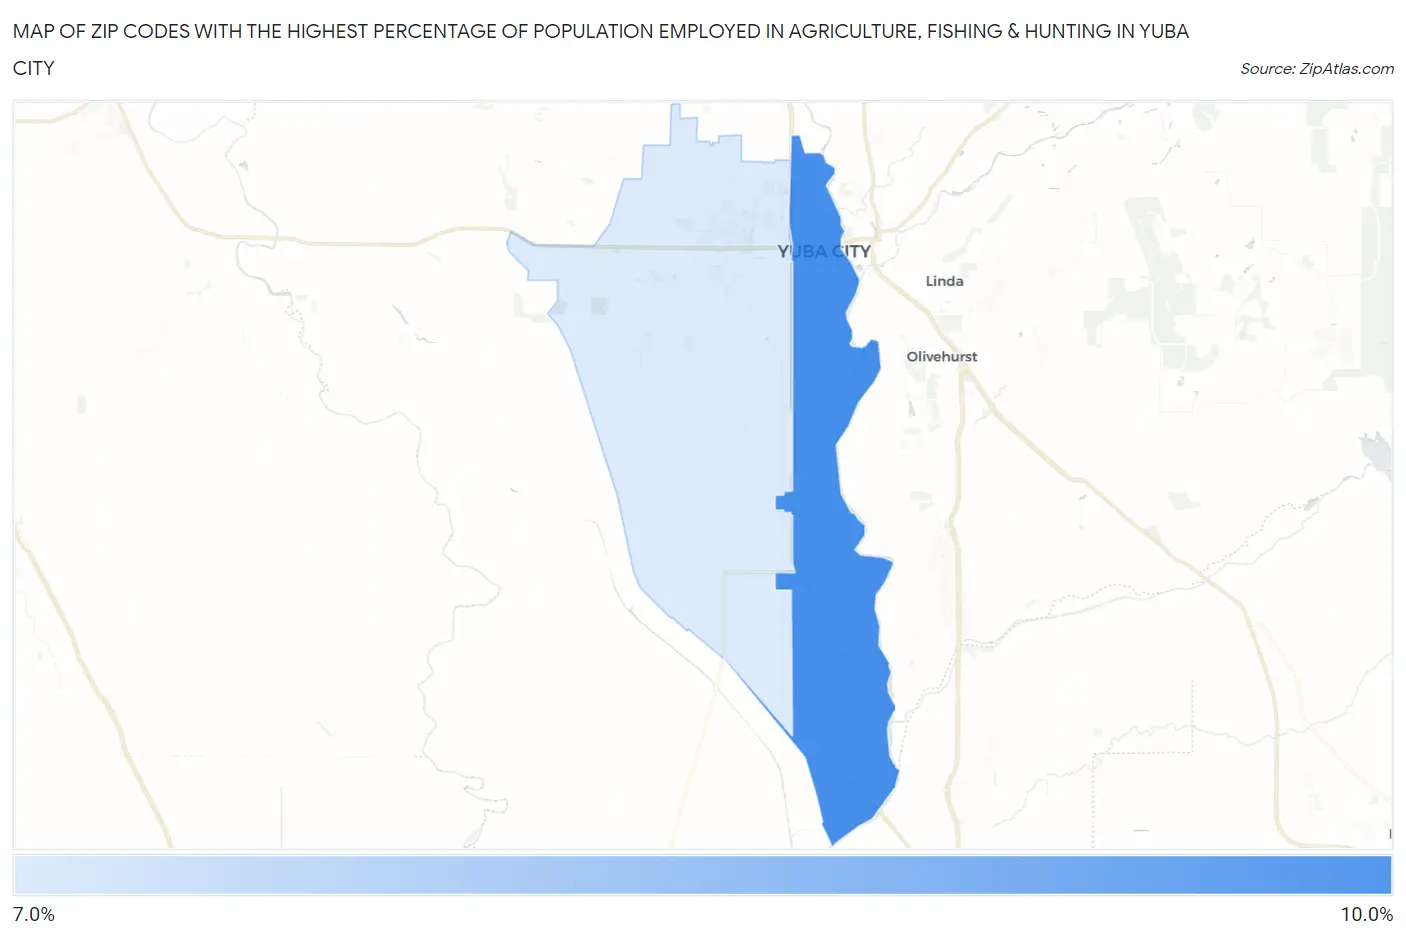
Map of Zip Codes with the Highest Percentage of Population Employed in Agriculture, Fishing & Hunting in Yuba City
0.0%
10.0%
Zip Codes with the Highest Percentage of Population Employed in Agriculture, Fishing & Hunting in Yuba City, CA
| Zip Code | % Employed | vs State | vs National | |
| 1. | 95991 | 9.7% | 2.0%(+7.72)#266 | 1.2%(+8.51)#4,476 |
| 2. | 95993 | 7.4% | 2.0%(+5.46)#315 | 1.2%(+6.24)#5,787 |
1
Common Questions
What are the Top Zip Codes with the Highest Percentage of Population Employed in Agriculture, Fishing & Hunting in Yuba City, CA?
Top Zip Codes with the Highest Percentage of Population Employed in Agriculture, Fishing & Hunting in Yuba City, CA are:
What zip code has the Highest Percentage of Population Employed in Agriculture, Fishing & Hunting in Yuba City, CA?
95991 has the Highest Percentage of Population Employed in Agriculture, Fishing & Hunting in Yuba City, CA with 9.7%.
What is the Percentage of Population Employed in Agriculture, Fishing & Hunting in Yuba City, CA?
Percentage of Population Employed in Agriculture, Fishing & Hunting in Yuba City is 8.2%.
What is the Percentage of Population Employed in Agriculture, Fishing & Hunting in California?
Percentage of Population Employed in Agriculture, Fishing & Hunting in California is 2.0%.
What is the Percentage of Population Employed in Agriculture, Fishing & Hunting in the United States?
Percentage of Population Employed in Agriculture, Fishing & Hunting in the United States is 1.2%.