Zip Codes with the Highest Percentage of Population Employed in Farming, Fishing & Forestry in Woodland, CA

RELATED REPORTS & OPTIONS

Farming, Fishing & Forestry
Population
Families and Households
Female Fertility
Female Fertility (Unmarried)
Race (Community Size)
Race (Percentage)
Ancestry (Community Size)
Ancestry (Percentage)
Immigrant Origin (Total)
Immigrant Origin (Percentage)
Income
Income (Families)
Income (Households)
Poverty
Poverty (Families)
Unemployment
Employment Occupations
Employment Industries
Employer Class
Commute Time
Commute Means
School Enrollment
Education by Degree Field
Occupancy
Finances
Physical Characteristics
Woodland
States
California Cities
AlhambraAnaheimApple ValleyAuburnBakersfieldBerkeleyBuena ParkCamarilloCanoga ParkCanyon CountryCastro ValleyChicoChula VistaCitrus HeightsClovisComptonConcordCoronaCosta MesaCovinaDaly CityDavisDesert Hot SpringsDuarteEl CajonEl MonteElk GroveEscondidoEurekaFairfieldFontanaFremontFresnoFullertonGarden GroveGardenaGlendaleGlendoraGrass ValleyHaywardHemetHesperiaHuntington BeachIndioInglewoodIrvineLa MesaLa PuenteLake ElsinoreLakewoodLancasterLivermoreLodiLong BeachLos AngelesLos GatosMaderaMantecaMenifeeMercedMission ViejoModestoMoreno ValleyMountain ViewMurrietaNapaNorth HollywoodNovatoOaklandOceansideOntarioOrangeOrovilleOxnardPalm SpringsPalmdalePalo AltoPerrisPetalumaPomonaPortervilleRancho CordovaRancho CucamongaReddingRedlandsRedwood CityRialtoRichmondRiversideRocklinRosevilleSacramentoSalinasSan BernardinoSan DiegoSan FranciscoSan GabrielSan JacintoSan JoseSan LeandroSan Luis ObispoSan MarcosSan MateoSan PedroSan RafaelSanta AnaSanta BarbaraSanta ClaraSanta CruzSanta MariaSanta MonicaSanta RosaSimi ValleySpring ValleyStocktonSunnyvaleTemeculaThousand OaksTorranceTracyTurlockTustinUplandVacavilleVallejoVan NuysVenturaVictorvilleVisaliaVistaWalnut CreekWest CovinaWest SacramentoWhittierWoodlandYorba LindaYuba City
Compare Zip Codes
Comparison Subject

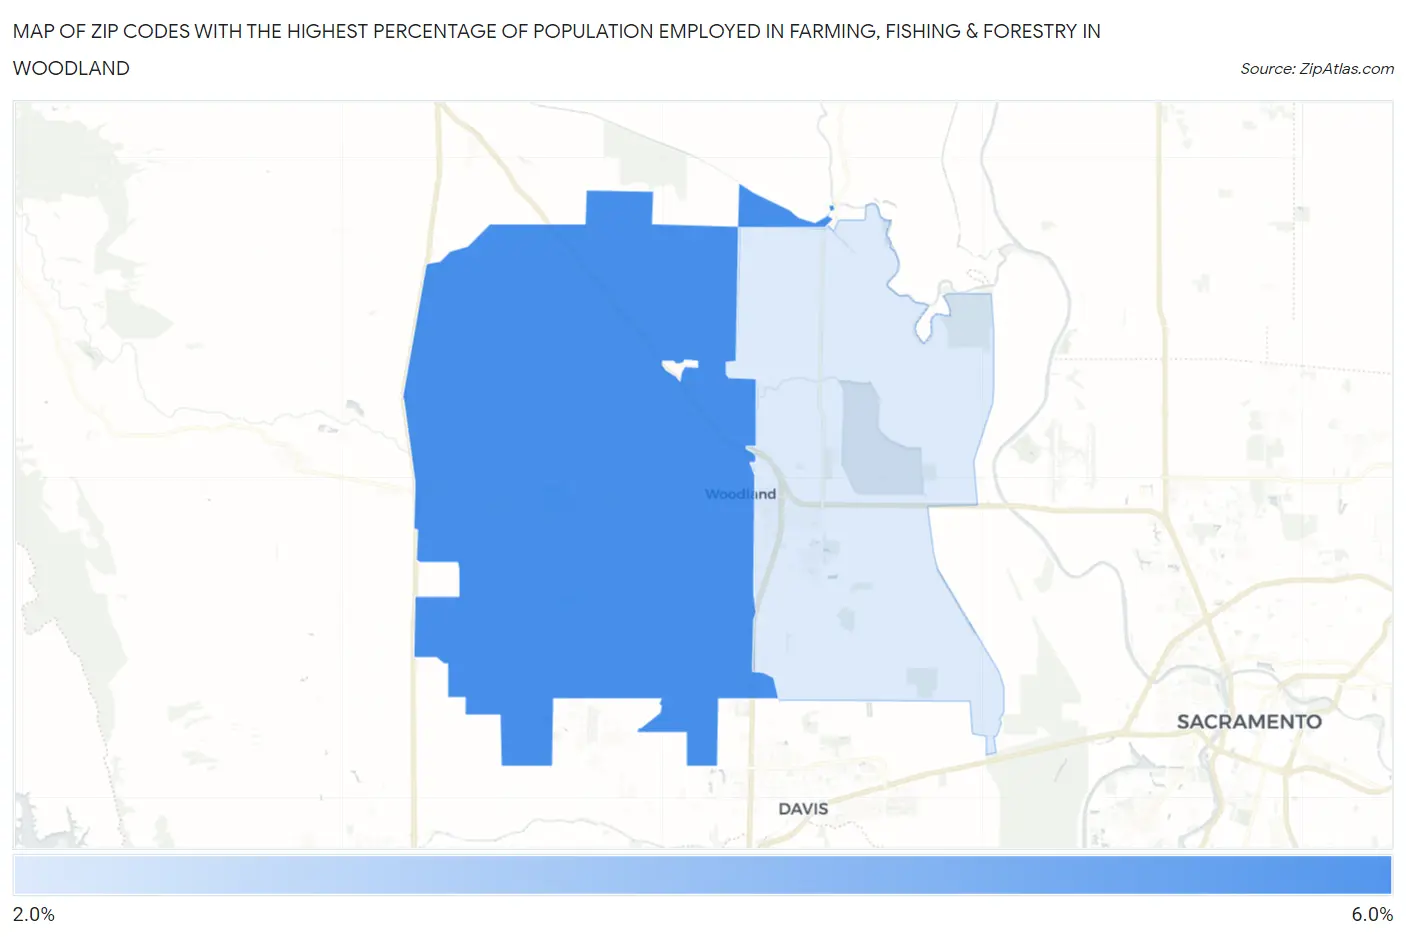
Map of Zip Codes with the Highest Percentage of Population Employed in Farming, Fishing & Forestry in Woodland

0.0%
6.0%
Zip Codes with the Highest Percentage of Population Employed in Farming, Fishing & Forestry in Woodland Map

Zip Codes with the Highest Percentage of Population Employed in Farming, Fishing & Forestry in Woodland, CA

Zip Code % Employed vs State vs National
1.956955.3%1.4%(+3.85)#2330.61%(+4.65)#2,765
2.957762.9%1.4%(+1.53)#3160.61%(+2.33)#4,909

Common Questions

What are the Top Zip Codes with the Highest Percentage of Population Employed in Farming, Fishing & Forestry in Woodland, CA?
Top Zip Codes with the Highest Percentage of Population Employed in Farming, Fishing & Forestry in Woodland, CA are:
#1
5.3%
#2
2.9%
What zip code has the Highest Percentage of Population Employed in Farming, Fishing & Forestry in Woodland, CA?
95695 has the Highest Percentage of Population Employed in Farming, Fishing & Forestry in Woodland, CA with 5.3%.
What is the Percentage of Population Employed in Farming, Fishing & Forestry in Woodland, CA?
Percentage of Population Employed in Farming, Fishing & Forestry in Woodland is 4.4%.
What is the Percentage of Population Employed in Farming, Fishing & Forestry in California?
Percentage of Population Employed in Farming, Fishing & Forestry in California is 1.4%.
What is the Percentage of Population Employed in Farming, Fishing & Forestry in the United States?
Percentage of Population Employed in Farming, Fishing & Forestry in the United States is 0.61%.