Zip Codes with the Highest Percentage of Population Employed in Farming, Fishing & Forestry in Stockton, CA

RELATED REPORTS & OPTIONS

Farming, Fishing & Forestry
Population
Families and Households
Female Fertility
Female Fertility (Unmarried)
Race (Community Size)
Race (Percentage)
Ancestry (Community Size)
AfghanAfricanAlbanianAmericanApacheArabArgentineanArmenianAssyrian / Chaldean / SyriacAustrianBangladeshiBasqueBelgianBhutaneseBlackfeetBolivianBrazilianBritishBurmeseCanadianCape VerdeanCentral AmericanCentral American IndianCherokeeCheyenneChickasawChileanChippewaChoctawColombianCreekCroatianCubanCzechCzechoslovakianDanishDutchEastern EuropeanEcuadorianEgyptianEnglishEthiopianEuropeanFilipinoFinnishFrenchFrench American IndianFrench CanadianGermanGerman RussianGhanaianGreekGuamanian / ChamorroGuatemalanHaitianHonduranHopiHungarianIcelanderIndian (Asian)IndonesianIranianIrishIroquoisIsraeliItalianJamaicanJapaneseKenyanKoreanLaotianLatvianLebaneseLiberianLithuanianMalaysianMexicanMexican American IndianNative HawaiianNavajoNepaleseNicaraguanNigerianNorthern EuropeanNorwegianPaiutePakistaniPalestinianPanamanianPeruvianPolishPortuguesePotawatomiPuerto RicanRomanianRussianSalvadoranSamoanScandinavianScotch-IrishScottishSerbianSiouxSlavicSloveneSouth AmericanSouth American IndianSpaniardSpanishSri LankanSubsaharan AfricanSwedishSwissSyrianThaiTonganTrinidadian and TobagonianUkrainianVenezuelanVietnameseWelshWest IndianYakamaYaquiYugoslavian
Ancestry (Percentage)
AfghanAfricanAlbanianAmericanApacheArabArgentineanArmenianAssyrian / Chaldean / SyriacAustrianBangladeshiBasqueBelgianBhutaneseBlackfeetBolivianBrazilianBritishBurmeseCanadianCape VerdeanCentral AmericanCentral American IndianCherokeeCheyenneChickasawChileanChippewaChoctawColombianCreekCroatianCubanCzechCzechoslovakianDanishDutchEastern EuropeanEcuadorianEgyptianEnglishEthiopianEuropeanFilipinoFinnishFrenchFrench American IndianFrench CanadianGermanGerman RussianGhanaianGreekGuamanian / ChamorroGuatemalanHaitianHonduranHopiHungarianIcelanderIndian (Asian)IndonesianIranianIrishIroquoisIsraeliItalianJamaicanJapaneseKenyanKoreanLaotianLatvianLebaneseLiberianLithuanianMalaysianMexicanMexican American IndianNative HawaiianNavajoNepaleseNicaraguanNigerianNorthern EuropeanNorwegianPaiutePakistaniPalestinianPanamanianPeruvianPolishPortuguesePotawatomiPuerto RicanRomanianRussianSalvadoranSamoanScandinavianScotch-IrishScottishSerbianSiouxSlavicSloveneSouth AmericanSouth American IndianSpaniardSpanishSri LankanSubsaharan AfricanSwedishSwissSyrianThaiTonganTrinidadian and TobagonianUkrainianVenezuelanVietnameseWelshWest IndianYakamaYaquiYugoslavian
Immigrant Origin (Total)
Immigrant Origin (Percentage)
Income
Income (Families)
Income (Households)
Poverty
Poverty (Families)
Unemployment
Employment Occupations
Employment Industries
Employer Class
Commute Time
Commute Means
School Enrollment
Education by Degree Field
Occupancy
Finances
Physical Characteristics
Stockton
States
California Cities
AlhambraAnaheimApple ValleyAuburnBakersfieldBerkeleyBuena ParkCamarilloCanoga ParkCanyon CountryCastro ValleyChicoChula VistaCitrus HeightsClovisComptonConcordCoronaCosta MesaCovinaDaly CityDavisDesert Hot SpringsDuarteEl CajonEl MonteElk GroveEscondidoEurekaFairfieldFontanaFremontFresnoFullertonGarden GroveGardenaGlendaleGlendoraGrass ValleyHaywardHemetHesperiaHuntington BeachIndioInglewoodIrvineLa MesaLa PuenteLake ElsinoreLakewoodLancasterLivermoreLodiLong BeachLos AngelesLos GatosMaderaMantecaMenifeeMercedMission ViejoModestoMoreno ValleyMountain ViewMurrietaNapaNorth HollywoodNovatoOaklandOceansideOntarioOrangeOrovilleOxnardPalm SpringsPalmdalePalo AltoPerrisPetalumaPomonaPortervilleRancho CordovaRancho CucamongaReddingRedlandsRedwood CityRialtoRichmondRiversideRocklinRosevilleSacramentoSalinasSan BernardinoSan DiegoSan FranciscoSan GabrielSan JacintoSan JoseSan LeandroSan Luis ObispoSan MarcosSan MateoSan PedroSan RafaelSanta AnaSanta BarbaraSanta ClaraSanta CruzSanta MariaSanta MonicaSanta RosaSimi ValleySpring ValleyStocktonSunnyvaleTemeculaThousand OaksTorranceTracyTurlockTustinUplandVacavilleVallejoVan NuysVenturaVictorvilleVisaliaVistaWalnut CreekWest CovinaWest SacramentoWhittierWoodlandYorba LindaYuba City
Compare Zip Codes
Comparison Subject

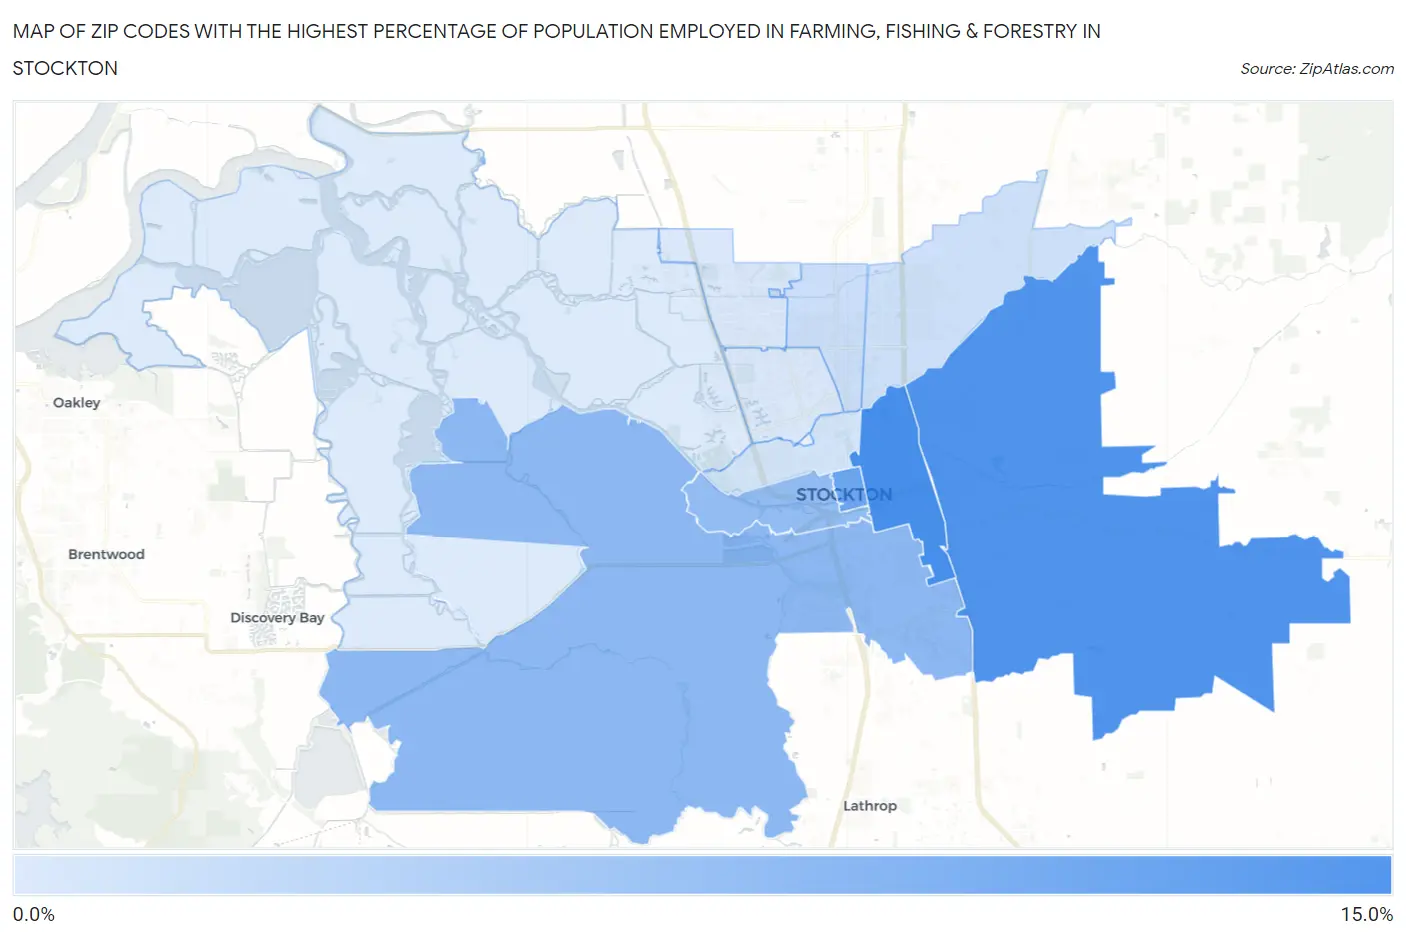
Map of Zip Codes with the Highest Percentage of Population Employed in Farming, Fishing & Forestry in Stockton

0.0%
15.0%
Zip Codes with the Highest Percentage of Population Employed in Farming, Fishing & Forestry in Stockton Map

Zip Codes with the Highest Percentage of Population Employed in Farming, Fishing & Forestry in Stockton, CA

Zip Code % Employed vs State vs National
1.9520514.1%1.4%(+12.7)#1170.61%(+13.5)#710
2.9521513.5%1.4%(+12.1)#1250.61%(+12.9)#769
3.9520210.4%1.4%(+9.04)#1500.61%(+9.84)#1,134
4.952067.6%1.4%(+6.16)#1950.61%(+6.96)#1,799
5.952036.9%1.4%(+5.46)#2060.61%(+6.26)#2,038
6.952102.0%1.4%(+0.566)#3830.61%(+1.37)#6,615
7.952121.6%1.4%(+0.205)#4100.61%(+1.01)#7,539
8.952041.2%1.4%(-0.208)#4670.61%(+0.597)#8,918
9.952090.58%1.4%(-0.829)#6430.61%(-0.024)#12,193
10.952070.42%1.4%(-0.988)#7350.61%(-0.183)#13,573
11.952190.31%1.4%(-1.10)#8370.61%(-0.297)#14,726

Common Questions

What are the Top 10 Zip Codes with the Highest Percentage of Population Employed in Farming, Fishing & Forestry in Stockton, CA?
Top 10 Zip Codes with the Highest Percentage of Population Employed in Farming, Fishing & Forestry in Stockton, CA are:
#1
14.1%
#2
13.5%
#3
10.4%
#4
7.6%
#5
6.9%
#6
2.0%
#7
1.6%
#8
1.2%
#9
0.58%
#10
0.42%
What zip code has the Highest Percentage of Population Employed in Farming, Fishing & Forestry in Stockton, CA?
95205 has the Highest Percentage of Population Employed in Farming, Fishing & Forestry in Stockton, CA with 14.1%.
What is the Percentage of Population Employed in Farming, Fishing & Forestry in Stockton, CA?
Percentage of Population Employed in Farming, Fishing & Forestry in Stockton is 3.4%.
What is the Percentage of Population Employed in Farming, Fishing & Forestry in California?
Percentage of Population Employed in Farming, Fishing & Forestry in California is 1.4%.
What is the Percentage of Population Employed in Farming, Fishing & Forestry in the United States?
Percentage of Population Employed in Farming, Fishing & Forestry in the United States is 0.61%.