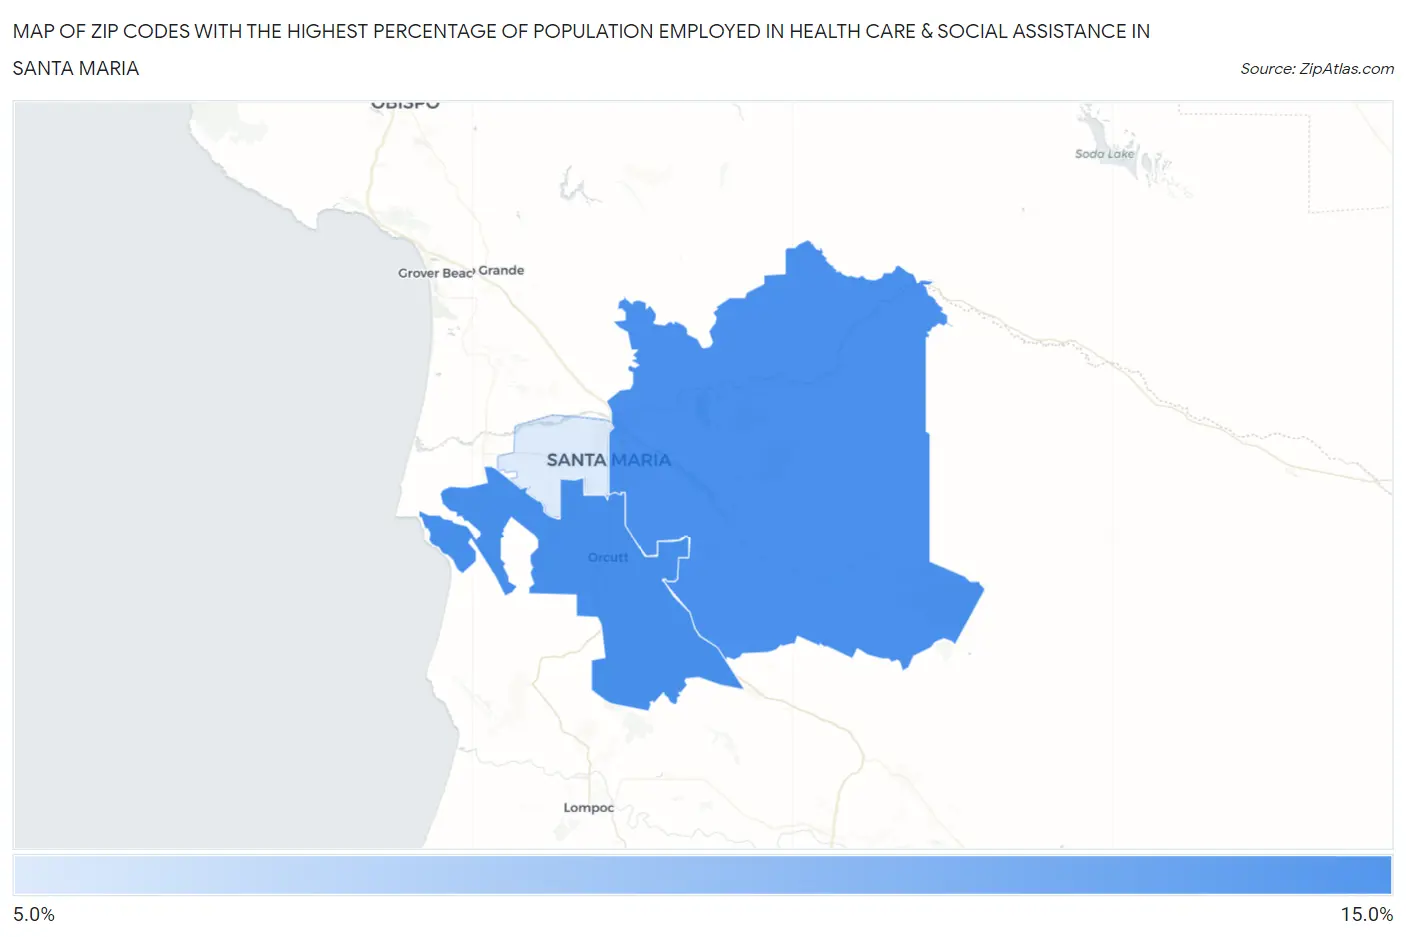
Zip Codes with the Highest Percentage of Population Employed in Health Care & Social Assistance in Santa Maria, CA
RELATED REPORTS & OPTIONS
Health Care & Social Assistance
Santa Maria
Compare Zip Codes
Map of Zip Codes with the Highest Percentage of Population Employed in Health Care & Social Assistance in Santa Maria
0.0%
15.0%
Zip Codes with the Highest Percentage of Population Employed in Health Care & Social Assistance in Santa Maria, CA
| Zip Code | % Employed | vs State | vs National | |
| 1. | 93455 | 11.3% | 12.7%(-1.39)#981 | 13.9%(-2.59)#20,571 |
| 2. | 93454 | 11.3% | 12.7%(-1.42)#986 | 13.9%(-2.61)#20,629 |
| 3. | 93458 | 9.5% | 12.7%(-3.21)#1,233 | 13.9%(-4.41)#24,309 |
1
Common Questions
What are the Top Zip Codes with the Highest Percentage of Population Employed in Health Care & Social Assistance in Santa Maria, CA?
Top Zip Codes with the Highest Percentage of Population Employed in Health Care & Social Assistance in Santa Maria, CA are:
What zip code has the Highest Percentage of Population Employed in Health Care & Social Assistance in Santa Maria, CA?
93455 has the Highest Percentage of Population Employed in Health Care & Social Assistance in Santa Maria, CA with 11.3%.
What is the Percentage of Population Employed in Health Care & Social Assistance in Santa Maria, CA?
Percentage of Population Employed in Health Care & Social Assistance in Santa Maria is 10.8%.
What is the Percentage of Population Employed in Health Care & Social Assistance in California?
Percentage of Population Employed in Health Care & Social Assistance in California is 12.7%.
What is the Percentage of Population Employed in Health Care & Social Assistance in the United States?
Percentage of Population Employed in Health Care & Social Assistance in the United States is 13.9%.