Zip Codes with the Highest Percentage of White / Caucasian Population in San Jose, CA
RELATED REPORTS & OPTIONS
White / Caucasian
San Jose
Compare Zip Codes
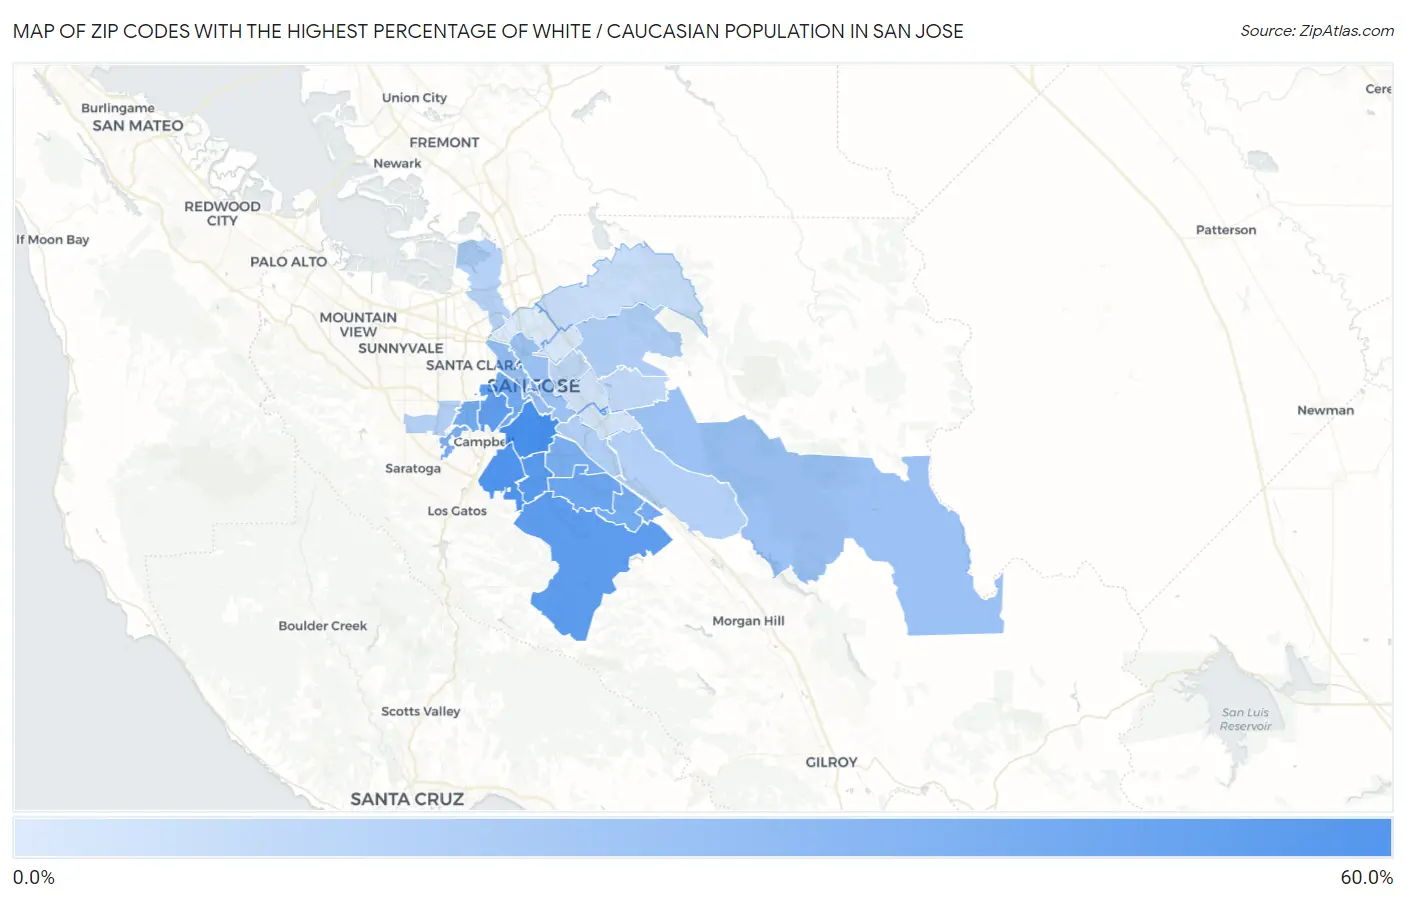
Map of Zip Codes with the Highest Percentage of White / Caucasian Population in San Jose
11.6%
58.9%
Zip Codes with the Highest Percentage of White / Caucasian Population in San Jose, CA
| Zip Code | White / Caucasian | vs State | vs National | |
| 1. | 95125 | 58.9% | 48.1%(+10.8)#941 | 65.9%(-6.96)#27,522 |
| 2. | 95124 | 55.4% | 48.1%(+7.24)#1,032 | 65.9%(-10.5)#28,236 |
| 3. | 95118 | 52.9% | 48.1%(+4.78)#1,097 | 65.9%(-13.0)#28,694 |
| 4. | 95120 | 50.6% | 48.1%(+2.45)#1,152 | 65.9%(-15.3)#29,084 |
| 5. | 95128 | 50.0% | 48.1%(+1.83)#1,165 | 65.9%(-15.9)#29,196 |
| 6. | 95123 | 45.4% | 48.1%(-2.78)#1,258 | 65.9%(-20.5)#29,864 |
| 7. | 95113 | 43.2% | 48.1%(-4.91)#1,310 | 65.9%(-22.7)#30,154 |
| 8. | 95126 | 42.8% | 48.1%(-5.36)#1,318 | 65.9%(-23.1)#30,213 |
| 9. | 95119 | 42.5% | 48.1%(-5.60)#1,322 | 65.9%(-23.3)#30,238 |
| 10. | 95117 | 42.2% | 48.1%(-5.95)#1,329 | 65.9%(-23.7)#30,275 |
| 11. | 95139 | 42.0% | 48.1%(-6.08)#1,333 | 65.9%(-23.8)#30,293 |
| 12. | 95130 | 41.1% | 48.1%(-7.05)#1,346 | 65.9%(-24.8)#30,409 |
| 13. | 95136 | 40.0% | 48.1%(-8.12)#1,365 | 65.9%(-25.9)#30,517 |
| 14. | 95110 | 31.4% | 48.1%(-16.8)#1,532 | 65.9%(-34.5)#31,375 |
| 15. | 95112 | 30.1% | 48.1%(-18.0)#1,555 | 65.9%(-35.7)#31,476 |
| 16. | 95135 | 29.6% | 48.1%(-18.5)#1,566 | 65.9%(-36.3)#31,530 |
| 17. | 95127 | 24.1% | 48.1%(-24.1)#1,634 | 65.9%(-41.8)#31,883 |
| 18. | 95111 | 23.4% | 48.1%(-24.8)#1,646 | 65.9%(-42.5)#31,932 |
| 19. | 95138 | 23.1% | 48.1%(-25.1)#1,651 | 65.9%(-42.8)#31,951 |
| 20. | 95129 | 22.3% | 48.1%(-25.8)#1,665 | 65.9%(-43.6)#32,014 |
| 21. | 95134 | 22.2% | 48.1%(-25.9)#1,667 | 65.9%(-43.7)#32,023 |
| 22. | 95116 | 19.9% | 48.1%(-28.3)#1,686 | 65.9%(-46.0)#32,133 |
| 23. | 95148 | 18.9% | 48.1%(-29.2)#1,701 | 65.9%(-47.0)#32,190 |
| 24. | 95132 | 17.1% | 48.1%(-31.0)#1,718 | 65.9%(-48.8)#32,298 |
| 25. | 95122 | 14.5% | 48.1%(-33.6)#1,732 | 65.9%(-51.4)#32,409 |
| 26. | 95121 | 14.0% | 48.1%(-34.1)#1,735 | 65.9%(-51.9)#32,436 |
| 27. | 95133 | 12.7% | 48.1%(-35.5)#1,743 | 65.9%(-53.2)#32,499 |
| 28. | 95131 | 11.6% | 48.1%(-36.6)#1,746 | 65.9%(-54.3)#32,550 |
1
Common Questions
What are the Top 10 Zip Codes with the Highest Percentage of White / Caucasian Population in San Jose, CA?
Top 10 Zip Codes with the Highest Percentage of White / Caucasian Population in San Jose, CA are:
What zip code has the Highest Percentage of White / Caucasian Population in San Jose, CA?
95125 has the Highest Percentage of White / Caucasian Population in San Jose, CA with 58.9%.
What is the Percentage of White / Caucasian Population in San Jose, CA?
Percentage of White / Caucasian Population in San Jose is 32.0%.
What is the Percentage of White / Caucasian Population in California?
Percentage of White / Caucasian Population in California is 48.1%.
What is the Percentage of White / Caucasian Population in the United States?
Percentage of White / Caucasian Population in the United States is 65.9%.