Zip Codes with the Highest Percentage of Population Employed in Sales & Related in San Jose, CA
RELATED REPORTS & OPTIONS
Sales & Related
San Jose
Compare Zip Codes
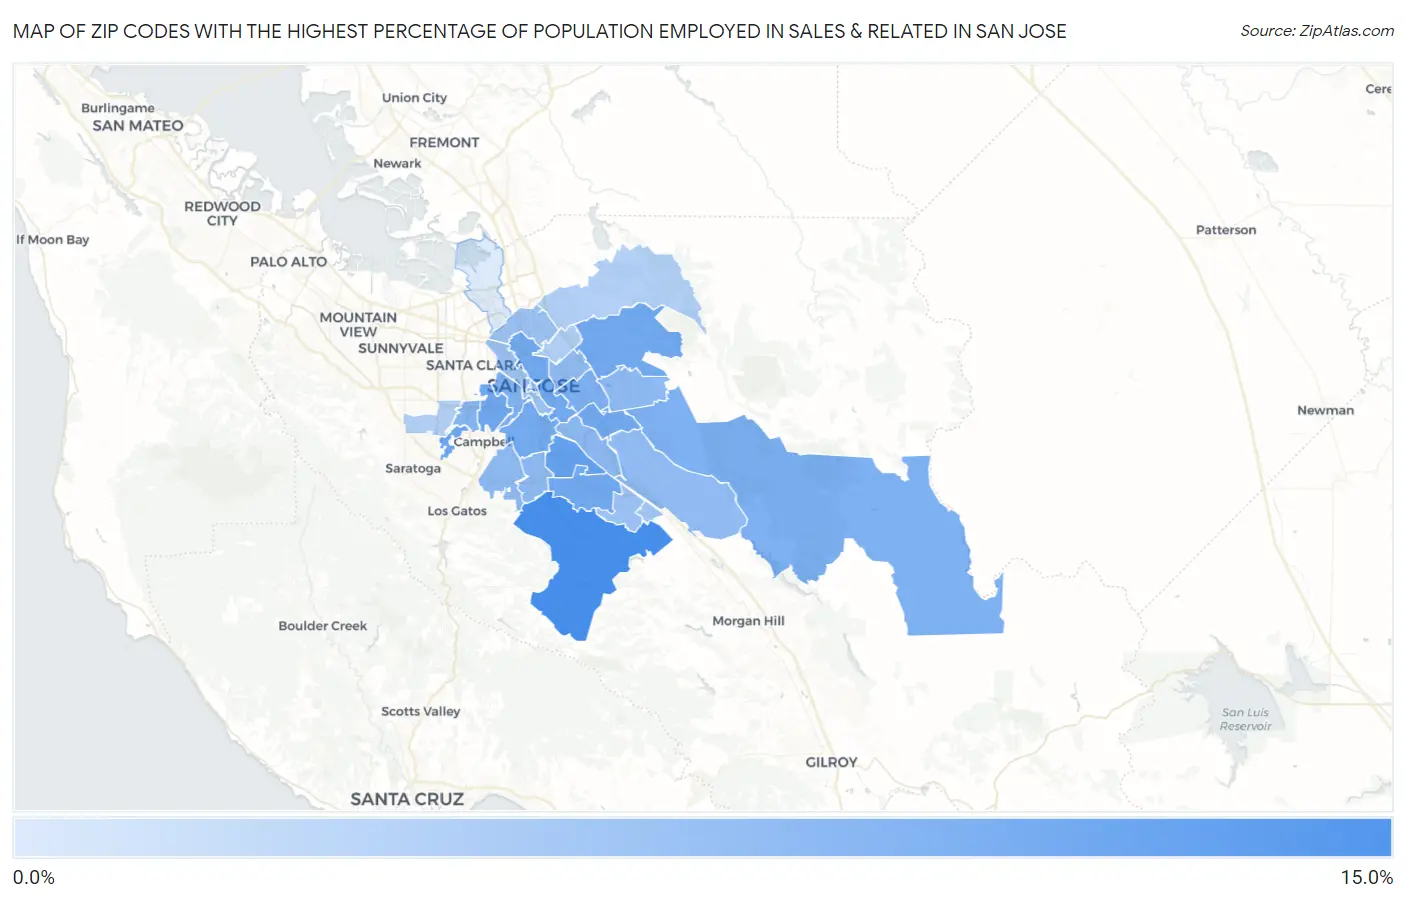
Map of Zip Codes with the Highest Percentage of Population Employed in Sales & Related in San Jose
4.0%
11.2%
Zip Codes with the Highest Percentage of Population Employed in Sales & Related in San Jose, CA
| Zip Code | % Employed | vs State | vs National | |
| 1. | 95120 | 11.2% | 9.4%(+1.74)#376 | 9.6%(+1.59)#7,734 |
| 2. | 95136 | 9.7% | 9.4%(+0.235)#690 | 9.6%(+0.087)#12,097 |
| 3. | 95130 | 9.2% | 9.4%(-0.209)#820 | 9.6%(-0.356)#13,647 |
| 4. | 95128 | 9.2% | 9.4%(-0.260)#830 | 9.6%(-0.407)#13,830 |
| 5. | 95123 | 9.1% | 9.4%(-0.380)#871 | 9.6%(-0.527)#14,272 |
| 6. | 95127 | 9.0% | 9.4%(-0.425)#882 | 9.6%(-0.573)#14,429 |
| 7. | 95121 | 9.0% | 9.4%(-0.472)#895 | 9.6%(-0.619)#14,589 |
| 8. | 95112 | 9.0% | 9.4%(-0.472)#896 | 9.6%(-0.620)#14,590 |
| 9. | 95125 | 9.0% | 9.4%(-0.494)#899 | 9.6%(-0.642)#14,688 |
| 10. | 95135 | 8.5% | 9.4%(-0.967)#1,014 | 9.6%(-1.11)#16,419 |
| 11. | 95122 | 8.4% | 9.4%(-1.03)#1,037 | 9.6%(-1.18)#16,638 |
| 12. | 95126 | 8.3% | 9.4%(-1.12)#1,053 | 9.6%(-1.27)#16,963 |
| 13. | 95117 | 8.0% | 9.4%(-1.44)#1,114 | 9.6%(-1.59)#18,027 |
| 14. | 95113 | 7.8% | 9.4%(-1.65)#1,151 | 9.6%(-1.80)#18,685 |
| 15. | 95111 | 7.8% | 9.4%(-1.67)#1,158 | 9.6%(-1.82)#18,766 |
| 16. | 95148 | 7.7% | 9.4%(-1.75)#1,174 | 9.6%(-1.90)#19,001 |
| 17. | 95118 | 7.7% | 9.4%(-1.79)#1,184 | 9.6%(-1.94)#19,149 |
| 18. | 95124 | 7.7% | 9.4%(-1.79)#1,186 | 9.6%(-1.94)#19,165 |
| 19. | 95116 | 7.6% | 9.4%(-1.85)#1,191 | 9.6%(-2.00)#19,343 |
| 20. | 95138 | 7.6% | 9.4%(-1.88)#1,198 | 9.6%(-2.02)#19,435 |
| 21. | 95119 | 7.1% | 9.4%(-2.34)#1,258 | 9.6%(-2.49)#20,886 |
| 22. | 95131 | 7.1% | 9.4%(-2.35)#1,260 | 9.6%(-2.49)#20,911 |
| 23. | 95110 | 6.9% | 9.4%(-2.54)#1,277 | 9.6%(-2.69)#21,455 |
| 24. | 95139 | 6.7% | 9.4%(-2.78)#1,308 | 9.6%(-2.93)#22,032 |
| 25. | 95133 | 6.0% | 9.4%(-3.43)#1,377 | 9.6%(-3.57)#23,616 |
| 26. | 95129 | 6.0% | 9.4%(-3.50)#1,384 | 9.6%(-3.64)#23,761 |
| 27. | 95132 | 5.9% | 9.4%(-3.50)#1,386 | 9.6%(-3.65)#23,770 |
| 28. | 95134 | 4.0% | 9.4%(-5.47)#1,497 | 9.6%(-5.62)#27,063 |
1
Common Questions
What are the Top 10 Zip Codes with the Highest Percentage of Population Employed in Sales & Related in San Jose, CA?
Top 10 Zip Codes with the Highest Percentage of Population Employed in Sales & Related in San Jose, CA are:
What zip code has the Highest Percentage of Population Employed in Sales & Related in San Jose, CA?
95120 has the Highest Percentage of Population Employed in Sales & Related in San Jose, CA with 11.2%.
What is the Percentage of Population Employed in Sales & Related in San Jose, CA?
Percentage of Population Employed in Sales & Related in San Jose is 8.0%.
What is the Percentage of Population Employed in Sales & Related in California?
Percentage of Population Employed in Sales & Related in California is 9.4%.
What is the Percentage of Population Employed in Sales & Related in the United States?
Percentage of Population Employed in Sales & Related in the United States is 9.6%.