Zip Codes with the Highest Percentage of Population Employed in Arts, Entertainment & Recreation in San Jose, CA
RELATED REPORTS & OPTIONS
Arts, Entertainment & Recreation
San Jose
Compare Zip Codes
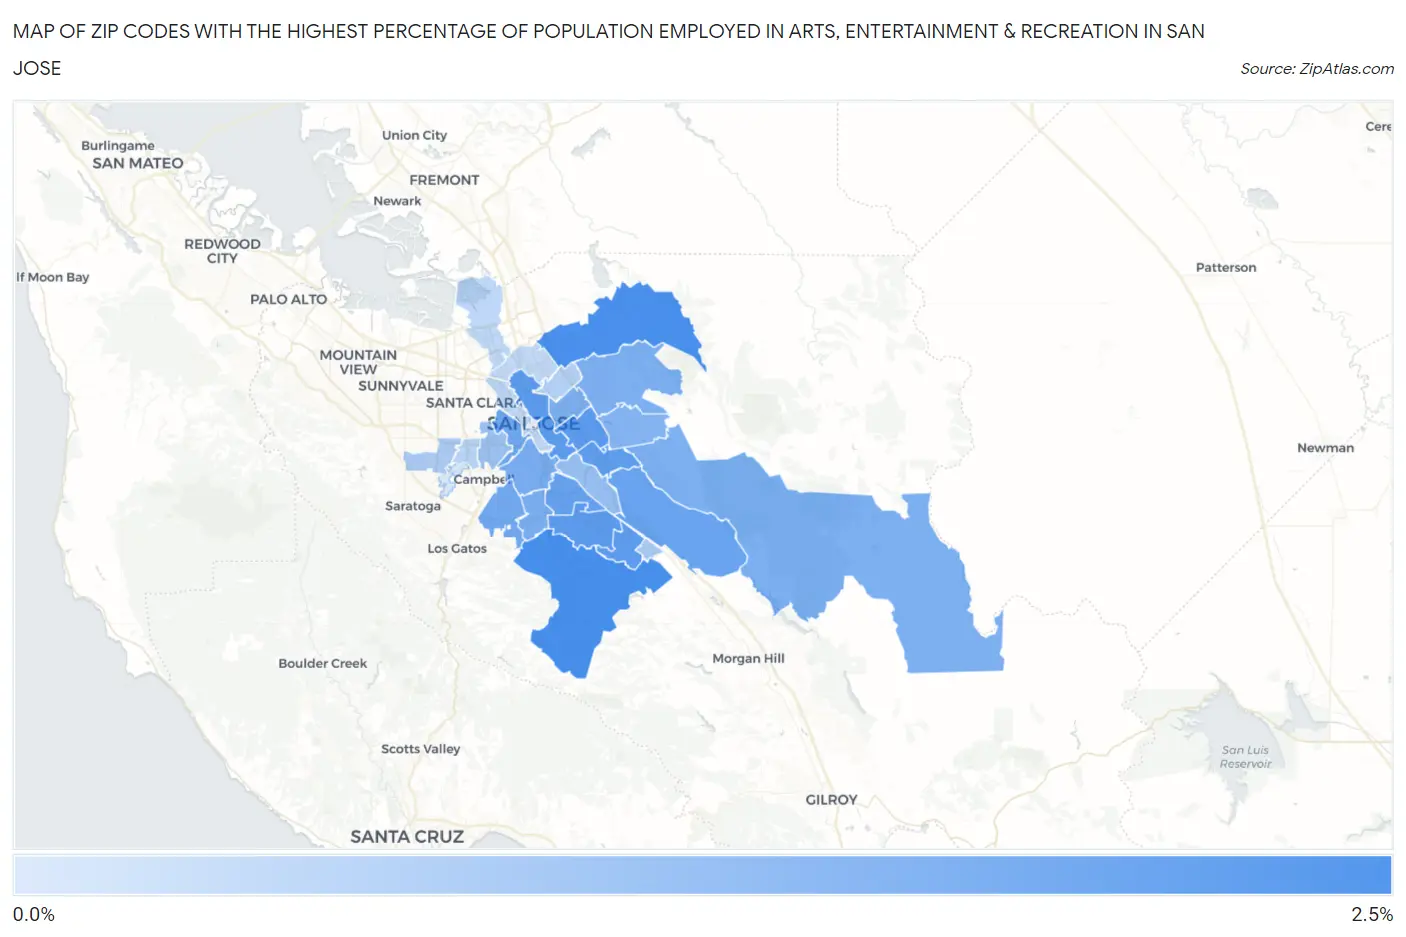
Map of Zip Codes with the Highest Percentage of Population Employed in Arts, Entertainment & Recreation in San Jose
0.0%
2.5%
Zip Codes with the Highest Percentage of Population Employed in Arts, Entertainment & Recreation in San Jose, CA
| Zip Code | % Employed | vs State | vs National | |
| 1. | 95120 | 2.5% | 2.6%(-0.069)#693 | 2.1%(+0.403)#7,237 |
| 2. | 95132 | 2.5% | 2.6%(-0.096)#713 | 2.1%(+0.375)#7,370 |
| 3. | 95112 | 2.2% | 2.6%(-0.337)#813 | 2.1%(+0.134)#8,531 |
| 4. | 95123 | 2.2% | 2.6%(-0.358)#825 | 2.1%(+0.113)#8,666 |
| 5. | 95122 | 2.2% | 2.6%(-0.359)#826 | 2.1%(+0.113)#8,670 |
| 6. | 95119 | 2.2% | 2.6%(-0.394)#843 | 2.1%(+0.078)#8,859 |
| 7. | 95121 | 2.1% | 2.6%(-0.439)#870 | 2.1%(+0.032)#9,129 |
| 8. | 95136 | 2.0% | 2.6%(-0.535)#912 | 2.1%(-0.063)#9,653 |
| 9. | 95138 | 2.0% | 2.6%(-0.549)#916 | 2.1%(-0.077)#9,743 |
| 10. | 95126 | 1.9% | 2.6%(-0.630)#945 | 2.1%(-0.159)#10,227 |
| 11. | 95124 | 1.9% | 2.6%(-0.695)#974 | 2.1%(-0.223)#10,633 |
| 12. | 95125 | 1.7% | 2.6%(-0.806)#1,021 | 2.1%(-0.334)#11,386 |
| 13. | 95135 | 1.7% | 2.6%(-0.834)#1,033 | 2.1%(-0.363)#11,596 |
| 14. | 95118 | 1.7% | 2.6%(-0.835)#1,035 | 2.1%(-0.363)#11,599 |
| 15. | 95116 | 1.7% | 2.6%(-0.868)#1,051 | 2.1%(-0.397)#11,846 |
| 16. | 95127 | 1.7% | 2.6%(-0.871)#1,052 | 2.1%(-0.400)#11,861 |
| 17. | 95148 | 1.6% | 2.6%(-0.955)#1,082 | 2.1%(-0.484)#12,465 |
| 18. | 95111 | 1.3% | 2.6%(-1.23)#1,190 | 2.1%(-0.760)#14,556 |
| 19. | 95128 | 1.3% | 2.6%(-1.24)#1,194 | 2.1%(-0.765)#14,584 |
| 20. | 95139 | 1.1% | 2.6%(-1.44)#1,268 | 2.1%(-0.971)#16,147 |
| 21. | 95129 | 1.0% | 2.6%(-1.51)#1,284 | 2.1%(-1.03)#16,597 |
| 22. | 95133 | 0.91% | 2.6%(-1.64)#1,311 | 2.1%(-1.17)#17,615 |
| 23. | 95117 | 0.85% | 2.6%(-1.70)#1,324 | 2.1%(-1.23)#18,057 |
| 24. | 95134 | 0.78% | 2.6%(-1.78)#1,344 | 2.1%(-1.30)#18,561 |
| 25. | 95131 | 0.76% | 2.6%(-1.79)#1,347 | 2.1%(-1.32)#18,663 |
| 26. | 95110 | 0.74% | 2.6%(-1.81)#1,351 | 2.1%(-1.34)#18,822 |
| 27. | 95130 | 0.37% | 2.6%(-2.19)#1,413 | 2.1%(-1.72)#21,324 |
1
Common Questions
What are the Top 10 Zip Codes with the Highest Percentage of Population Employed in Arts, Entertainment & Recreation in San Jose, CA?
Top 10 Zip Codes with the Highest Percentage of Population Employed in Arts, Entertainment & Recreation in San Jose, CA are:
What zip code has the Highest Percentage of Population Employed in Arts, Entertainment & Recreation in San Jose, CA?
95120 has the Highest Percentage of Population Employed in Arts, Entertainment & Recreation in San Jose, CA with 2.5%.
What is the Percentage of Population Employed in Arts, Entertainment & Recreation in San Jose, CA?
Percentage of Population Employed in Arts, Entertainment & Recreation in San Jose is 1.7%.
What is the Percentage of Population Employed in Arts, Entertainment & Recreation in California?
Percentage of Population Employed in Arts, Entertainment & Recreation in California is 2.6%.
What is the Percentage of Population Employed in Arts, Entertainment & Recreation in the United States?
Percentage of Population Employed in Arts, Entertainment & Recreation in the United States is 2.1%.