Zip Codes with the Highest Percentage of Households Heated by Bottled Gas / Liquid Propane in San Jose, CA
RELATED REPORTS & OPTIONS
Bottled Gas / LP Heating
San Jose
Compare Zip Codes
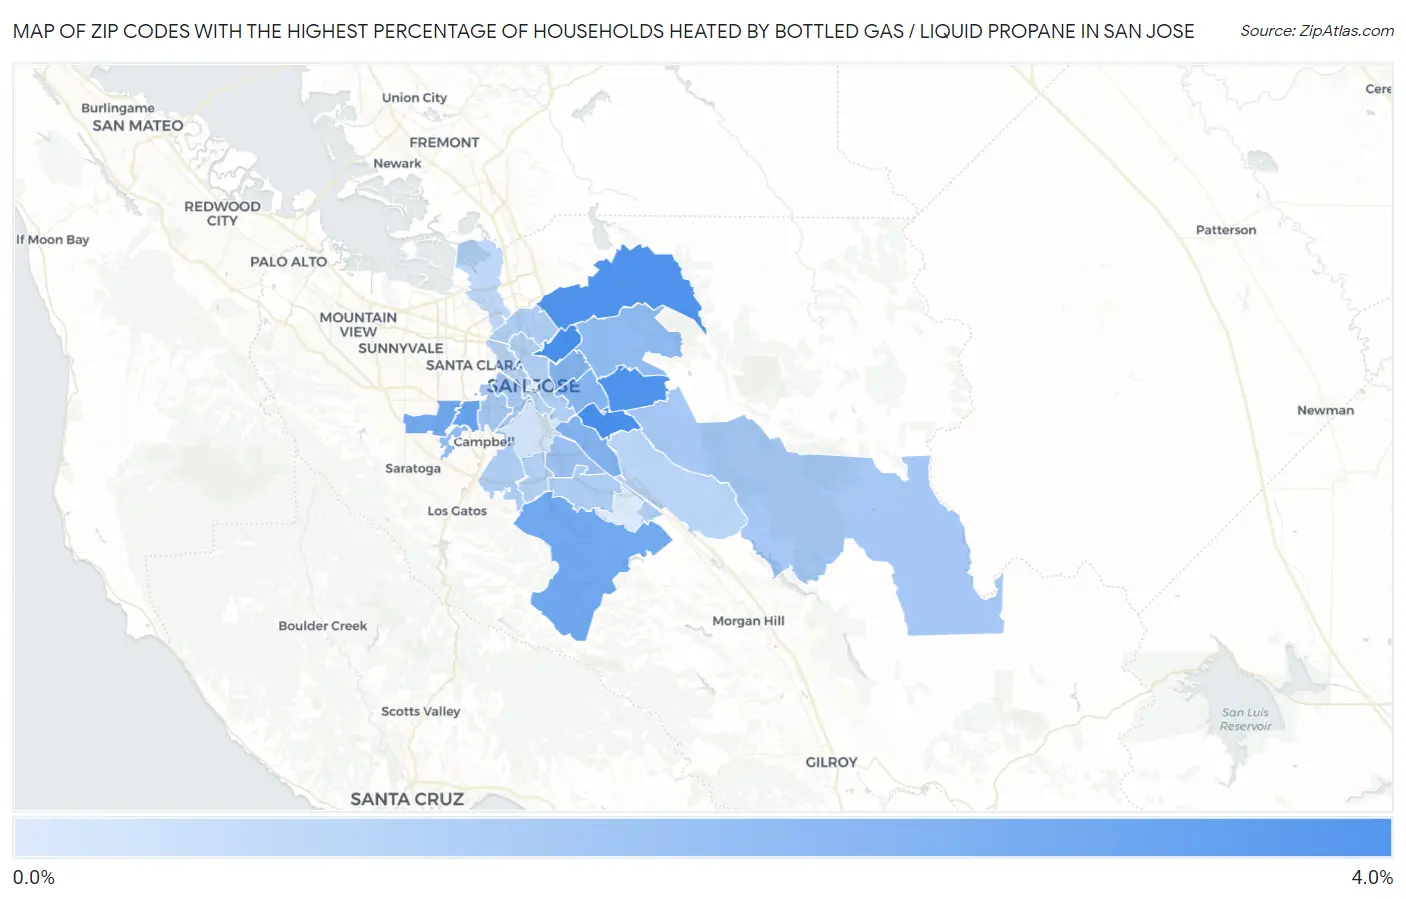
Map of Zip Codes with the Highest Percentage of Households Heated by Bottled Gas / Liquid Propane in San Jose
0.0%
4.0%
Zip Codes with the Highest Percentage of Households Heated by Bottled Gas / Liquid Propane in San Jose, CA
| Zip Code | Bottled Gas / LP Heating | vs State | vs National | |
| 1. | 95121 | 3.2% | 3.5%(-0.300)#700 | 4.9%(-1.70)#20,664 |
| 2. | 95133 | 3.2% | 3.5%(-0.300)#704 | 4.9%(-1.70)#20,681 |
| 3. | 95148 | 3.0% | 3.5%(-0.500)#721 | 4.9%(-1.90)#20,987 |
| 4. | 95132 | 3.0% | 3.5%(-0.500)#722 | 4.9%(-1.90)#20,994 |
| 5. | 95117 | 2.5% | 3.5%(-1.00)#793 | 4.9%(-2.40)#21,949 |
| 6. | 95129 | 2.3% | 3.5%(-1.20)#840 | 4.9%(-2.60)#22,365 |
| 7. | 95120 | 2.3% | 3.5%(-1.20)#842 | 4.9%(-2.60)#22,372 |
| 8. | 95111 | 2.0% | 3.5%(-1.50)#920 | 4.9%(-2.90)#23,096 |
| 9. | 95116 | 2.0% | 3.5%(-1.50)#925 | 4.9%(-2.90)#23,111 |
| 10. | 95122 | 1.9% | 3.5%(-1.60)#965 | 4.9%(-3.00)#23,379 |
| 11. | 95127 | 1.7% | 3.5%(-1.80)#1,040 | 4.9%(-3.20)#23,936 |
| 12. | 95130 | 1.7% | 3.5%(-1.80)#1,071 | 4.9%(-3.20)#24,135 |
| 13. | 95136 | 1.5% | 3.5%(-2.00)#1,142 | 4.9%(-3.40)#24,634 |
| 14. | 95126 | 1.3% | 3.5%(-2.20)#1,250 | 4.9%(-3.60)#25,413 |
| 15. | 95128 | 1.3% | 3.5%(-2.20)#1,255 | 4.9%(-3.60)#25,435 |
| 16. | 95135 | 1.3% | 3.5%(-2.20)#1,267 | 4.9%(-3.60)#25,548 |
| 17. | 95123 | 1.1% | 3.5%(-2.40)#1,326 | 4.9%(-3.80)#26,103 |
| 18. | 95112 | 1.1% | 3.5%(-2.40)#1,333 | 4.9%(-3.80)#26,125 |
| 19. | 95124 | 1.1% | 3.5%(-2.40)#1,337 | 4.9%(-3.80)#26,143 |
| 20. | 95131 | 1.1% | 3.5%(-2.40)#1,355 | 4.9%(-3.80)#26,245 |
| 21. | 95139 | 1.1% | 3.5%(-2.40)#1,373 | 4.9%(-3.80)#26,421 |
| 22. | 95118 | 1.0% | 3.5%(-2.50)#1,401 | 4.9%(-3.90)#26,633 |
| 23. | 95110 | 0.90% | 3.5%(-2.60)#1,457 | 4.9%(-4.00)#27,173 |
| 24. | 95138 | 0.90% | 3.5%(-2.60)#1,458 | 4.9%(-4.00)#27,180 |
| 25. | 95134 | 0.80% | 3.5%(-2.70)#1,487 | 4.9%(-4.10)#27,479 |
| 26. | 95125 | 0.40% | 3.5%(-3.10)#1,577 | 4.9%(-4.50)#28,817 |
| 27. | 95119 | 0.20% | 3.5%(-3.30)#1,602 | 4.9%(-4.70)#29,469 |
1
Common Questions
What are the Top 10 Zip Codes with the Highest Percentage of Households Heated by Bottled Gas / Liquid Propane in San Jose, CA?
Top 10 Zip Codes with the Highest Percentage of Households Heated by Bottled Gas / Liquid Propane in San Jose, CA are:
What zip code has the Highest Percentage of Households Heated by Bottled Gas / Liquid Propane in San Jose, CA?
95121 has the Highest Percentage of Households Heated by Bottled Gas / Liquid Propane in San Jose, CA with 3.2%.
What is the Percentage of Households Heated by Bottled Gas / Liquid Propane in San Jose, CA?
Percentage of Households Heated by Bottled Gas / Liquid Propane in San Jose is 1.5%.
What is the Percentage of Households Heated by Bottled Gas / Liquid Propane in California?
Percentage of Households Heated by Bottled Gas / Liquid Propane in California is 3.5%.
What is the Percentage of Households Heated by Bottled Gas / Liquid Propane in the United States?
Percentage of Households Heated by Bottled Gas / Liquid Propane in the United States is 4.9%.