Zip Codes with the Highest Percentage of Population Employed in Farming, Fishing & Forestry in Sacramento, CA

RELATED REPORTS & OPTIONS

Farming, Fishing & Forestry
Population
Families and Households
Female Fertility
Female Fertility (Unmarried)
Race (Community Size)
Race (Percentage)
Ancestry (Community Size)
AfghanAfricanAlbanianAleutAmericanApacheArabArgentineanArmenianAssyrian / Chaldean / SyriacAustralianAustrianBangladeshiBarbadianBasqueBelgianBelizeanBhutaneseBlackfeetBolivianBrazilianBritishBritish West IndianBulgarianBurmeseCajunCambodianCanadianCape VerdeanCelticCentral AmericanCentral American IndianCherokeeChickasawChileanChippewaChoctawColombianComancheCosta RicanCreeCreekCroatianCrowCubanCzechCzechoslovakianDanishDominicanDutchEastern EuropeanEcuadorianEgyptianEnglishEstonianEthiopianEuropeanFijianFilipinoFinnishFrenchFrench American IndianFrench CanadianGermanGerman RussianGhanaianGreekGuamanian / ChamorroGuatemalanGuyaneseHaitianHonduranHopiHungarianIcelanderIndian (Asian)IndonesianInupiatIranianIraqiIrishIroquoisIsraeliItalianJamaicanJapaneseJordanianKenyanKoreanLaotianLatvianLebaneseLiberianLithuanianLuxembourgerMalaysianMalteseMenomineeMexicanMexican American IndianMongolianMoroccanNative HawaiianNavajoNepaleseNicaraguanNigerianNorthern EuropeanNorwegianOkinawanOsagePaiutePakistaniPalestinianPanamanianPennsylvania GermanPeruvianPimaPolishPortuguesePotawatomiPuebloPuerto RicanPuget Sound SalishRomanianRussianSalvadoranSamoanScandinavianScotch-IrishScottishSeminoleSenegaleseSerbianShoshoneSierra LeoneanSiouxSlavicSlovakSloveneSouth AfricanSouth AmericanSouth American IndianSpaniardSpanishSpanish AmericanSpanish American IndianSri LankanSubsaharan AfricanSwedishSwissSyrianTaiwaneseThaiTlingit-HaidaTohono O'OdhamTonganTrinidadian and TobagonianTurkishUgandanUkrainianVenezuelanVietnameseWelshWest IndianYaquiYugoslavian
Ancestry (Percentage)
AfghanAfricanAlbanianAleutAmericanApacheArabArgentineanArmenianAssyrian / Chaldean / SyriacAustralianAustrianBangladeshiBarbadianBasqueBelgianBelizeanBhutaneseBlackfeetBolivianBrazilianBritishBritish West IndianBulgarianBurmeseCajunCambodianCanadianCape VerdeanCelticCentral AmericanCentral American IndianCherokeeChickasawChileanChippewaChoctawColombianComancheCosta RicanCreeCreekCroatianCrowCubanCzechCzechoslovakianDanishDominicanDutchEastern EuropeanEcuadorianEgyptianEnglishEstonianEthiopianEuropeanFijianFilipinoFinnishFrenchFrench American IndianFrench CanadianGermanGerman RussianGhanaianGreekGuamanian / ChamorroGuatemalanGuyaneseHaitianHonduranHopiHungarianIcelanderIndian (Asian)IndonesianInupiatIranianIraqiIrishIroquoisIsraeliItalianJamaicanJapaneseJordanianKenyanKoreanLaotianLatvianLebaneseLiberianLithuanianLuxembourgerMalaysianMalteseMenomineeMexicanMexican American IndianMongolianMoroccanNative HawaiianNavajoNepaleseNicaraguanNigerianNorthern EuropeanNorwegianOkinawanOsagePaiutePakistaniPalestinianPanamanianPennsylvania GermanPeruvianPimaPolishPortuguesePotawatomiPuebloPuerto RicanPuget Sound SalishRomanianRussianSalvadoranSamoanScandinavianScotch-IrishScottishSeminoleSenegaleseSerbianShoshoneSierra LeoneanSiouxSlavicSlovakSloveneSouth AfricanSouth AmericanSouth American IndianSpaniardSpanishSpanish AmericanSpanish American IndianSri LankanSubsaharan AfricanSwedishSwissSyrianTaiwaneseThaiTlingit-HaidaTohono O'OdhamTonganTrinidadian and TobagonianTurkishUgandanUkrainianVenezuelanVietnameseWelshWest IndianYaquiYugoslavian
Immigrant Origin (Total)
AfghanistanAfricaArgentinaArmeniaAsiaAustraliaAustriaAzoresBangladeshBelarusBelizeBoliviaBosnia and HerzegovinaBrazilBulgariaBurma / MyanmarCabo VerdeCambodiaCameroonCanadaCaribbeanCentral AmericaChileChinaColombiaCosta RicaCroatiaCubaCzechoslovakiaDenmarkDominican RepublicEastern AfricaEastern AsiaEastern EuropeEcuadorEgyptEl SalvadorEnglandEritreaEthiopiaEuropeFijiFranceGermanyGhanaGreeceGuatemalaGuyanaHaitiHondurasHong KongHungaryIndiaIndonesiaIranIraqIrelandIsraelItalyJamaicaJapanJordanKazakhstanKenyaKoreaKuwaitLaosLatin AmericaLatviaLebanonLiberiaLithuaniaMalaysiaMexicoMicronesiaMiddle AfricaMoldovaMoroccoNepalNetherlandsNicaraguaNigeriaNorth MacedoniaNorthern AfricaNorthern EuropeNorwayOceaniaPakistanPanamaPeruPhilippinesPolandPortugalRomaniaRussiaSaudi ArabiaScotlandSenegalSerbiaSierra LeoneSingaporeSomaliaSouth AfricaSouth AmericaSouth Central AsiaSouth Eastern AsiaSouthern EuropeSpainSri LankaSudanSwedenSwitzerlandSyriaTaiwanThailandTrinidad and TobagoTurkeyUgandaUkraineUzbekistanVenezuelaVietnamWestern AfricaWestern AsiaWestern EuropeZimbabwe
Immigrant Origin (Percentage)
AfghanistanAfricaArgentinaArmeniaAsiaAustraliaAustriaAzoresBangladeshBelarusBelizeBoliviaBosnia and HerzegovinaBrazilBulgariaBurma / MyanmarCabo VerdeCambodiaCameroonCanadaCaribbeanCentral AmericaChileChinaColombiaCosta RicaCroatiaCubaCzechoslovakiaDenmarkDominican RepublicEastern AfricaEastern AsiaEastern EuropeEcuadorEgyptEl SalvadorEnglandEritreaEthiopiaEuropeFijiFranceGermanyGhanaGreeceGuatemalaGuyanaHaitiHondurasHong KongHungaryIndiaIndonesiaIranIraqIrelandIsraelItalyJamaicaJapanJordanKazakhstanKenyaKoreaKuwaitLaosLatin AmericaLatviaLebanonLiberiaLithuaniaMalaysiaMexicoMicronesiaMiddle AfricaMoldovaMoroccoNepalNetherlandsNicaraguaNigeriaNorth MacedoniaNorthern AfricaNorthern EuropeNorwayOceaniaPakistanPanamaPeruPhilippinesPolandPortugalRomaniaRussiaSaudi ArabiaScotlandSenegalSerbiaSierra LeoneSingaporeSomaliaSouth AfricaSouth AmericaSouth Central AsiaSouth Eastern AsiaSouthern EuropeSpainSri LankaSudanSwedenSwitzerlandSyriaTaiwanThailandTrinidad and TobagoTurkeyUgandaUkraineUzbekistanVenezuelaVietnamWestern AfricaWestern AsiaWestern EuropeZimbabwe
Income
Income (Families)
Income (Households)
Poverty
Poverty (Families)
Unemployment
Employment Occupations
Employment Industries
Employer Class
Commute Time
Commute Means
School Enrollment
Education by Degree Field
Occupancy
Finances
Physical Characteristics
Sacramento
States
California Cities
AlhambraAnaheimApple ValleyAuburnBakersfieldBerkeleyBuena ParkCamarilloCanoga ParkCanyon CountryCastro ValleyChicoChula VistaCitrus HeightsClovisComptonConcordCoronaCosta MesaCovinaDaly CityDavisDesert Hot SpringsDuarteEl CajonEl MonteElk GroveEscondidoEurekaFairfieldFontanaFremontFresnoFullertonGarden GroveGardenaGlendaleGlendoraGrass ValleyHaywardHemetHesperiaHuntington BeachIndioInglewoodIrvineLa MesaLa PuenteLake ElsinoreLakewoodLancasterLivermoreLodiLong BeachLos AngelesLos GatosMaderaMantecaMenifeeMercedMission ViejoModestoMoreno ValleyMountain ViewMurrietaNapaNorth HollywoodNovatoOaklandOceansideOntarioOrangeOrovilleOxnardPalm SpringsPalmdalePalo AltoPerrisPetalumaPomonaPortervilleRancho CordovaRancho CucamongaReddingRedlandsRedwood CityRialtoRichmondRiversideRocklinRosevilleSacramentoSalinasSan BernardinoSan DiegoSan FranciscoSan GabrielSan JacintoSan JoseSan LeandroSan Luis ObispoSan MarcosSan MateoSan PedroSan RafaelSanta AnaSanta BarbaraSanta ClaraSanta CruzSanta MariaSanta MonicaSanta RosaSimi ValleySpring ValleyStocktonSunnyvaleTemeculaThousand OaksTorranceTracyTurlockTustinUplandVacavilleVallejoVan NuysVenturaVictorvilleVisaliaVistaWalnut CreekWest CovinaWest SacramentoWhittierWoodlandYorba LindaYuba City
Compare Zip Codes
Comparison Subject

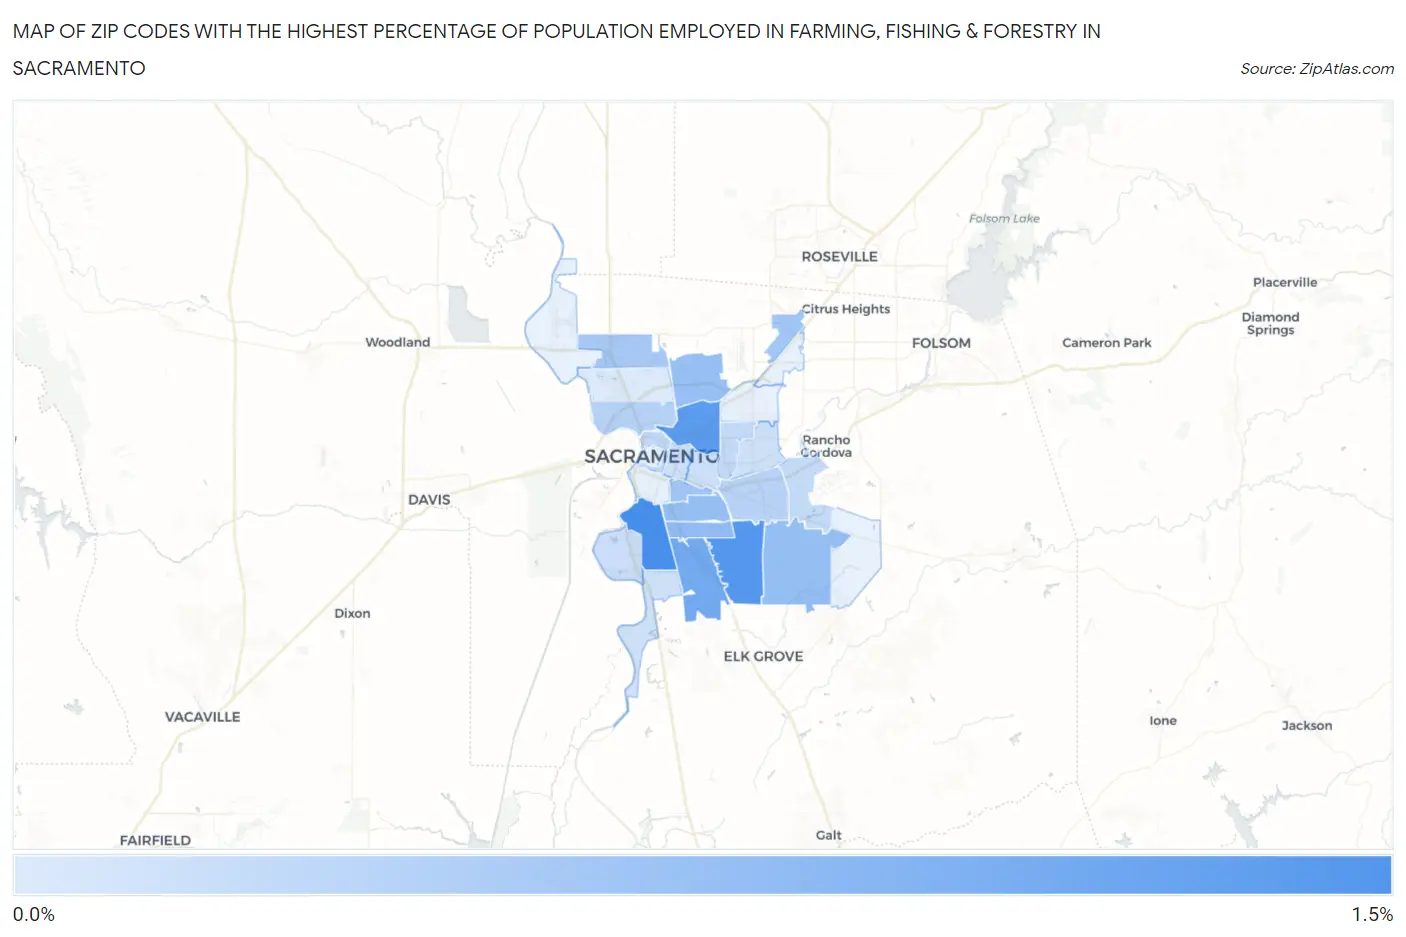
Map of Zip Codes with the Highest Percentage of Population Employed in Farming, Fishing & Forestry in Sacramento

0.0%
1.5%
Zip Codes with the Highest Percentage of Population Employed in Farming, Fishing & Forestry in Sacramento Map

Zip Codes with the Highest Percentage of Population Employed in Farming, Fishing & Forestry in Sacramento, CA

Zip Code % Employed vs State vs National
1.958221.2%1.4%(-0.197)#4650.61%(+0.607)#8,883
2.958281.1%1.4%(-0.304)#4800.61%(+0.501)#9,293
3.958151.1%1.4%(-0.352)#4910.61%(+0.452)#9,489
4.958230.85%1.4%(-0.557)#5460.61%(+0.248)#10,504
5.958240.63%1.4%(-0.779)#6170.61%(+0.026)#11,807
6.958200.59%1.4%(-0.819)#6350.61%(-0.015)#12,112
7.958290.59%1.4%(-0.820)#6370.61%(-0.015)#12,119
8.958380.56%1.4%(-0.847)#6540.61%(-0.043)#12,356
9.958170.49%1.4%(-0.920)#6910.61%(-0.115)#12,932
10.958420.47%1.4%(-0.943)#7050.61%(-0.138)#13,126
11.958350.46%1.4%(-0.953)#7120.61%(-0.149)#13,228
12.958330.32%1.4%(-1.09)#8300.61%(-0.286)#14,593
13.958260.30%1.4%(-1.11)#8420.61%(-0.303)#14,800
14.958110.25%1.4%(-1.16)#8850.61%(-0.351)#15,355
15.958250.24%1.4%(-1.17)#9150.61%(-0.370)#15,610
16.958270.22%1.4%(-1.19)#9280.61%(-0.382)#15,780
17.958310.16%1.4%(-1.25)#9950.61%(-0.445)#16,733
18.958190.14%1.4%(-1.27)#1,0290.61%(-0.469)#17,161
19.958320.13%1.4%(-1.28)#1,0350.61%(-0.475)#17,270
20.958640.13%1.4%(-1.28)#1,0390.61%(-0.479)#17,316
21.958160.12%1.4%(-1.29)#1,0480.61%(-0.486)#17,439
22.958340.017%1.4%(-1.39)#1,1910.61%(-0.588)#19,093

Common Questions

What are the Top 10 Zip Codes with the Highest Percentage of Population Employed in Farming, Fishing & Forestry in Sacramento, CA?
Top 10 Zip Codes with the Highest Percentage of Population Employed in Farming, Fishing & Forestry in Sacramento, CA are:
#1
1.2%
#2
1.1%
#3
1.1%
#4
0.85%
#5
0.63%
#6
0.59%
#7
0.59%
#8
0.56%
#9
0.49%
#10
0.47%
What zip code has the Highest Percentage of Population Employed in Farming, Fishing & Forestry in Sacramento, CA?
95822 has the Highest Percentage of Population Employed in Farming, Fishing & Forestry in Sacramento, CA with 1.2%.
What is the Percentage of Population Employed in Farming, Fishing & Forestry in Sacramento, CA?
Percentage of Population Employed in Farming, Fishing & Forestry in Sacramento is 0.47%.
What is the Percentage of Population Employed in Farming, Fishing & Forestry in California?
Percentage of Population Employed in Farming, Fishing & Forestry in California is 1.4%.
What is the Percentage of Population Employed in Farming, Fishing & Forestry in the United States?
Percentage of Population Employed in Farming, Fishing & Forestry in the United States is 0.61%.