Zip Codes with the Highest Percentage of Population Employed in Health Care & Social Assistance in Rancho Cordova, CA
RELATED REPORTS & OPTIONS
Health Care & Social Assistance
Rancho Cordova
Compare Zip Codes
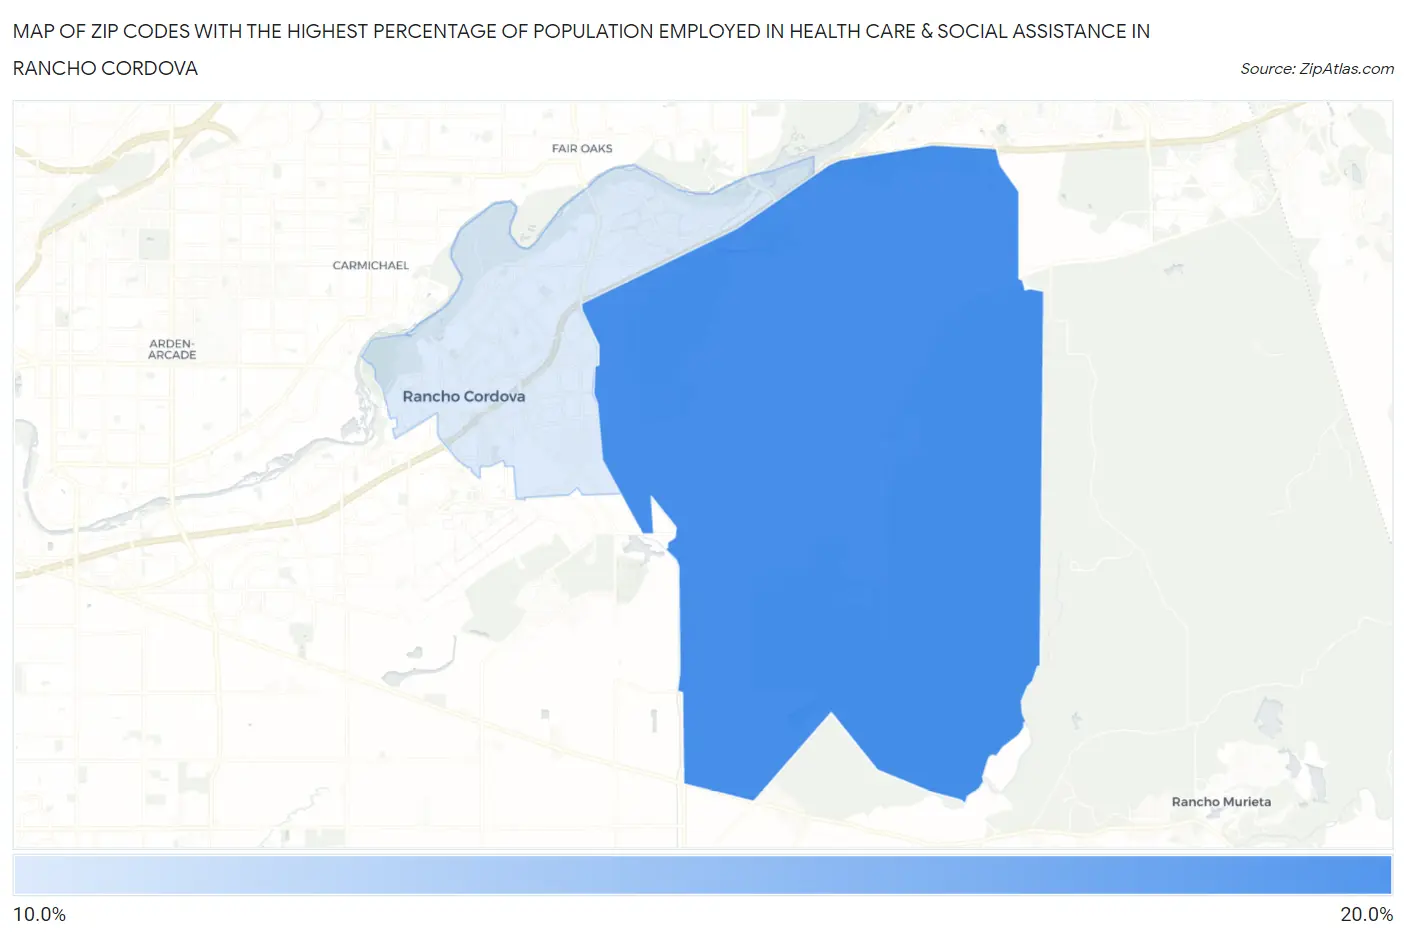
Map of Zip Codes with the Highest Percentage of Population Employed in Health Care & Social Assistance in Rancho Cordova
0.0%
20.0%
Zip Codes with the Highest Percentage of Population Employed in Health Care & Social Assistance in Rancho Cordova, CA
| Zip Code | % Employed | vs State | vs National | |
| 1. | 95742 | 18.3% | 12.7%(+5.51)#140 | 13.9%(+4.31)#5,879 |
| 2. | 95670 | 12.8% | 12.7%(+0.049)#696 | 13.9%(-1.15)#17,112 |
1
Common Questions
What are the Top Zip Codes with the Highest Percentage of Population Employed in Health Care & Social Assistance in Rancho Cordova, CA?
Top Zip Codes with the Highest Percentage of Population Employed in Health Care & Social Assistance in Rancho Cordova, CA are:
What zip code has the Highest Percentage of Population Employed in Health Care & Social Assistance in Rancho Cordova, CA?
95742 has the Highest Percentage of Population Employed in Health Care & Social Assistance in Rancho Cordova, CA with 18.3%.
What is the Percentage of Population Employed in Health Care & Social Assistance in Rancho Cordova, CA?
Percentage of Population Employed in Health Care & Social Assistance in Rancho Cordova is 14.0%.
What is the Percentage of Population Employed in Health Care & Social Assistance in California?
Percentage of Population Employed in Health Care & Social Assistance in California is 12.7%.
What is the Percentage of Population Employed in Health Care & Social Assistance in the United States?
Percentage of Population Employed in Health Care & Social Assistance in the United States is 13.9%.