Zip Codes with the Highest Percentage of Population Employed in Agriculture, Fishing & Hunting in Rancho Cordova, CA
RELATED REPORTS & OPTIONS
Agriculture, Fishing & Hunting
Rancho Cordova
Compare Zip Codes
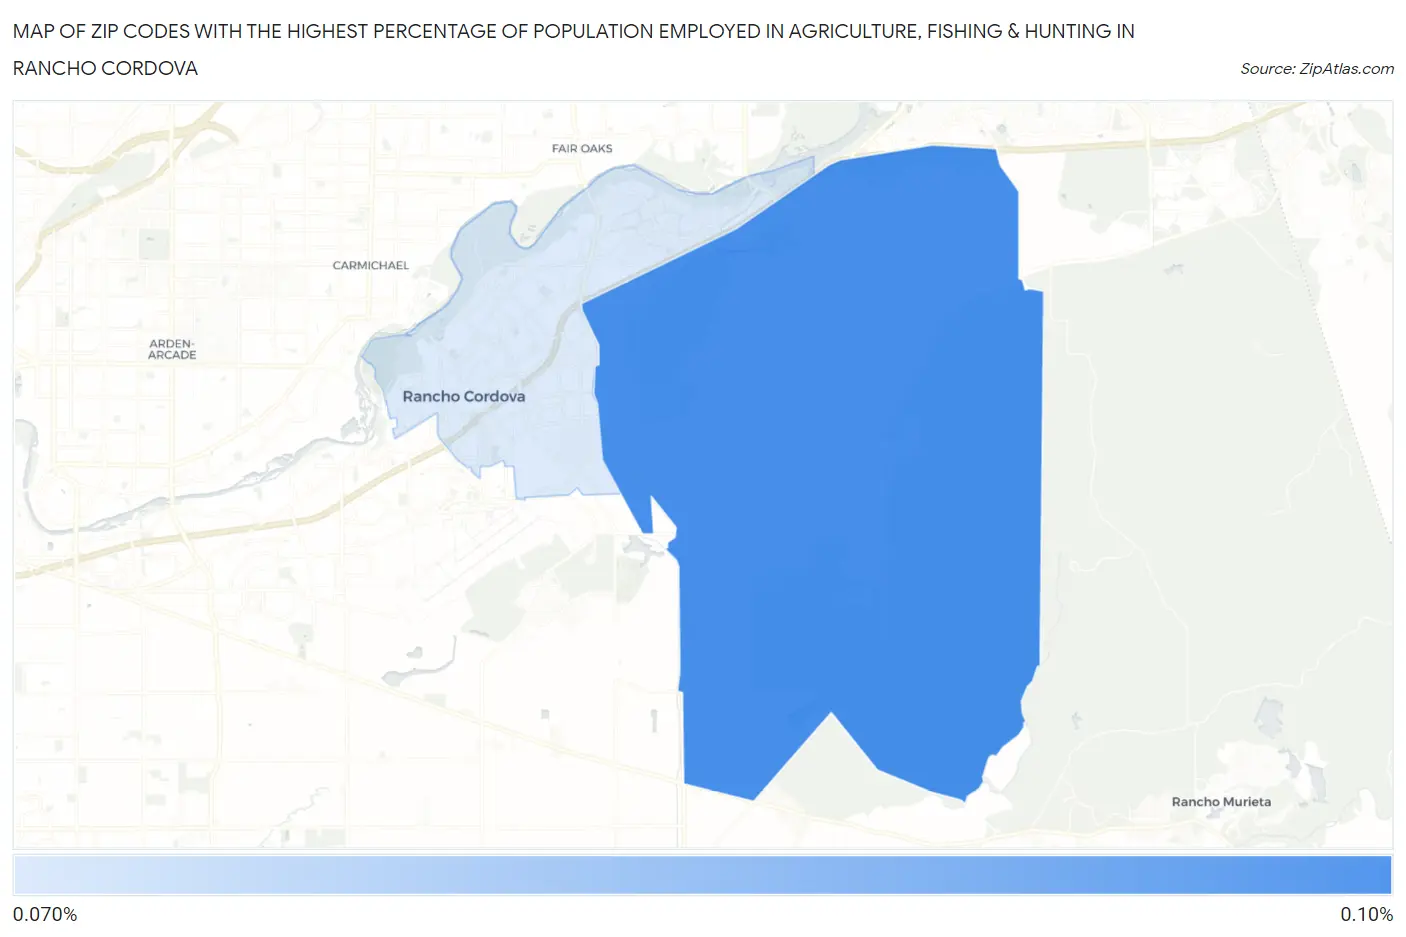
Map of Zip Codes with the Highest Percentage of Population Employed in Agriculture, Fishing & Hunting in Rancho Cordova
0.0%
0.10%
Zip Codes with the Highest Percentage of Population Employed in Agriculture, Fishing & Hunting in Rancho Cordova, CA
| Zip Code | % Employed | vs State | vs National | |
| 1. | 95742 | 0.082% | 2.0%(-1.90)#1,358 | 1.2%(-1.12)#23,932 |
| 2. | 95670 | 0.075% | 2.0%(-1.91)#1,368 | 1.2%(-1.12)#24,038 |
1
Common Questions
What are the Top Zip Codes with the Highest Percentage of Population Employed in Agriculture, Fishing & Hunting in Rancho Cordova, CA?
Top Zip Codes with the Highest Percentage of Population Employed in Agriculture, Fishing & Hunting in Rancho Cordova, CA are:
What zip code has the Highest Percentage of Population Employed in Agriculture, Fishing & Hunting in Rancho Cordova, CA?
95742 has the Highest Percentage of Population Employed in Agriculture, Fishing & Hunting in Rancho Cordova, CA with 0.082%.
What is the Percentage of Population Employed in Agriculture, Fishing & Hunting in Rancho Cordova, CA?
Percentage of Population Employed in Agriculture, Fishing & Hunting in Rancho Cordova is 0.19%.
What is the Percentage of Population Employed in Agriculture, Fishing & Hunting in California?
Percentage of Population Employed in Agriculture, Fishing & Hunting in California is 2.0%.
What is the Percentage of Population Employed in Agriculture, Fishing & Hunting in the United States?
Percentage of Population Employed in Agriculture, Fishing & Hunting in the United States is 1.2%.