Zip Codes with the Highest Percentage of Population Employed in Professional & Scientific Services in Pleasanton, CA
RELATED REPORTS & OPTIONS
Professional & Scientific Services
Pleasanton
Compare Zip Codes
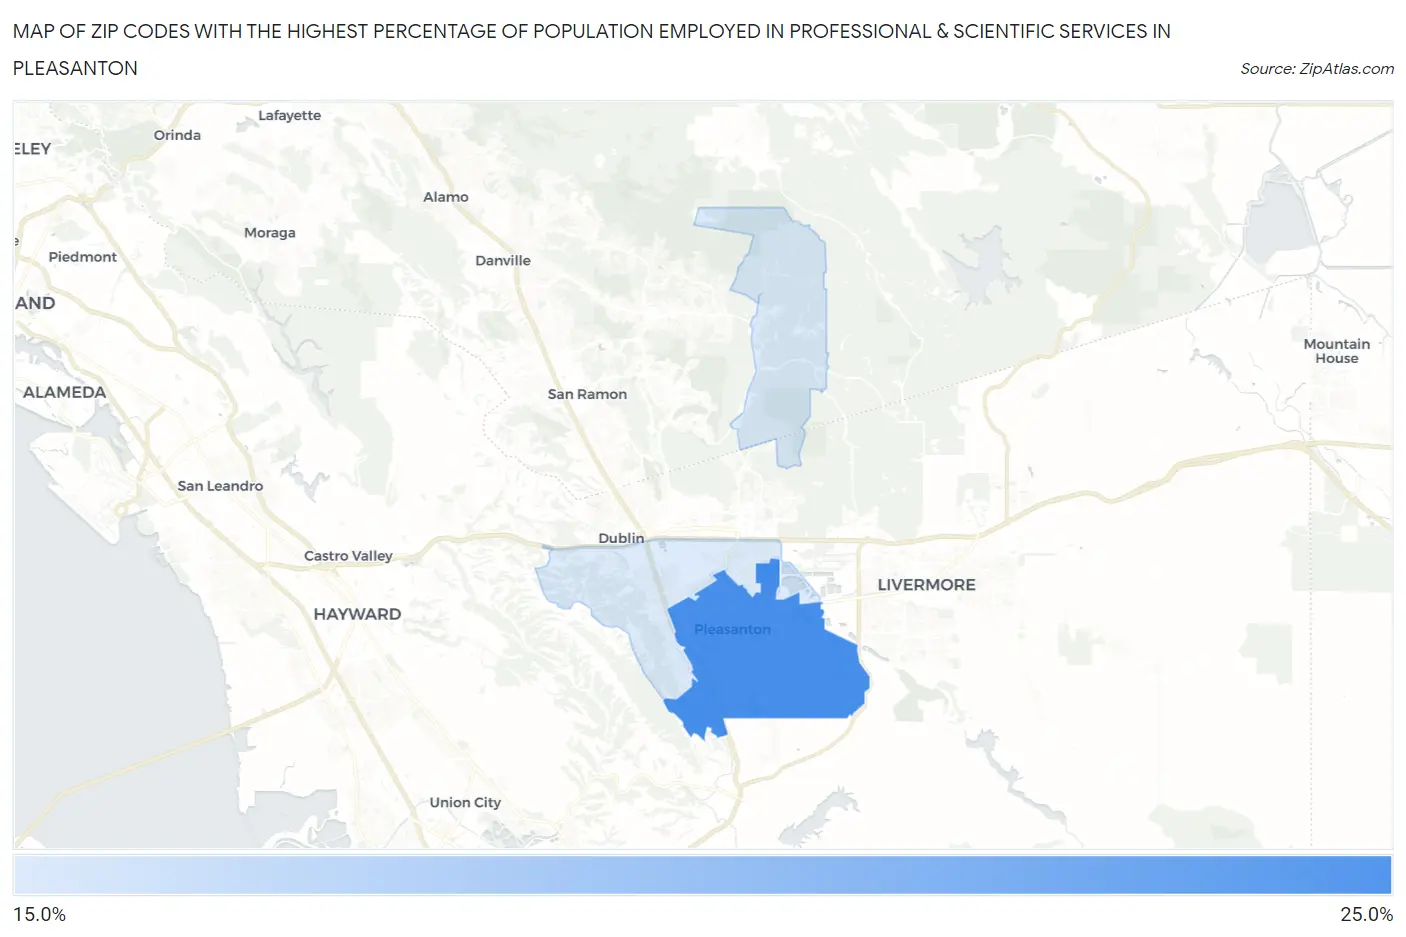
Map of Zip Codes with the Highest Percentage of Population Employed in Professional & Scientific Services in Pleasanton
21.2%
22.5%
Zip Codes with the Highest Percentage of Population Employed in Professional & Scientific Services in Pleasanton, CA
| Zip Code | % Employed | vs State | vs National | |
| 1. | 94566 | 22.5% | 9.4%(+13.1)#106 | 7.8%(+14.7)#623 |
| 2. | 94588 | 21.2% | 9.4%(+11.8)#126 | 7.8%(+13.4)#750 |
1
Common Questions
What are the Top Zip Codes with the Highest Percentage of Population Employed in Professional & Scientific Services in Pleasanton, CA?
Top Zip Codes with the Highest Percentage of Population Employed in Professional & Scientific Services in Pleasanton, CA are:
What zip code has the Highest Percentage of Population Employed in Professional & Scientific Services in Pleasanton, CA?
94566 has the Highest Percentage of Population Employed in Professional & Scientific Services in Pleasanton, CA with 22.5%.
What is the Percentage of Population Employed in Professional & Scientific Services in Pleasanton, CA?
Percentage of Population Employed in Professional & Scientific Services in Pleasanton is 22.1%.
What is the Percentage of Population Employed in Professional & Scientific Services in California?
Percentage of Population Employed in Professional & Scientific Services in California is 9.4%.
What is the Percentage of Population Employed in Professional & Scientific Services in the United States?
Percentage of Population Employed in Professional & Scientific Services in the United States is 7.8%.