Zip Codes with the Highest Percentage of Population Employed in Professional & Scientific Services in Oroville, CA
RELATED REPORTS & OPTIONS
Professional & Scientific Services
Oroville
Compare Zip Codes
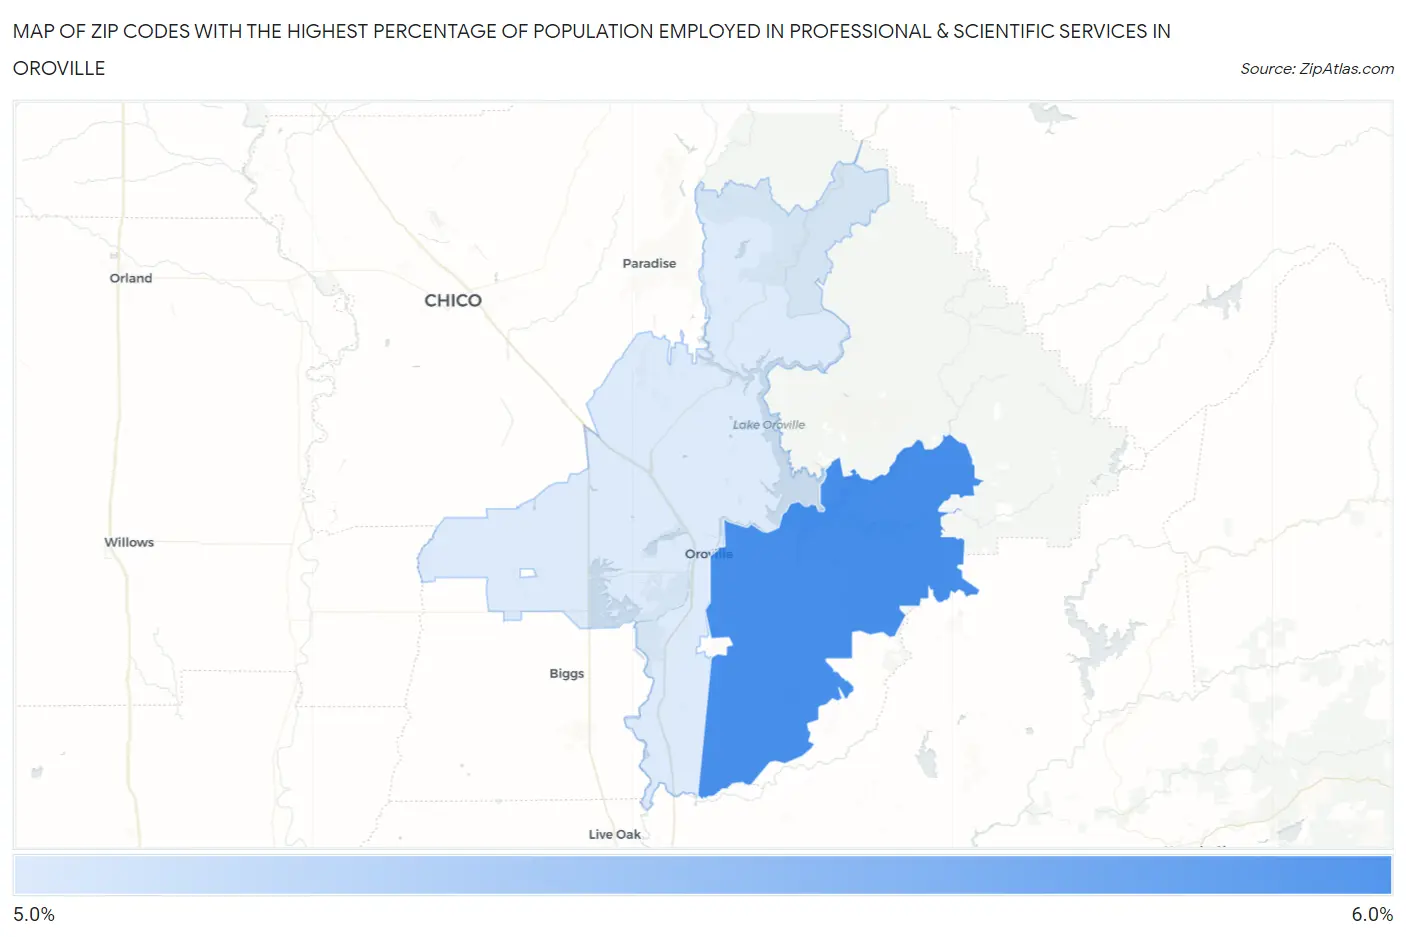
Map of Zip Codes with the Highest Percentage of Population Employed in Professional & Scientific Services in Oroville
5.1%
5.7%
Zip Codes with the Highest Percentage of Population Employed in Professional & Scientific Services in Oroville, CA
| Zip Code | % Employed | vs State | vs National | |
| 1. | 95966 | 5.7% | 9.4%(-3.78)#930 | 7.8%(-2.19)#10,681 |
| 2. | 95965 | 5.1% | 9.4%(-4.35)#1,015 | 7.8%(-2.77)#12,122 |
1
Common Questions
What are the Top Zip Codes with the Highest Percentage of Population Employed in Professional & Scientific Services in Oroville, CA?
Top Zip Codes with the Highest Percentage of Population Employed in Professional & Scientific Services in Oroville, CA are:
What zip code has the Highest Percentage of Population Employed in Professional & Scientific Services in Oroville, CA?
95966 has the Highest Percentage of Population Employed in Professional & Scientific Services in Oroville, CA with 5.7%.
What is the Percentage of Population Employed in Professional & Scientific Services in Oroville, CA?
Percentage of Population Employed in Professional & Scientific Services in Oroville is 6.8%.
What is the Percentage of Population Employed in Professional & Scientific Services in California?
Percentage of Population Employed in Professional & Scientific Services in California is 9.4%.
What is the Percentage of Population Employed in Professional & Scientific Services in the United States?
Percentage of Population Employed in Professional & Scientific Services in the United States is 7.8%.