Zip Codes with the Highest Percentage of Chinese Population in Murrieta, CA
RELATED REPORTS & OPTIONS
Select to Compare
Select to Compare
Compare Zip Codes
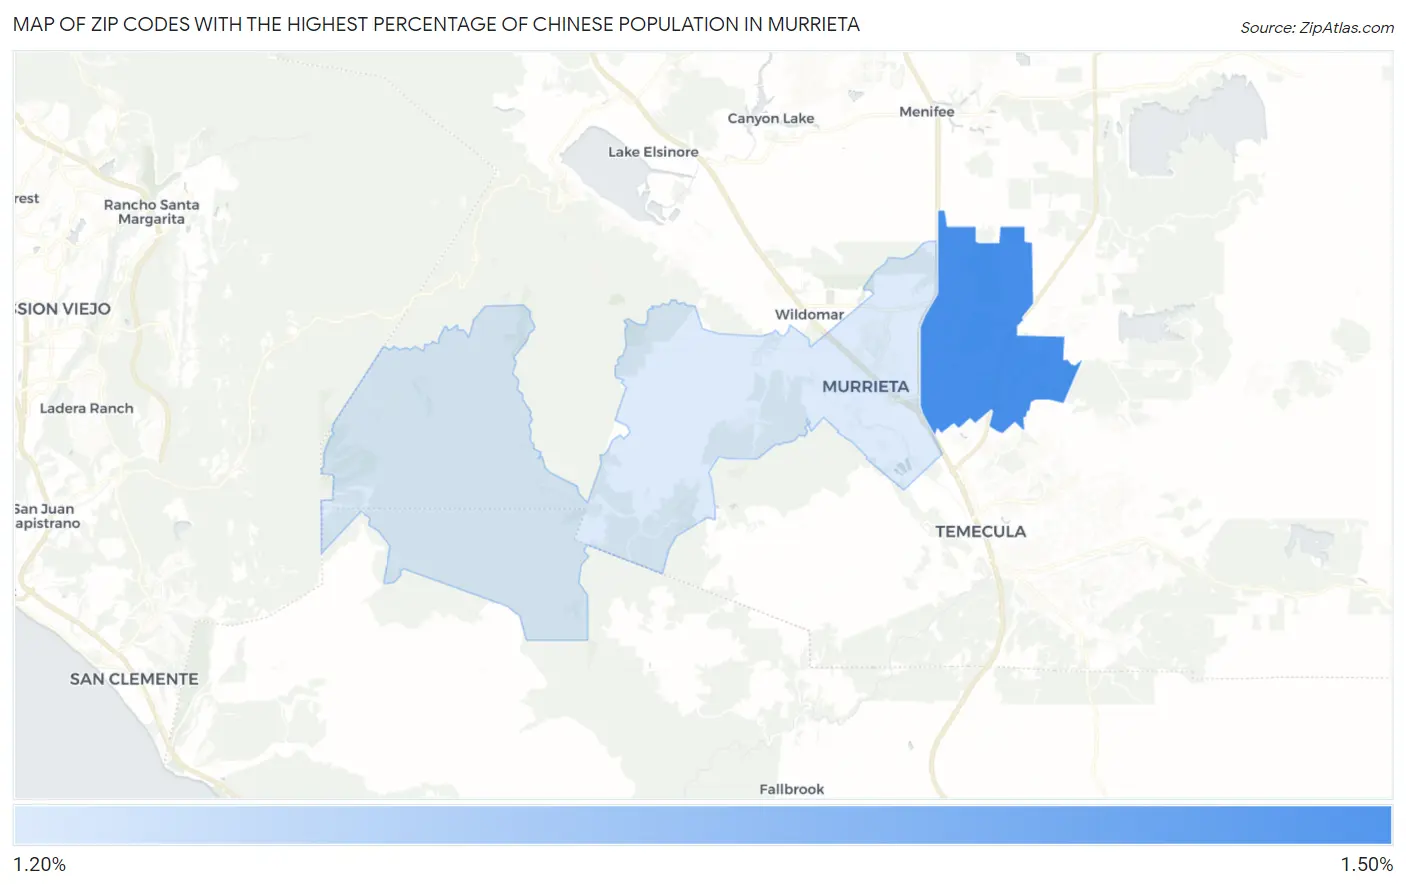
Map of Zip Codes with the Highest Percentage of Chinese Population in Murrieta
17,976,931,348,623,157,081,452,742,373,170,435,679,807,056,752,584,499,659,891,747,680,315,726,078,002,853,876,058,955,863,276,687,817,154,045,895,351,438,246,423,432,132,688,946,418,276,846,754,670,353,751,698,604,991,057,655,128,207,624,549,009,038,932,894,407,586,850,845,513,394,230,458,323,690,322,294,816,580,855,933,212,334,827,479,782,620,414,472,316,873,817,718,091,929,988,125,040,402,618,412,485,836,800.00%
-17,976,931,348,623,157,081,452,742,373,170,435,679,807,056,752,584,499,659,891,747,680,315,726,078,002,853,876,058,955,863,276,687,817,154,045,895,351,438,246,423,432,132,688,946,418,276,846,754,670,353,751,698,604,991,057,655,128,207,624,549,009,038,932,894,407,586,850,845,513,394,230,458,323,690,322,294,816,580,855,933,212,334,827,479,782,620,414,472,316,873,817,718,091,929,988,125,040,402,618,412,485,836,800.00000%
Zip Codes with the Highest Percentage of Chinese Population in Murrieta, CA
| Zip Code | Chinese | vs State | vs National |
1
Common Questions
What are the Top Zip Codes with the Highest Percentage of Chinese Population in Murrieta, CA?
Top Zip Codes with the Highest Percentage of Chinese Population in Murrieta, CA are:
What zip code has the Highest Percentage of Chinese Population in Murrieta, CA?
92563 has the Highest Percentage of Chinese Population in Murrieta, CA with 0.00%.