Zip Codes with the Highest Percentage of Population Employed in Arts, Entertainment & Recreation in Los Gatos, CA
RELATED REPORTS & OPTIONS
Arts, Entertainment & Recreation
Los Gatos
Compare Zip Codes
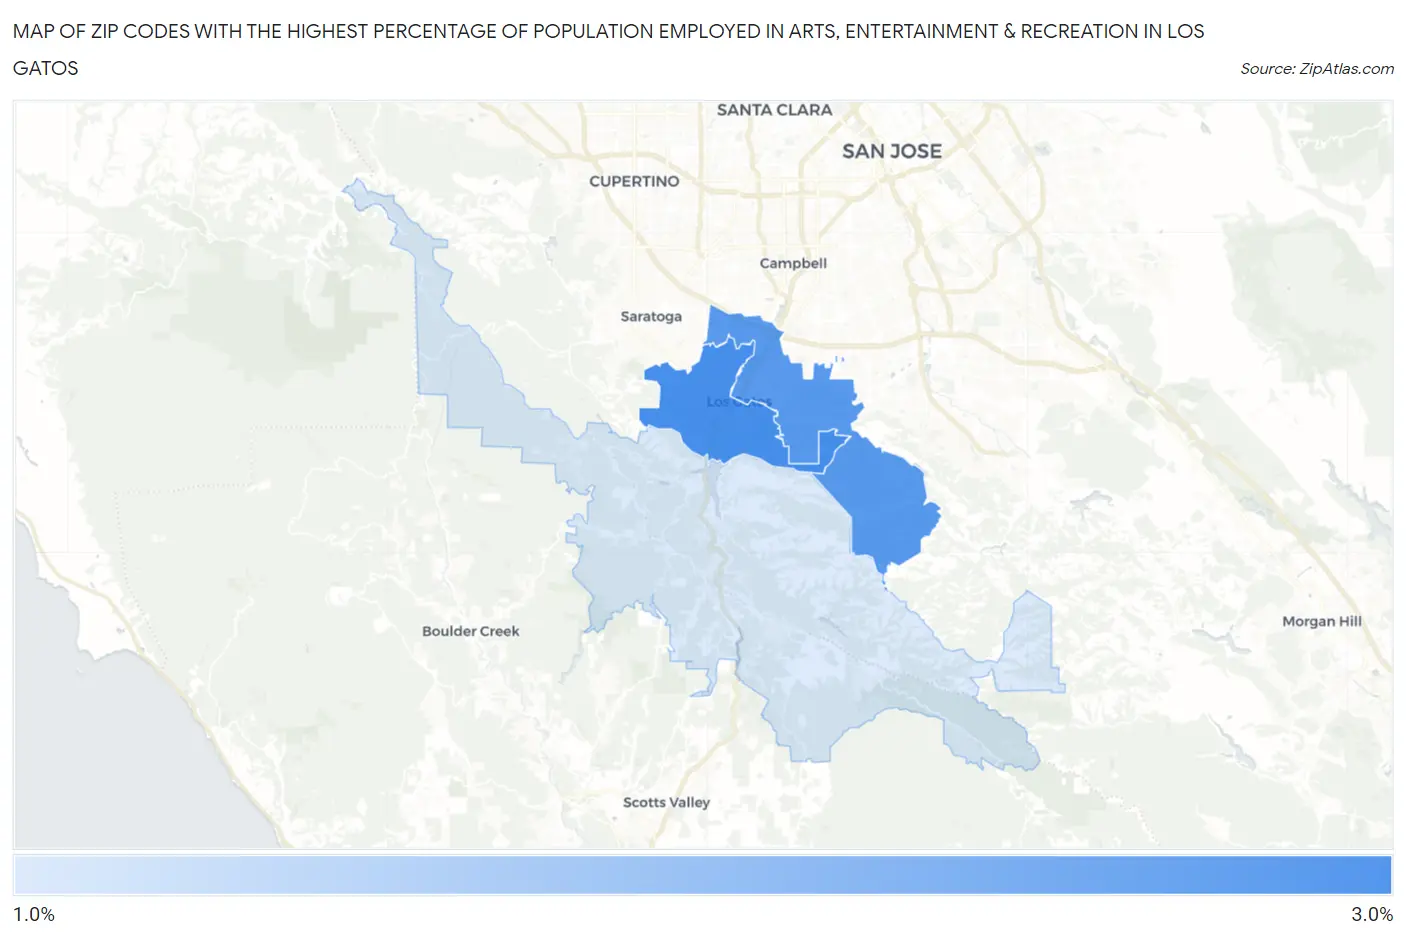
Map of Zip Codes with the Highest Percentage of Population Employed in Arts, Entertainment & Recreation in Los Gatos
0.0%
3.0%
Zip Codes with the Highest Percentage of Population Employed in Arts, Entertainment & Recreation in Los Gatos, CA
| Zip Code | % Employed | vs State | vs National | |
| 1. | 95030 | 2.9% | 2.6%(+0.337)#550 | 2.1%(+0.808)#5,677 |
| 2. | 95032 | 2.8% | 2.6%(+0.200)#589 | 2.1%(+0.671)#6,170 |
| 3. | 95033 | 1.6% | 2.6%(-0.977)#1,089 | 2.1%(-0.505)#12,631 |
1
Common Questions
What are the Top Zip Codes with the Highest Percentage of Population Employed in Arts, Entertainment & Recreation in Los Gatos, CA?
Top Zip Codes with the Highest Percentage of Population Employed in Arts, Entertainment & Recreation in Los Gatos, CA are:
What zip code has the Highest Percentage of Population Employed in Arts, Entertainment & Recreation in Los Gatos, CA?
95030 has the Highest Percentage of Population Employed in Arts, Entertainment & Recreation in Los Gatos, CA with 2.9%.
What is the Percentage of Population Employed in Arts, Entertainment & Recreation in Los Gatos, CA?
Percentage of Population Employed in Arts, Entertainment & Recreation in Los Gatos is 2.9%.
What is the Percentage of Population Employed in Arts, Entertainment & Recreation in California?
Percentage of Population Employed in Arts, Entertainment & Recreation in California is 2.6%.
What is the Percentage of Population Employed in Arts, Entertainment & Recreation in the United States?
Percentage of Population Employed in Arts, Entertainment & Recreation in the United States is 2.1%.