Zip Codes with the Highest Percentage of Population Employed in Agriculture, Fishing & Hunting in Los Gatos, CA
RELATED REPORTS & OPTIONS
Agriculture, Fishing & Hunting
Los Gatos
Compare Zip Codes
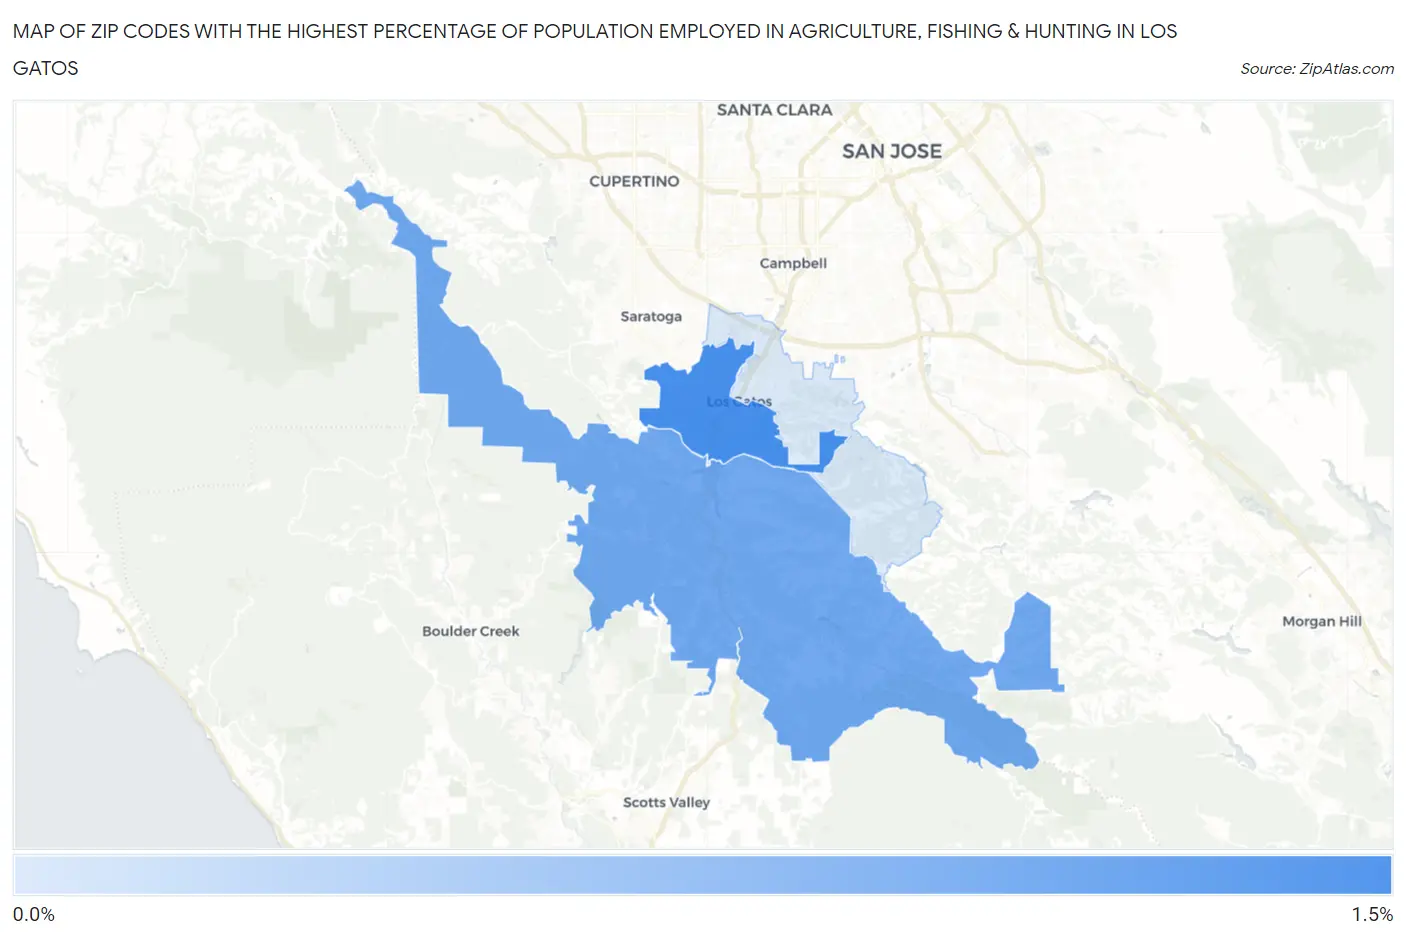
Map of Zip Codes with the Highest Percentage of Population Employed in Agriculture, Fishing & Hunting in Los Gatos
0.0%
1.5%
Zip Codes with the Highest Percentage of Population Employed in Agriculture, Fishing & Hunting in Los Gatos, CA
| Zip Code | % Employed | vs State | vs National | |
| 1. | 95030 | 1.0% | 2.0%(-0.962)#721 | 1.2%(-0.176)#16,116 |
| 2. | 95033 | 0.72% | 2.0%(-1.26)#829 | 1.2%(-0.477)#17,719 |
| 3. | 95032 | 0.015% | 2.0%(-1.97)#1,406 | 1.2%(-1.18)#24,599 |
1
Common Questions
What are the Top Zip Codes with the Highest Percentage of Population Employed in Agriculture, Fishing & Hunting in Los Gatos, CA?
Top Zip Codes with the Highest Percentage of Population Employed in Agriculture, Fishing & Hunting in Los Gatos, CA are:
What zip code has the Highest Percentage of Population Employed in Agriculture, Fishing & Hunting in Los Gatos, CA?
95030 has the Highest Percentage of Population Employed in Agriculture, Fishing & Hunting in Los Gatos, CA with 1.0%.
What is the Percentage of Population Employed in Agriculture, Fishing & Hunting in Los Gatos, CA?
Percentage of Population Employed in Agriculture, Fishing & Hunting in Los Gatos is 0.084%.
What is the Percentage of Population Employed in Agriculture, Fishing & Hunting in California?
Percentage of Population Employed in Agriculture, Fishing & Hunting in California is 2.0%.
What is the Percentage of Population Employed in Agriculture, Fishing & Hunting in the United States?
Percentage of Population Employed in Agriculture, Fishing & Hunting in the United States is 1.2%.