Zip Codes with the Highest Percentage of Population Employed in Transportation & Warehousing in Lompoc, CA
RELATED REPORTS & OPTIONS
Transportation & Warehousing
Lompoc
Compare Zip Codes
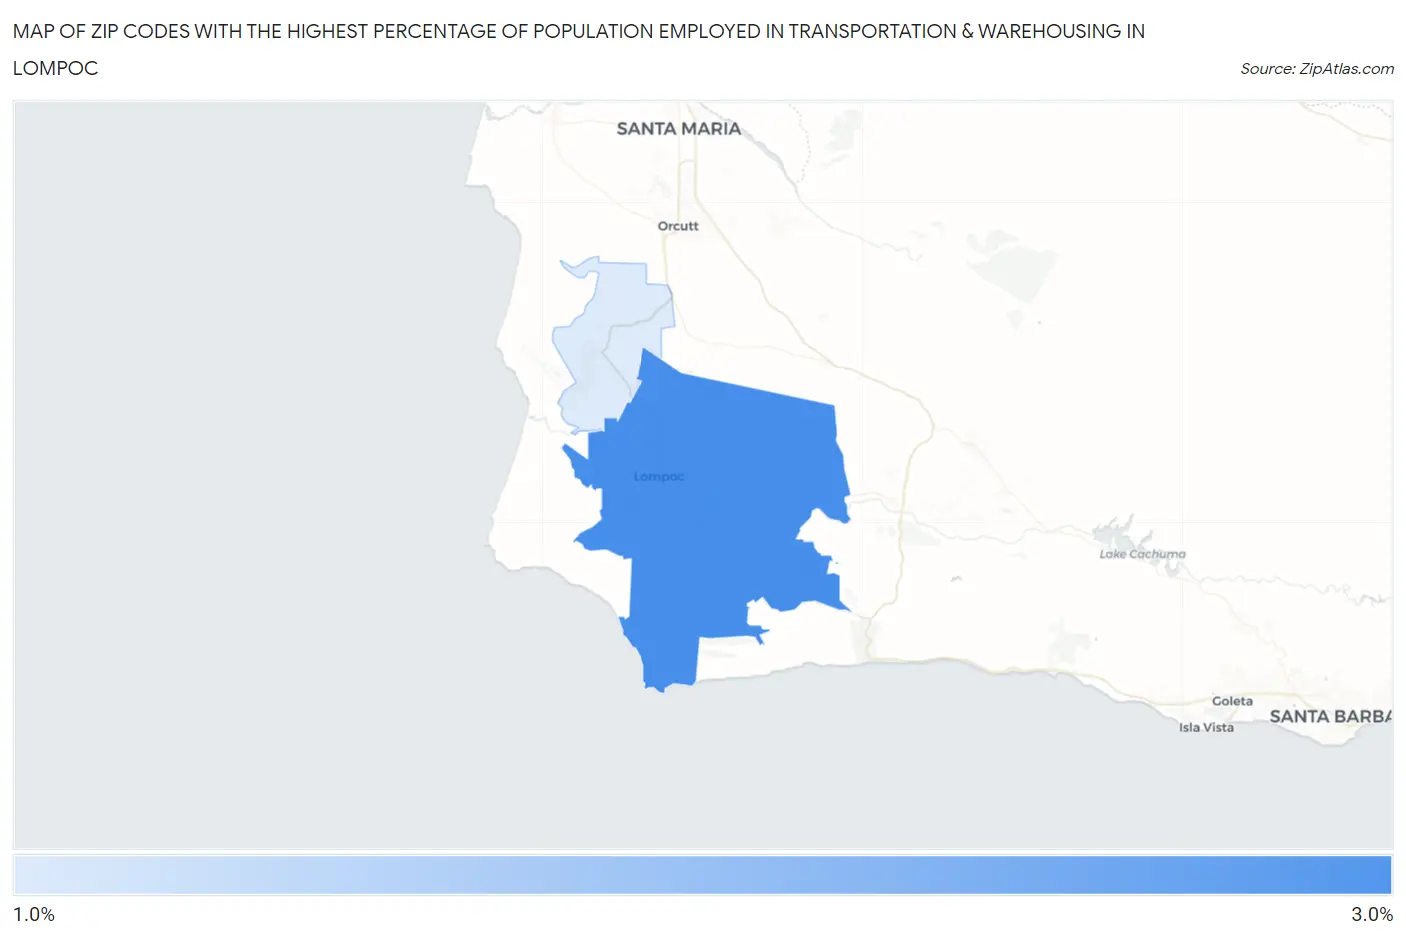
Map of Zip Codes with the Highest Percentage of Population Employed in Transportation & Warehousing in Lompoc
1.8%
2.9%
Zip Codes with the Highest Percentage of Population Employed in Transportation & Warehousing in Lompoc, CA
| Zip Code | % Employed | vs State | vs National | |
| 1. | 93436 | 2.9% | 5.1%(-2.28)#1,024 | 4.9%(-2.09)#20,884 |
| 2. | 93437 | 1.8% | 5.1%(-3.32)#1,293 | 4.9%(-3.14)#24,893 |
1
Common Questions
What are the Top Zip Codes with the Highest Percentage of Population Employed in Transportation & Warehousing in Lompoc, CA?
Top Zip Codes with the Highest Percentage of Population Employed in Transportation & Warehousing in Lompoc, CA are:
What zip code has the Highest Percentage of Population Employed in Transportation & Warehousing in Lompoc, CA?
93436 has the Highest Percentage of Population Employed in Transportation & Warehousing in Lompoc, CA with 2.9%.
What is the Percentage of Population Employed in Transportation & Warehousing in Lompoc, CA?
Percentage of Population Employed in Transportation & Warehousing in Lompoc is 3.4%.
What is the Percentage of Population Employed in Transportation & Warehousing in California?
Percentage of Population Employed in Transportation & Warehousing in California is 5.1%.
What is the Percentage of Population Employed in Transportation & Warehousing in the United States?
Percentage of Population Employed in Transportation & Warehousing in the United States is 4.9%.