Zip Codes with the Highest Percentage of Population Employed in Farming, Fishing & Forestry in La Puente, CA
RELATED REPORTS & OPTIONS
Farming, Fishing & Forestry
La Puente
Compare Zip Codes
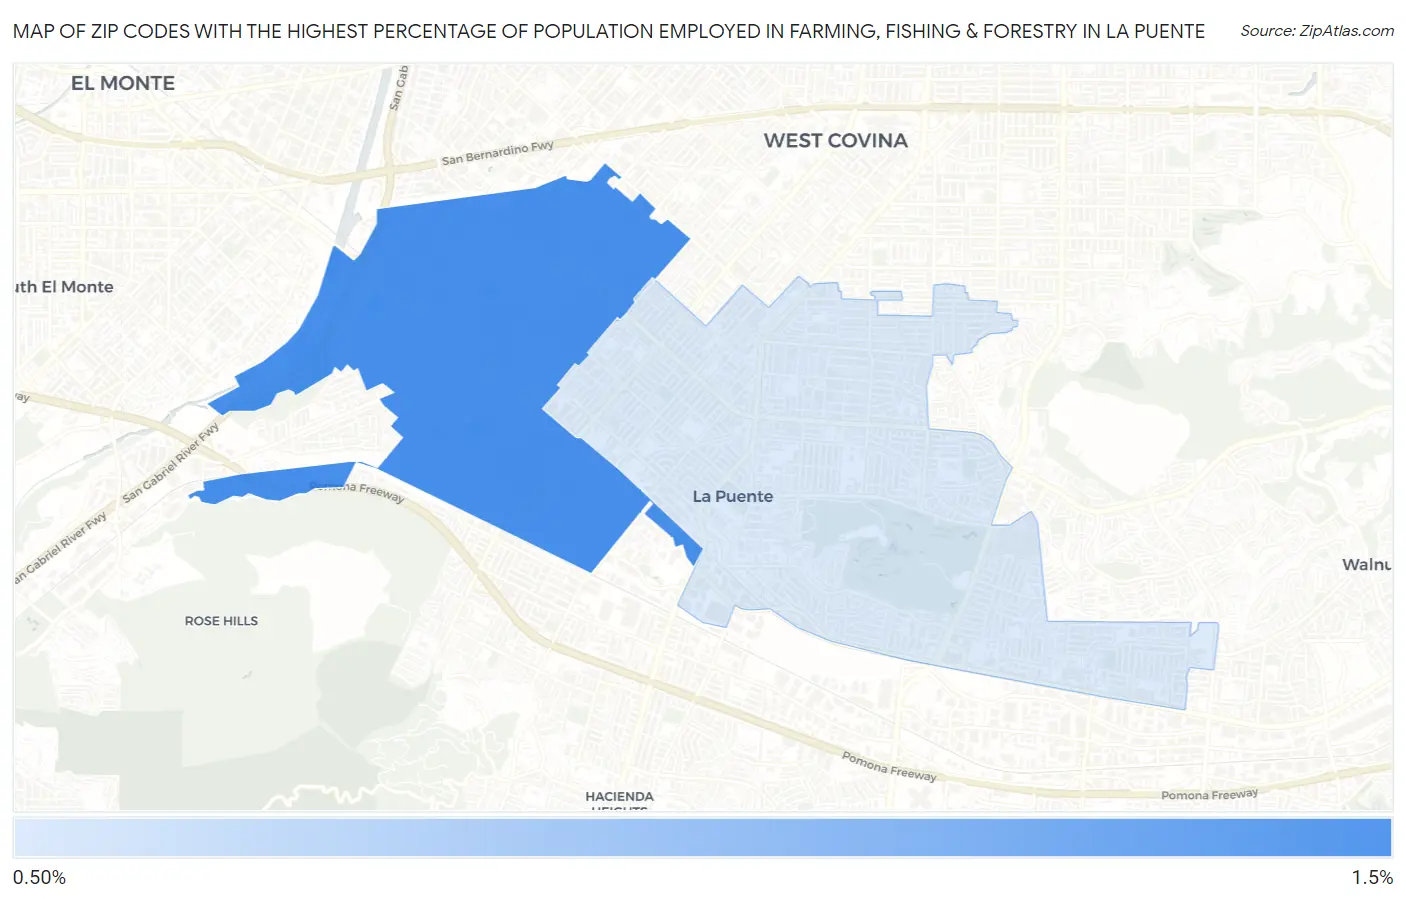
Map of Zip Codes with the Highest Percentage of Population Employed in Farming, Fishing & Forestry in La Puente
0.0%
1.5%
Zip Codes with the Highest Percentage of Population Employed in Farming, Fishing & Forestry in La Puente, CA
| Zip Code | % Employed | vs State | vs National | |
| 1. | 91746 | 1.0% | 1.4%(-0.362)#494 | 0.61%(+0.442)#9,527 |
| 2. | 91744 | 0.63% | 1.4%(-0.784)#622 | 0.61%(+0.021)#11,843 |
1
Common Questions
What are the Top Zip Codes with the Highest Percentage of Population Employed in Farming, Fishing & Forestry in La Puente, CA?
Top Zip Codes with the Highest Percentage of Population Employed in Farming, Fishing & Forestry in La Puente, CA are:
What zip code has the Highest Percentage of Population Employed in Farming, Fishing & Forestry in La Puente, CA?
91746 has the Highest Percentage of Population Employed in Farming, Fishing & Forestry in La Puente, CA with 1.0%.
What is the Percentage of Population Employed in Farming, Fishing & Forestry in La Puente, CA?
Percentage of Population Employed in Farming, Fishing & Forestry in La Puente is 1.0%.
What is the Percentage of Population Employed in Farming, Fishing & Forestry in California?
Percentage of Population Employed in Farming, Fishing & Forestry in California is 1.4%.
What is the Percentage of Population Employed in Farming, Fishing & Forestry in the United States?
Percentage of Population Employed in Farming, Fishing & Forestry in the United States is 0.61%.