Zip Codes with the Highest Percentage of Population Employed in Arts, Entertainment & Recreation in Inglewood, CA
RELATED REPORTS & OPTIONS
Arts, Entertainment & Recreation
Inglewood
Compare Zip Codes
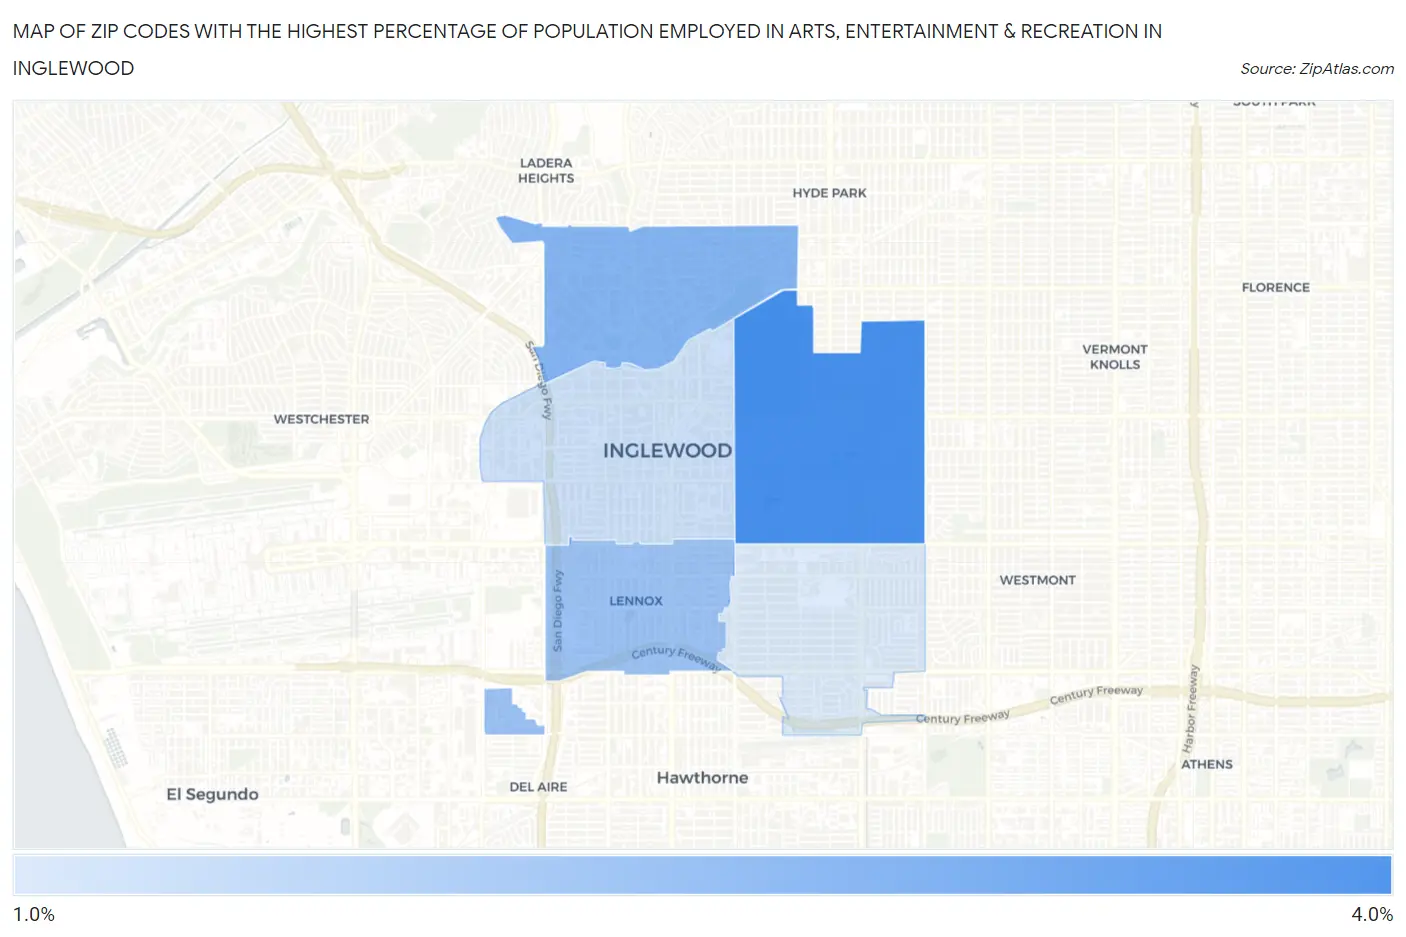
Map of Zip Codes with the Highest Percentage of Population Employed in Arts, Entertainment & Recreation in Inglewood
0.0%
4.0%
Zip Codes with the Highest Percentage of Population Employed in Arts, Entertainment & Recreation in Inglewood, CA
| Zip Code | % Employed | vs State | vs National | |
| 1. | 90305 | 3.7% | 2.6%(+1.16)#375 | 2.1%(+1.63)#3,758 |
| 2. | 90302 | 2.8% | 2.6%(+0.237)#579 | 2.1%(+0.708)#6,033 |
| 3. | 90304 | 2.5% | 2.6%(-0.061)#690 | 2.1%(+0.411)#7,205 |
| 4. | 90301 | 1.7% | 2.6%(-0.807)#1,022 | 2.1%(-0.336)#11,397 |
| 5. | 90303 | 1.5% | 2.6%(-1.06)#1,130 | 2.1%(-0.587)#13,256 |
1
Common Questions
What are the Top 3 Zip Codes with the Highest Percentage of Population Employed in Arts, Entertainment & Recreation in Inglewood, CA?
Top 3 Zip Codes with the Highest Percentage of Population Employed in Arts, Entertainment & Recreation in Inglewood, CA are:
What zip code has the Highest Percentage of Population Employed in Arts, Entertainment & Recreation in Inglewood, CA?
90305 has the Highest Percentage of Population Employed in Arts, Entertainment & Recreation in Inglewood, CA with 3.7%.
What is the Percentage of Population Employed in Arts, Entertainment & Recreation in Inglewood, CA?
Percentage of Population Employed in Arts, Entertainment & Recreation in Inglewood is 2.2%.
What is the Percentage of Population Employed in Arts, Entertainment & Recreation in California?
Percentage of Population Employed in Arts, Entertainment & Recreation in California is 2.6%.
What is the Percentage of Population Employed in Arts, Entertainment & Recreation in the United States?
Percentage of Population Employed in Arts, Entertainment & Recreation in the United States is 2.1%.