Zip Codes with the Highest Percentage of Population Employed in Professional & Scientific Services in Danville, CA
RELATED REPORTS & OPTIONS
Professional & Scientific Services
Danville
Compare Zip Codes
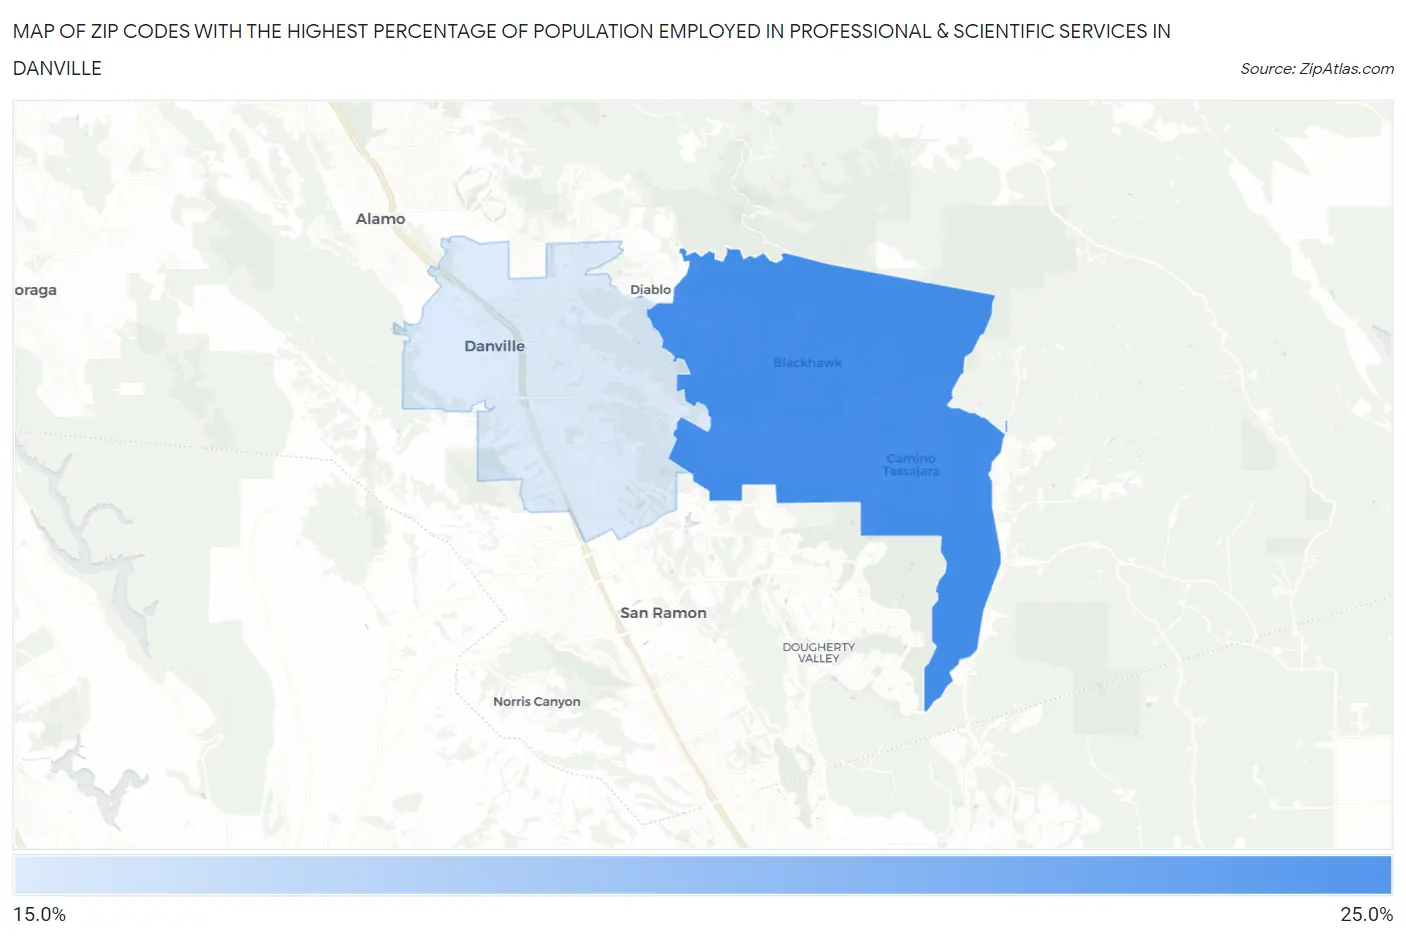
Map of Zip Codes with the Highest Percentage of Population Employed in Professional & Scientific Services in Danville
18.4%
21.5%
Zip Codes with the Highest Percentage of Population Employed in Professional & Scientific Services in Danville, CA
| Zip Code | % Employed | vs State | vs National | |
| 1. | 94506 | 21.5% | 9.4%(+12.1)#117 | 7.8%(+13.7)#718 |
| 2. | 94526 | 18.4% | 9.4%(+9.01)#186 | 7.8%(+10.6)#1,084 |
1
Common Questions
What are the Top Zip Codes with the Highest Percentage of Population Employed in Professional & Scientific Services in Danville, CA?
Top Zip Codes with the Highest Percentage of Population Employed in Professional & Scientific Services in Danville, CA are:
What zip code has the Highest Percentage of Population Employed in Professional & Scientific Services in Danville, CA?
94506 has the Highest Percentage of Population Employed in Professional & Scientific Services in Danville, CA with 21.5%.
What is the Percentage of Population Employed in Professional & Scientific Services in Danville, CA?
Percentage of Population Employed in Professional & Scientific Services in Danville is 19.2%.
What is the Percentage of Population Employed in Professional & Scientific Services in California?
Percentage of Population Employed in Professional & Scientific Services in California is 9.4%.
What is the Percentage of Population Employed in Professional & Scientific Services in the United States?
Percentage of Population Employed in Professional & Scientific Services in the United States is 7.8%.