Zip Codes with the Highest Percentage of Population Employed in Arts, Entertainment & Recreation in Culver City, CA
RELATED REPORTS & OPTIONS
Arts, Entertainment & Recreation
Culver City
Compare Zip Codes
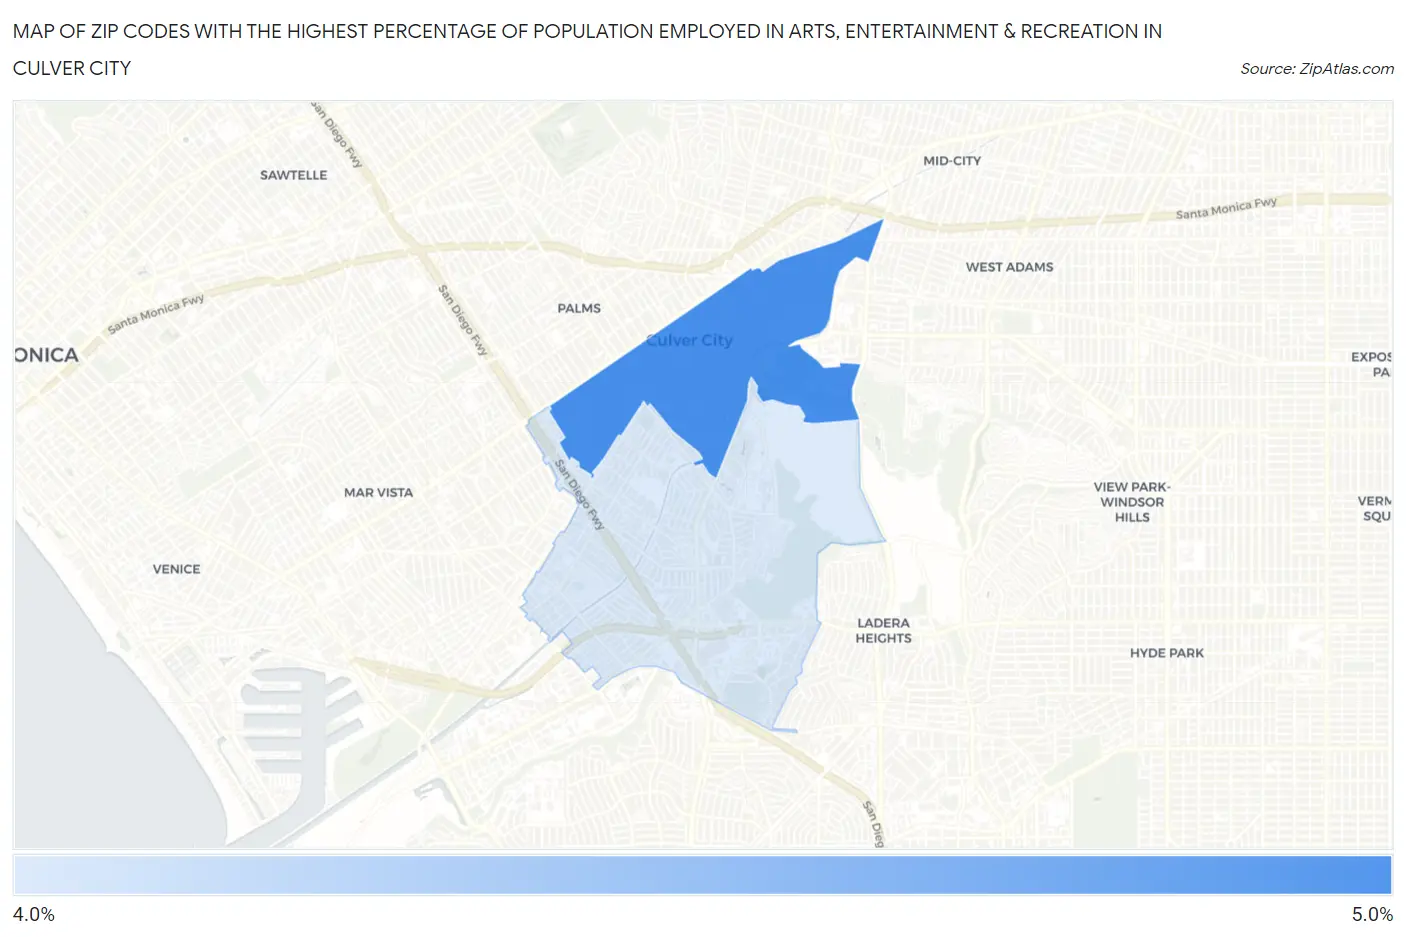
Map of Zip Codes with the Highest Percentage of Population Employed in Arts, Entertainment & Recreation in Culver City
0.0%
5.0%
Zip Codes with the Highest Percentage of Population Employed in Arts, Entertainment & Recreation in Culver City, CA
| Zip Code | % Employed | vs State | vs National | |
| 1. | 90232 | 4.9% | 2.6%(+2.39)#222 | 2.1%(+2.87)#2,324 |
| 2. | 90230 | 4.4% | 2.6%(+1.89)#273 | 2.1%(+2.36)#2,801 |
1
Common Questions
What are the Top Zip Codes with the Highest Percentage of Population Employed in Arts, Entertainment & Recreation in Culver City, CA?
Top Zip Codes with the Highest Percentage of Population Employed in Arts, Entertainment & Recreation in Culver City, CA are:
What zip code has the Highest Percentage of Population Employed in Arts, Entertainment & Recreation in Culver City, CA?
90232 has the Highest Percentage of Population Employed in Arts, Entertainment & Recreation in Culver City, CA with 4.9%.
What is the Percentage of Population Employed in Arts, Entertainment & Recreation in Culver City, CA?
Percentage of Population Employed in Arts, Entertainment & Recreation in Culver City is 4.2%.
What is the Percentage of Population Employed in Arts, Entertainment & Recreation in California?
Percentage of Population Employed in Arts, Entertainment & Recreation in California is 2.6%.
What is the Percentage of Population Employed in Arts, Entertainment & Recreation in the United States?
Percentage of Population Employed in Arts, Entertainment & Recreation in the United States is 2.1%.