Zip Codes with the Highest Percentage of Population Employed in Transportation & Warehousing in Compton, CA
RELATED REPORTS & OPTIONS
Transportation & Warehousing
Compton
Compare Zip Codes
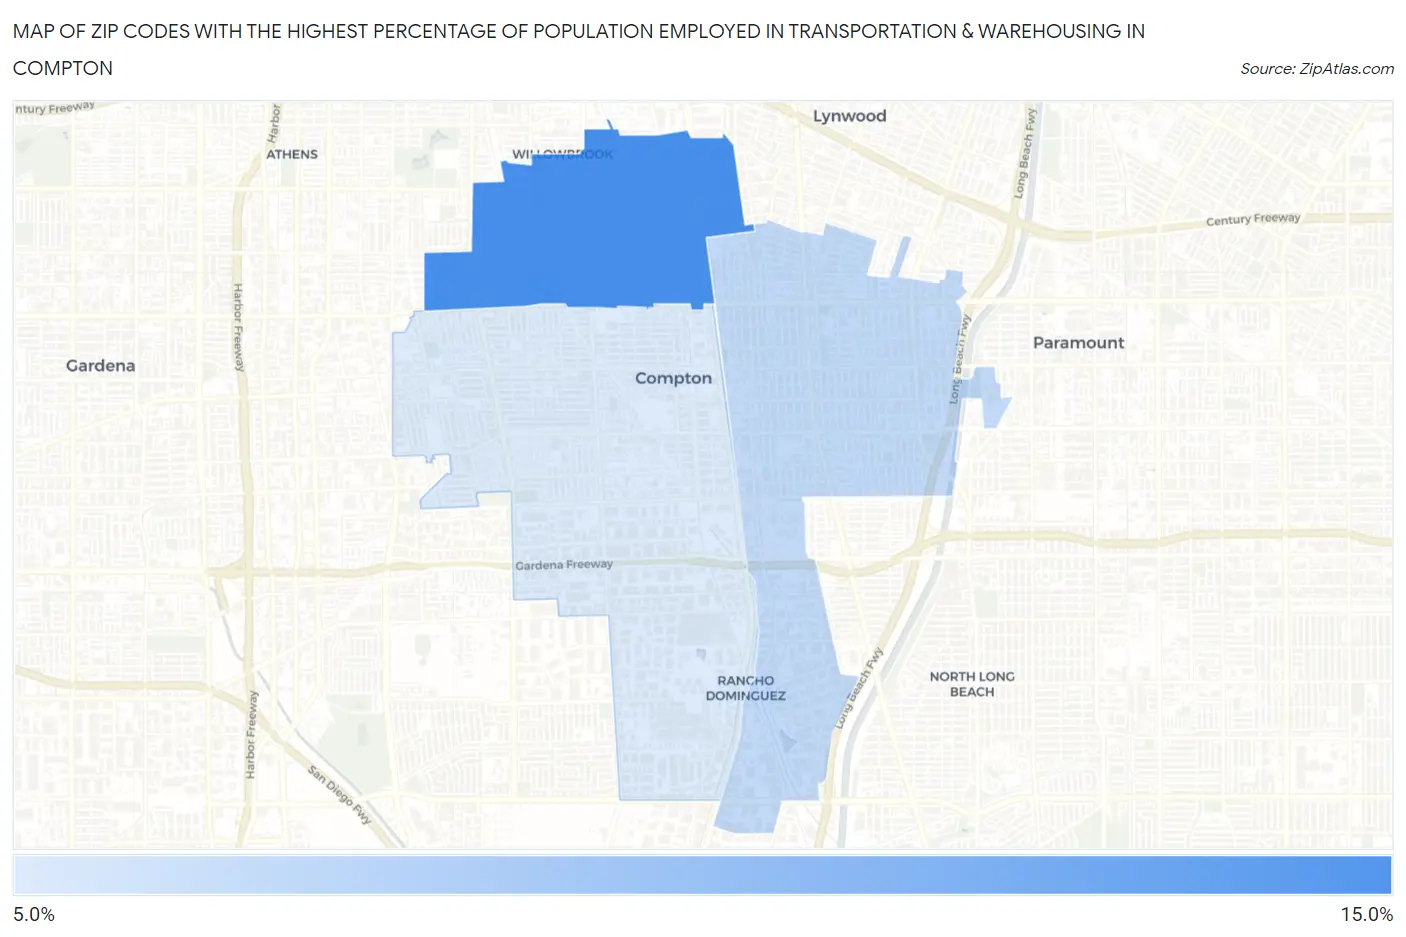
Map of Zip Codes with the Highest Percentage of Population Employed in Transportation & Warehousing in Compton
11.1%
12.8%
Zip Codes with the Highest Percentage of Population Employed in Transportation & Warehousing in Compton, CA
| Zip Code | % Employed | vs State | vs National | |
| 1. | 90222 | 12.8% | 5.1%(+7.66)#61 | 4.9%(+7.85)#1,594 |
| 2. | 90221 | 11.4% | 5.1%(+6.27)#83 | 4.9%(+6.46)#2,120 |
| 3. | 90220 | 11.1% | 5.1%(+5.96)#93 | 4.9%(+6.14)#2,284 |
1
Common Questions
What are the Top Zip Codes with the Highest Percentage of Population Employed in Transportation & Warehousing in Compton, CA?
Top Zip Codes with the Highest Percentage of Population Employed in Transportation & Warehousing in Compton, CA are:
What zip code has the Highest Percentage of Population Employed in Transportation & Warehousing in Compton, CA?
90222 has the Highest Percentage of Population Employed in Transportation & Warehousing in Compton, CA with 12.8%.
What is the Percentage of Population Employed in Transportation & Warehousing in Compton, CA?
Percentage of Population Employed in Transportation & Warehousing in Compton is 12.2%.
What is the Percentage of Population Employed in Transportation & Warehousing in California?
Percentage of Population Employed in Transportation & Warehousing in California is 5.1%.
What is the Percentage of Population Employed in Transportation & Warehousing in the United States?
Percentage of Population Employed in Transportation & Warehousing in the United States is 4.9%.