Zip Codes with the Highest Percentage of Population Employed in Professional & Scientific Services in Compton, CA
RELATED REPORTS & OPTIONS
Professional & Scientific Services
Compton
Compare Zip Codes
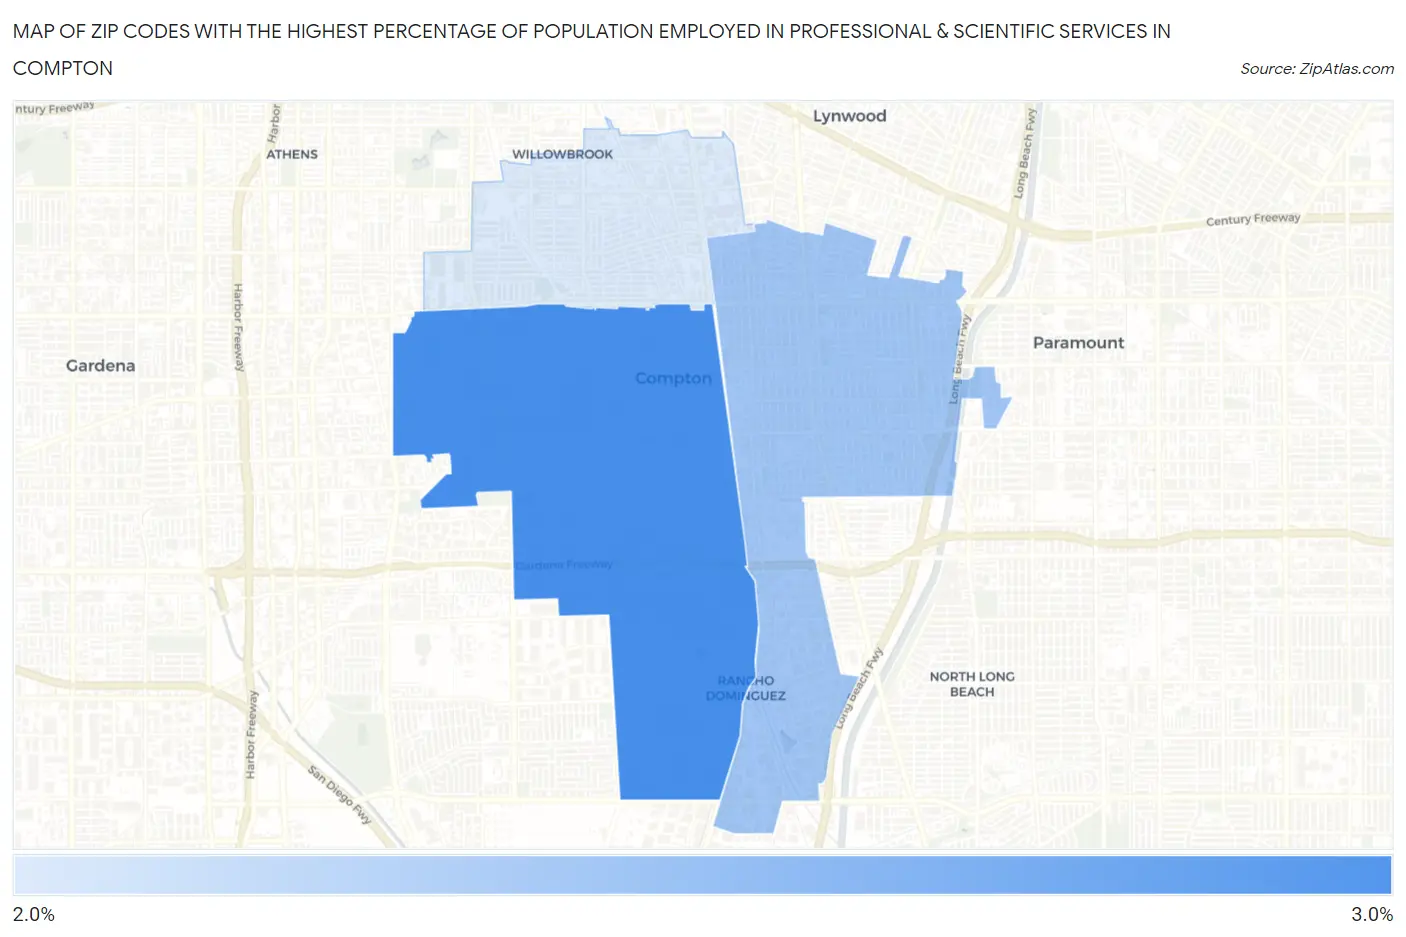
Map of Zip Codes with the Highest Percentage of Population Employed in Professional & Scientific Services in Compton
2.7%
2.8%
Zip Codes with the Highest Percentage of Population Employed in Professional & Scientific Services in Compton, CA
| Zip Code | % Employed | vs State | vs National | |
| 1. | 90220 | 2.8% | 9.4%(-6.62)#1,283 | 7.8%(-5.03)#19,084 |
| 2. | 90221 | 2.7% | 9.4%(-6.69)#1,294 | 7.8%(-5.11)#19,368 |
| 3. | 90222 | 2.7% | 9.4%(-6.74)#1,299 | 7.8%(-5.16)#19,543 |
1
Common Questions
What are the Top Zip Codes with the Highest Percentage of Population Employed in Professional & Scientific Services in Compton, CA?
Top Zip Codes with the Highest Percentage of Population Employed in Professional & Scientific Services in Compton, CA are:
What zip code has the Highest Percentage of Population Employed in Professional & Scientific Services in Compton, CA?
90220 has the Highest Percentage of Population Employed in Professional & Scientific Services in Compton, CA with 2.8%.
What is the Percentage of Population Employed in Professional & Scientific Services in Compton, CA?
Percentage of Population Employed in Professional & Scientific Services in Compton is 2.7%.
What is the Percentage of Population Employed in Professional & Scientific Services in California?
Percentage of Population Employed in Professional & Scientific Services in California is 9.4%.
What is the Percentage of Population Employed in Professional & Scientific Services in the United States?
Percentage of Population Employed in Professional & Scientific Services in the United States is 7.8%.