Zip Codes with the Highest Percentage of Population Employed in Professional & Scientific Services in Burbank, CA

RELATED REPORTS & OPTIONS

Professional & Scientific Services
Population
Families and Households
Female Fertility
Female Fertility (Unmarried)
Race (Community Size)
Race (Percentage)
Ancestry (Community Size)
AfricanAmericanApacheArabArgentineanArmenianAssyrian / Chaldean / SyriacAustralianAustrianBelgianBelizeanBhutaneseBlackfeetBolivianBrazilianBritishBurmeseCanadianCentral AmericanCentral American IndianCherokeeChileanChoctawColombianCosta RicanCroatianCubanCzechCzechoslovakianDanishDominicanDutchEastern EuropeanEcuadorianEgyptianEnglishEuropeanFilipinoFinnishFrenchFrench CanadianGermanGreekGuatemalanHonduranHungarianIcelanderIndian (Asian)IranianIraqiIrishIsraeliItalianJamaicanJapaneseKoreanLebaneseLithuanianMexicanMexican American IndianNative HawaiianNicaraguanNigerianNorthern EuropeanNorwegianPakistaniPalestinianPanamanianPeruvianPolishPortuguesePuerto RicanRomanianRussianSalvadoranScandinavianScotch-IrishScottishSerbianSlavicSlovakSouth AmericanSpaniardSpanishSri LankanSubsaharan AfricanSwedishSwissSyrianThaiTrinidadian and TobagonianUkrainianWelsh
Ancestry (Percentage)
AfricanAmericanApacheArabArgentineanArmenianAssyrian / Chaldean / SyriacAustralianAustrianBelgianBelizeanBhutaneseBlackfeetBolivianBrazilianBritishBurmeseCanadianCentral AmericanCentral American IndianCherokeeChileanChoctawColombianCosta RicanCroatianCubanCzechCzechoslovakianDanishDominicanDutchEastern EuropeanEcuadorianEgyptianEnglishEuropeanFilipinoFinnishFrenchFrench CanadianGermanGreekGuatemalanHonduranHungarianIcelanderIndian (Asian)IranianIraqiIrishIsraeliItalianJamaicanJapaneseKoreanLebaneseLithuanianMexicanMexican American IndianNative HawaiianNicaraguanNigerianNorthern EuropeanNorwegianPakistaniPalestinianPanamanianPeruvianPolishPortuguesePuerto RicanRomanianRussianSalvadoranScandinavianScotch-IrishScottishSerbianSlavicSlovakSouth AmericanSpaniardSpanishSri LankanSubsaharan AfricanSwedishSwissSyrianThaiTrinidadian and TobagonianUkrainianWelsh
Immigrant Origin (Total)
Immigrant Origin (Percentage)
Income
Income (Families)
Income (Households)
Poverty
Poverty (Families)
Unemployment
Employment Occupations
Employment Industries
Employer Class
Commute Time
Commute Means
School Enrollment
Education by Degree Field
Occupancy
Finances
Physical Characteristics
Burbank
States
California Cities
AlamedaAlhambraAnaheimAntiochApple ValleyArcadiaAuburnBakersfieldBerkeleyBeverly HillsBreaBuena ParkBurbankCamarilloCanoga ParkCanyon CountryCarlsbadCarsonCastro ValleyChicoChinoChula VistaCitrus HeightsClovisComptonConcordCoronaCosta MesaCovinaCulver CityDaly CityDanvilleDavisDesert Hot SpringsDowneyDuarteEl CajonEl MonteElk GroveEncinoEscondidoEurekaFairfieldFontanaFremontFresnoFullertonGarden GroveGardenaGlendaleGlendoraGrass ValleyHaywardHemetHesperiaHuntington BeachIndioInglewoodIrvineLa JollaLa MesaLa MiradaLa PuenteLake ElsinoreLakewoodLancasterLivermoreLodiLompocLong BeachLos AltosLos AngelesLos GatosMaderaMantecaMenifeeMercedMission ViejoModestoMonterey ParkMoragaMoreno ValleyMountain ViewMurrietaNapaNewport BeachNorth HollywoodNorthridgeNovatoOaklandOceansideOntarioOrangeOrovilleOxnardPalm DesertPalm SpringsPalmdalePalo AltoPasadenaPerrisPetalumaPleasantonPomonaPortervilleRancho CordovaRancho CucamongaRancho Santa FeReddingRedlandsRedondo BeachRedwood CityRialtoRichmondRiversideRocklinRosevilleSacramentoSalinasSan BernardinoSan ClementeSan DiegoSan FranciscoSan GabrielSan JacintoSan JoseSan LeandroSan Luis ObispoSan MarcosSan MateoSan PedroSan RafaelSan RamonSanta AnaSanta BarbaraSanta ClaraSanta ClaritaSanta CruzSanta MariaSanta MonicaSanta RosaSherman OaksSimi ValleySpring ValleyStocktonSunnyvaleTemeculaThousand OaksTorranceTrabuco CanyonTracyTurlockTustinUplandVacavilleValenciaVallejoVan NuysVenturaVictorvilleVisaliaVistaWalnut CreekWest CovinaWest SacramentoWhittierWoodlandWoodland HillsYorba LindaYuba City
Compare Zip Codes
Comparison Subject

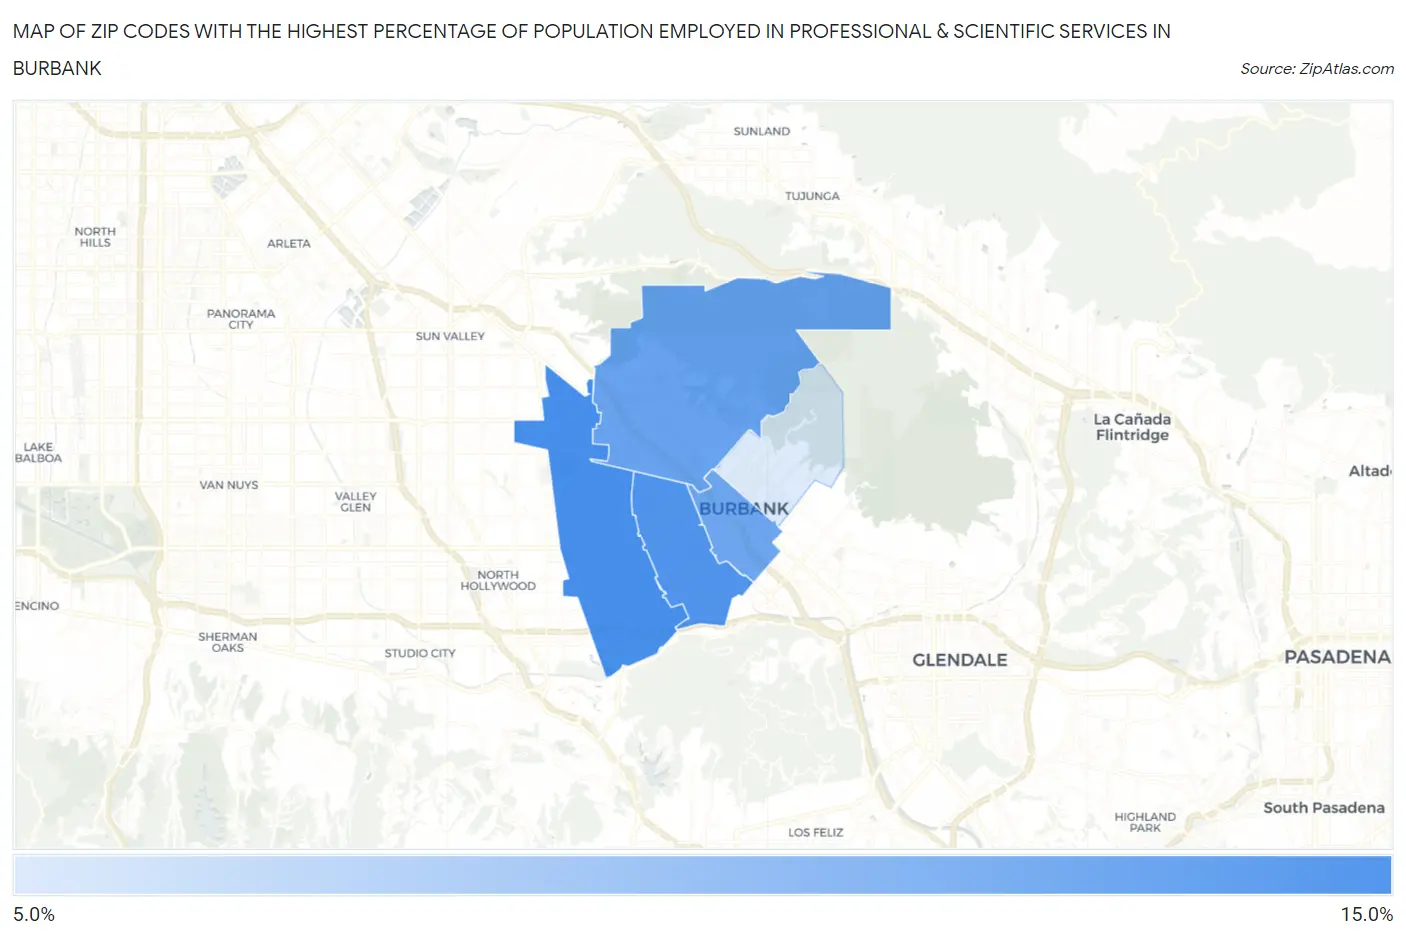
Map of Zip Codes with the Highest Percentage of Population Employed in Professional & Scientific Services in Burbank

0.0%
15.0%
Zip Codes with the Highest Percentage of Population Employed in Professional & Scientific Services in Burbank Map

Zip Codes with the Highest Percentage of Population Employed in Professional & Scientific Services in Burbank, CA

Zip Code % Employed vs State vs National
1.9150510.8%9.4%(+1.40)#4807.8%(+2.99)#3,959
2.9150610.7%9.4%(+1.28)#4897.8%(+2.87)#4,029
3.9150410.4%9.4%(+0.971)#5097.8%(+2.56)#4,268
4.9150210.3%9.4%(+0.888)#5177.8%(+2.48)#4,339
5.915018.9%9.4%(-0.537)#6097.8%(+1.05)#5,617

Common Questions

What are the Top 3 Zip Codes with the Highest Percentage of Population Employed in Professional & Scientific Services in Burbank, CA?
Top 3 Zip Codes with the Highest Percentage of Population Employed in Professional & Scientific Services in Burbank, CA are:
#1
10.8%
#2
10.7%
#3
10.4%
What zip code has the Highest Percentage of Population Employed in Professional & Scientific Services in Burbank, CA?
91505 has the Highest Percentage of Population Employed in Professional & Scientific Services in Burbank, CA with 10.8%.
What is the Percentage of Population Employed in Professional & Scientific Services in Burbank, CA?
Percentage of Population Employed in Professional & Scientific Services in Burbank is 10.0%.
What is the Percentage of Population Employed in Professional & Scientific Services in California?
Percentage of Population Employed in Professional & Scientific Services in California is 9.4%.
What is the Percentage of Population Employed in Professional & Scientific Services in the United States?
Percentage of Population Employed in Professional & Scientific Services in the United States is 7.8%.