Zip Codes with the Highest Percentage of Black / African American Population in Sun City, AZ
RELATED REPORTS & OPTIONS
Black / African American
Sun City
Compare Zip Codes
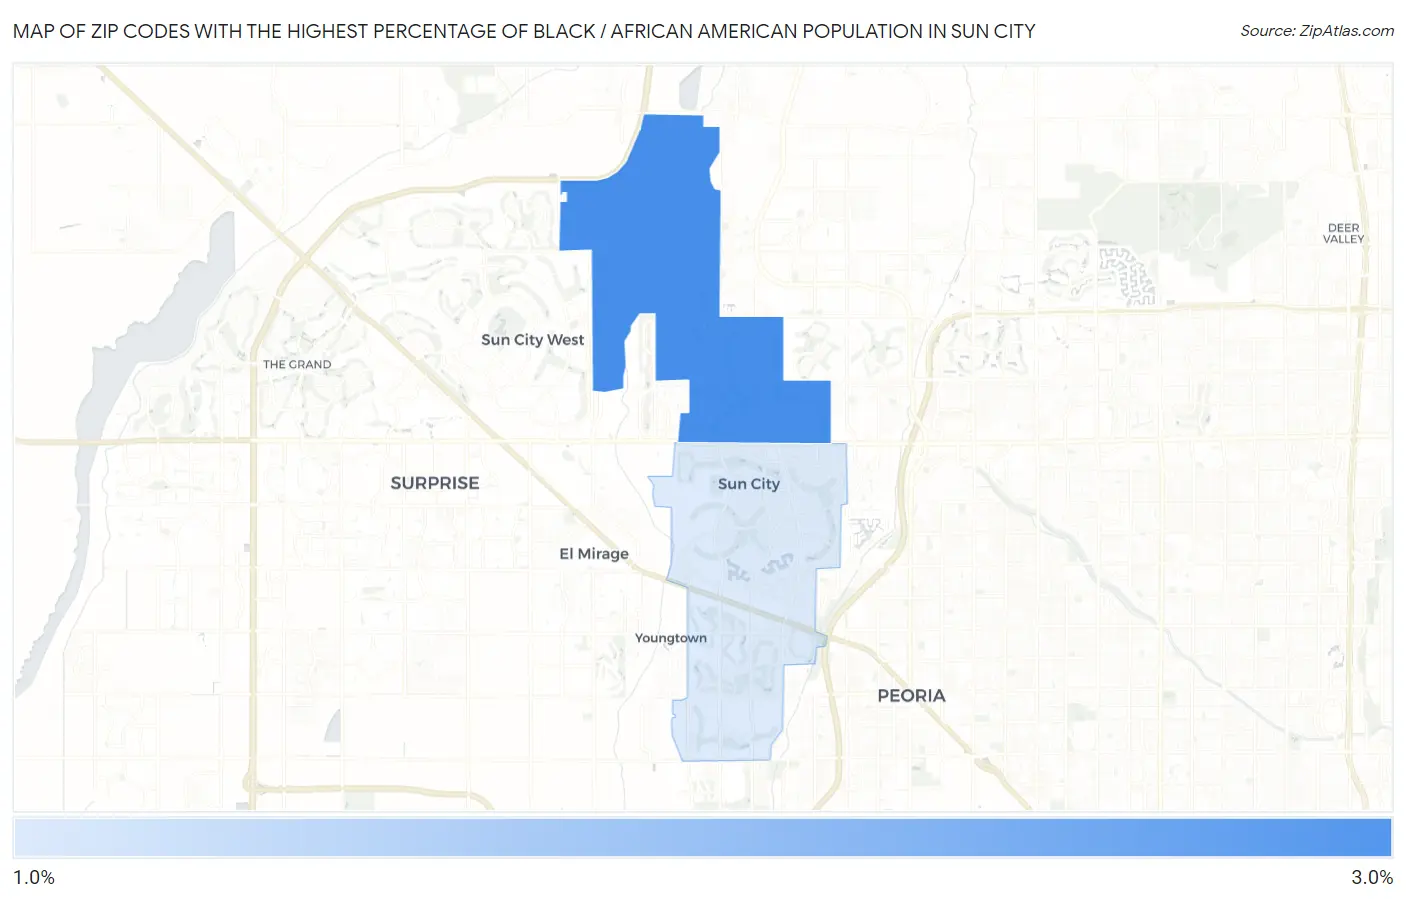
Map of Zip Codes with the Highest Percentage of Black / African American Population in Sun City
1.7%
2.6%
Zip Codes with the Highest Percentage of Black / African American Population in Sun City, AZ
| Zip Code | Black / African American | vs State | vs National | |
| 1. | 85373 | 2.6% | 4.6%(-1.92)#142 | 12.5%(-9.83)#12,395 |
| 2. | 85351 | 1.7% | 4.6%(-2.89)#189 | 12.5%(-10.8)#14,374 |
1
Common Questions
What are the Top Zip Codes with the Highest Percentage of Black / African American Population in Sun City, AZ?
Top Zip Codes with the Highest Percentage of Black / African American Population in Sun City, AZ are:
What zip code has the Highest Percentage of Black / African American Population in Sun City, AZ?
85373 has the Highest Percentage of Black / African American Population in Sun City, AZ with 2.6%.
What is the Percentage of Black / African American Population in Sun City, AZ?
Percentage of Black / African American Population in Sun City is 1.4%.
What is the Percentage of Black / African American Population in Arizona?
Percentage of Black / African American Population in Arizona is 4.6%.
What is the Percentage of Black / African American Population in the United States?
Percentage of Black / African American Population in the United States is 12.5%.