Zip Codes with the Highest Percentage of Population Employed in Agriculture, Fishing & Hunting in Sierra Vista, AZ
RELATED REPORTS & OPTIONS
Agriculture, Fishing & Hunting
Sierra Vista
Compare Zip Codes
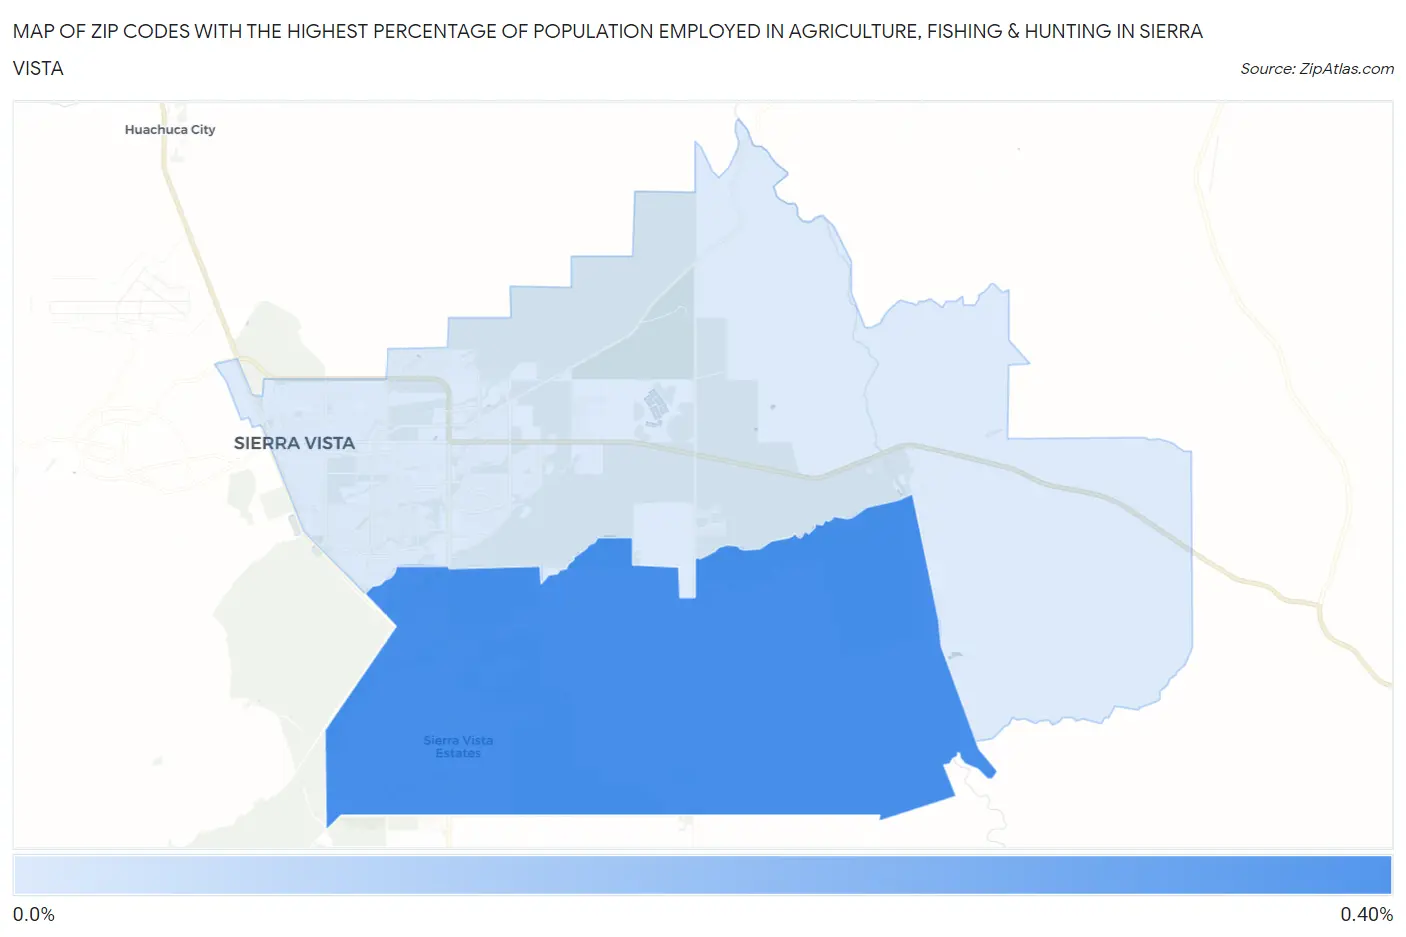
Map of Zip Codes with the Highest Percentage of Population Employed in Agriculture, Fishing & Hunting in Sierra Vista
0.0%
0.40%
Zip Codes with the Highest Percentage of Population Employed in Agriculture, Fishing & Hunting in Sierra Vista, AZ
| Zip Code | % Employed | vs State | vs National | |
| 1. | 85650 | 0.37% | 0.80%(-0.431)#195 | 1.2%(-0.828)#20,417 |
| 2. | 85635 | 0.056% | 0.80%(-0.747)#276 | 1.2%(-1.14)#24,274 |
1
Common Questions
What are the Top Zip Codes with the Highest Percentage of Population Employed in Agriculture, Fishing & Hunting in Sierra Vista, AZ?
Top Zip Codes with the Highest Percentage of Population Employed in Agriculture, Fishing & Hunting in Sierra Vista, AZ are:
What zip code has the Highest Percentage of Population Employed in Agriculture, Fishing & Hunting in Sierra Vista, AZ?
85650 has the Highest Percentage of Population Employed in Agriculture, Fishing & Hunting in Sierra Vista, AZ with 0.37%.
What is the Percentage of Population Employed in Agriculture, Fishing & Hunting in Sierra Vista, AZ?
Percentage of Population Employed in Agriculture, Fishing & Hunting in Sierra Vista is 0.16%.
What is the Percentage of Population Employed in Agriculture, Fishing & Hunting in Arizona?
Percentage of Population Employed in Agriculture, Fishing & Hunting in Arizona is 0.80%.
What is the Percentage of Population Employed in Agriculture, Fishing & Hunting in the United States?
Percentage of Population Employed in Agriculture, Fishing & Hunting in the United States is 1.2%.