Zip Codes with the Highest Percentage of Population Employed in Sales & Related in Phoenix, AZ
RELATED REPORTS & OPTIONS
Sales & Related
Phoenix
Compare Zip Codes
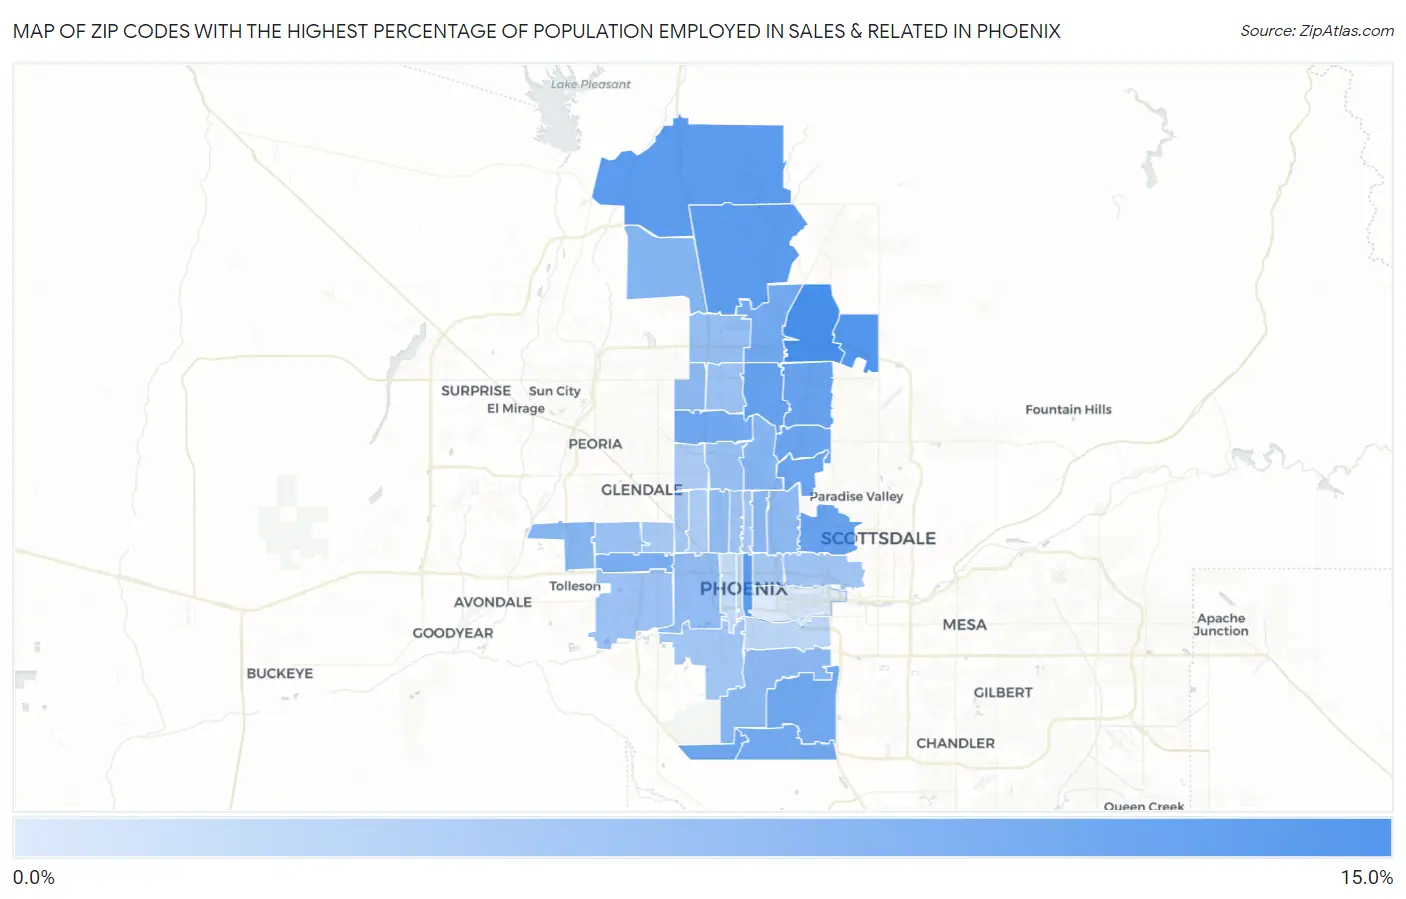
Map of Zip Codes with the Highest Percentage of Population Employed in Sales & Related in Phoenix
4.6%
14.0%
Zip Codes with the Highest Percentage of Population Employed in Sales & Related in Phoenix, AZ
| Zip Code | % Employed | vs State | vs National | |
| 1. | 85050 | 14.0% | 10.3%(+3.68)#51 | 9.6%(+4.43)#3,461 |
| 2. | 85054 | 13.2% | 10.3%(+2.88)#57 | 9.6%(+3.63)#4,252 |
| 3. | 85004 | 12.8% | 10.3%(+2.48)#62 | 9.6%(+3.23)#4,711 |
| 4. | 85085 | 12.8% | 10.3%(+2.46)#63 | 9.6%(+3.21)#4,742 |
| 5. | 85086 | 12.6% | 10.3%(+2.30)#65 | 9.6%(+3.05)#4,955 |
| 6. | 85022 | 12.1% | 10.3%(+1.72)#79 | 9.6%(+2.47)#5,926 |
| 7. | 85032 | 11.9% | 10.3%(+1.60)#85 | 9.6%(+2.35)#6,151 |
| 8. | 85018 | 11.8% | 10.3%(+1.50)#90 | 9.6%(+2.25)#6,335 |
| 9. | 85028 | 11.6% | 10.3%(+1.29)#97 | 9.6%(+2.03)#6,745 |
| 10. | 85045 | 11.5% | 10.3%(+1.12)#105 | 9.6%(+1.87)#7,092 |
| 11. | 85029 | 11.3% | 10.3%(+0.984)#109 | 9.6%(+1.73)#7,402 |
| 12. | 85044 | 11.2% | 10.3%(+0.857)#114 | 9.6%(+1.61)#7,690 |
| 13. | 85048 | 11.1% | 10.3%(+0.803)#116 | 9.6%(+1.55)#7,831 |
| 14. | 85024 | 11.1% | 10.3%(+0.774)#117 | 9.6%(+1.52)#7,890 |
| 15. | 85035 | 10.8% | 10.3%(+0.442)#135 | 9.6%(+1.19)#8,759 |
| 16. | 85083 | 10.2% | 10.3%(-0.181)#162 | 9.6%(+0.569)#10,538 |
| 17. | 85020 | 10.0% | 10.3%(-0.311)#172 | 9.6%(+0.439)#10,900 |
| 18. | 85037 | 9.9% | 10.3%(-0.426)#177 | 9.6%(+0.324)#11,261 |
| 19. | 85014 | 9.5% | 10.3%(-0.828)#188 | 9.6%(-0.078)#12,694 |
| 20. | 85042 | 9.5% | 10.3%(-0.850)#190 | 9.6%(-0.100)#12,758 |
| 21. | 85053 | 9.4% | 10.3%(-0.983)#193 | 9.6%(-0.233)#13,198 |
| 22. | 85016 | 9.4% | 10.3%(-0.988)#195 | 9.6%(-0.239)#13,221 |
| 23. | 85015 | 9.3% | 10.3%(-1.04)#200 | 9.6%(-0.293)#13,425 |
| 24. | 85009 | 9.2% | 10.3%(-1.13)#206 | 9.6%(-0.377)#13,713 |
| 25. | 85027 | 9.0% | 10.3%(-1.35)#215 | 9.6%(-0.601)#14,522 |
| 26. | 85021 | 8.8% | 10.3%(-1.50)#223 | 9.6%(-0.748)#15,082 |
| 27. | 85023 | 8.6% | 10.3%(-1.70)#230 | 9.6%(-0.952)#15,831 |
| 28. | 85033 | 8.6% | 10.3%(-1.73)#232 | 9.6%(-0.985)#15,944 |
| 29. | 85043 | 8.6% | 10.3%(-1.77)#235 | 9.6%(-1.02)#16,078 |
| 30. | 85013 | 8.4% | 10.3%(-1.92)#239 | 9.6%(-1.17)#16,635 |
| 31. | 85008 | 8.3% | 10.3%(-2.02)#244 | 9.6%(-1.28)#16,993 |
| 32. | 85041 | 8.1% | 10.3%(-2.24)#250 | 9.6%(-1.49)#17,700 |
| 33. | 85012 | 8.0% | 10.3%(-2.36)#259 | 9.6%(-1.61)#18,090 |
| 34. | 85006 | 8.0% | 10.3%(-2.38)#260 | 9.6%(-1.63)#18,146 |
| 35. | 85019 | 7.9% | 10.3%(-2.44)#264 | 9.6%(-1.69)#18,336 |
| 36. | 85031 | 7.9% | 10.3%(-2.46)#266 | 9.6%(-1.71)#18,410 |
| 37. | 85051 | 7.5% | 10.3%(-2.86)#274 | 9.6%(-2.11)#19,718 |
| 38. | 85017 | 7.3% | 10.3%(-3.02)#277 | 9.6%(-2.27)#20,215 |
| 39. | 85040 | 6.5% | 10.3%(-3.86)#298 | 9.6%(-3.11)#22,471 |
| 40. | 85003 | 6.5% | 10.3%(-3.88)#299 | 9.6%(-3.13)#22,536 |
| 41. | 85007 | 6.1% | 10.3%(-4.20)#308 | 9.6%(-3.45)#23,333 |
| 42. | 85034 | 4.6% | 10.3%(-5.78)#328 | 9.6%(-5.03)#26,253 |
1
Common Questions
What are the Top 10 Zip Codes with the Highest Percentage of Population Employed in Sales & Related in Phoenix, AZ?
Top 10 Zip Codes with the Highest Percentage of Population Employed in Sales & Related in Phoenix, AZ are:
What zip code has the Highest Percentage of Population Employed in Sales & Related in Phoenix, AZ?
85050 has the Highest Percentage of Population Employed in Sales & Related in Phoenix, AZ with 14.0%.
What is the Percentage of Population Employed in Sales & Related in Phoenix, AZ?
Percentage of Population Employed in Sales & Related in Phoenix is 9.8%.
What is the Percentage of Population Employed in Sales & Related in Arizona?
Percentage of Population Employed in Sales & Related in Arizona is 10.3%.
What is the Percentage of Population Employed in Sales & Related in the United States?
Percentage of Population Employed in Sales & Related in the United States is 9.6%.