Zip Codes with the Highest Percentage of Population Employed in Transportation & Warehousing in Phoenix, AZ
RELATED REPORTS & OPTIONS
Transportation & Warehousing
Phoenix
Compare Zip Codes
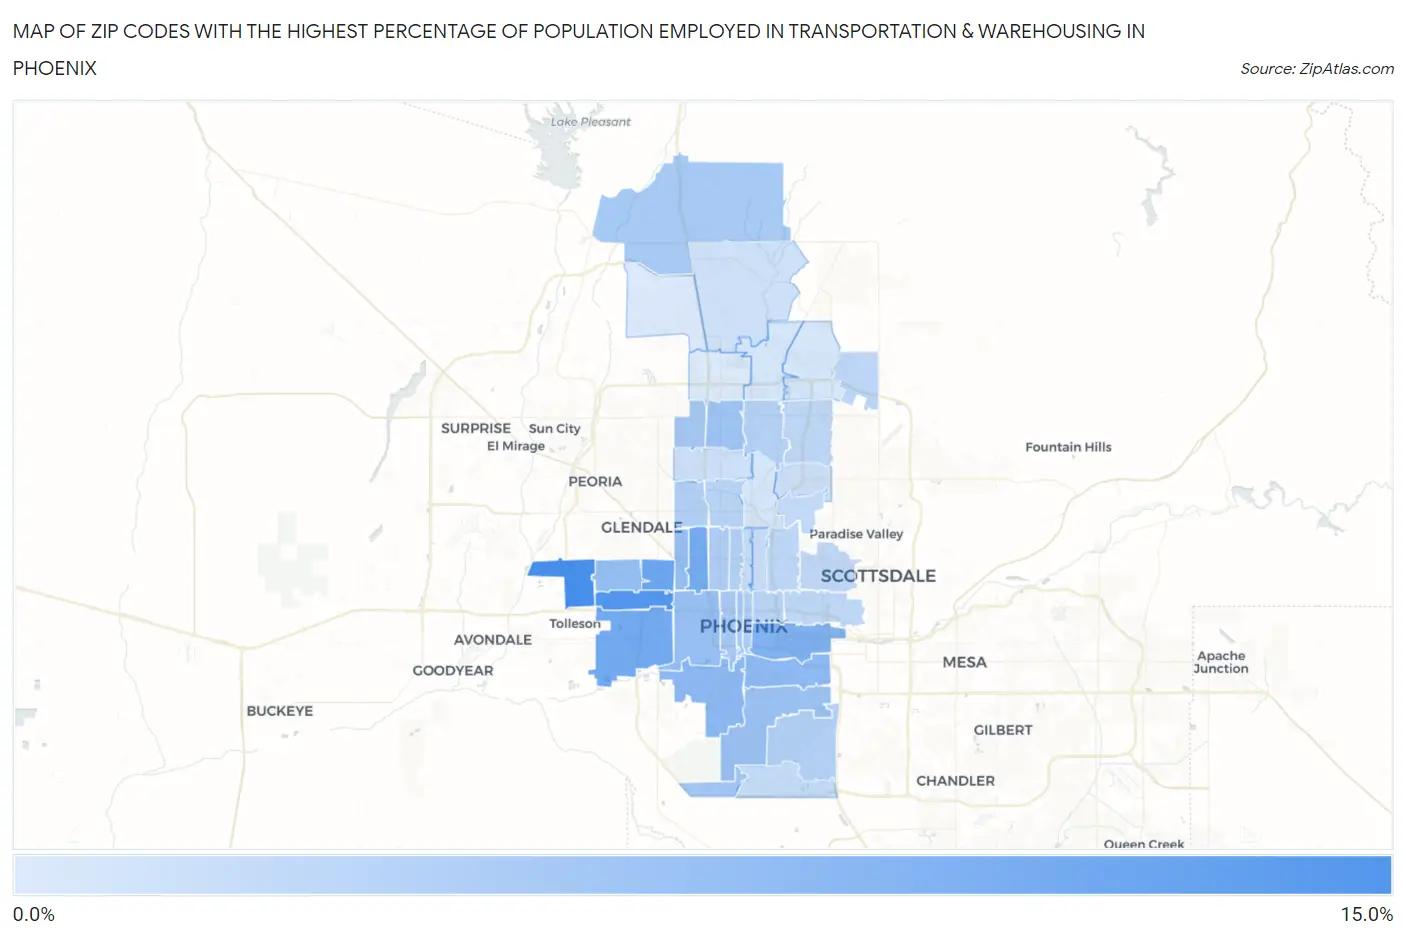
Map of Zip Codes with the Highest Percentage of Population Employed in Transportation & Warehousing in Phoenix
2.8%
10.5%
Zip Codes with the Highest Percentage of Population Employed in Transportation & Warehousing in Phoenix, AZ
| Zip Code | % Employed | vs State | vs National | |
| 1. | 85037 | 10.5% | 4.8%(+5.77)#22 | 4.9%(+5.60)#2,570 |
| 2. | 85035 | 9.9% | 4.8%(+5.09)#26 | 4.9%(+4.92)#2,976 |
| 3. | 85031 | 8.6% | 4.8%(+3.80)#36 | 4.9%(+3.62)#4,191 |
| 4. | 85043 | 8.2% | 4.8%(+3.42)#40 | 4.9%(+3.24)#4,645 |
| 5. | 85017 | 8.1% | 4.8%(+3.33)#41 | 4.9%(+3.15)#4,763 |
| 6. | 85034 | 7.4% | 4.8%(+2.66)#57 | 4.9%(+2.49)#5,762 |
| 7. | 85041 | 6.8% | 4.8%(+2.07)#66 | 4.9%(+1.89)#6,878 |
| 8. | 85040 | 6.7% | 4.8%(+1.93)#67 | 4.9%(+1.76)#7,145 |
| 9. | 85033 | 6.4% | 4.8%(+1.62)#76 | 4.9%(+1.45)#7,822 |
| 10. | 85019 | 6.4% | 4.8%(+1.61)#78 | 4.9%(+1.43)#7,862 |
| 11. | 85009 | 6.3% | 4.8%(+1.50)#80 | 4.9%(+1.33)#8,099 |
| 12. | 85042 | 6.0% | 4.8%(+1.22)#92 | 4.9%(+1.04)#8,809 |
| 13. | 85023 | 6.0% | 4.8%(+1.21)#93 | 4.9%(+1.04)#8,827 |
| 14. | 85045 | 5.7% | 4.8%(+0.914)#103 | 4.9%(+0.740)#9,706 |
| 15. | 85007 | 5.6% | 4.8%(+0.821)#105 | 4.9%(+0.647)#9,982 |
| 16. | 85053 | 5.6% | 4.8%(+0.799)#107 | 4.9%(+0.624)#10,029 |
| 17. | 85086 | 5.4% | 4.8%(+0.659)#113 | 4.9%(+0.484)#10,459 |
| 18. | 85003 | 5.4% | 4.8%(+0.655)#114 | 4.9%(+0.480)#10,477 |
| 19. | 85015 | 5.1% | 4.8%(+0.324)#126 | 4.9%(+0.149)#11,630 |
| 20. | 85004 | 5.1% | 4.8%(+0.306)#127 | 4.9%(+0.132)#11,696 |
| 21. | 85013 | 4.9% | 4.8%(+0.100)#137 | 4.9%(-0.075)#12,376 |
| 22. | 85051 | 4.9% | 4.8%(+0.087)#138 | 4.9%(-0.087)#12,414 |
| 23. | 85044 | 4.7% | 4.8%(-0.041)#147 | 4.9%(-0.216)#12,912 |
| 24. | 85022 | 4.7% | 4.8%(-0.042)#148 | 4.9%(-0.217)#12,923 |
| 25. | 85006 | 4.6% | 4.8%(-0.212)#158 | 4.9%(-0.386)#13,572 |
| 26. | 85021 | 4.5% | 4.8%(-0.312)#164 | 4.9%(-0.486)#13,930 |
| 27. | 85054 | 4.4% | 4.8%(-0.411)#171 | 4.9%(-0.586)#14,345 |
| 28. | 85008 | 4.3% | 4.8%(-0.461)#176 | 4.9%(-0.635)#14,548 |
| 29. | 85016 | 4.3% | 4.8%(-0.513)#178 | 4.9%(-0.688)#14,771 |
| 30. | 85032 | 4.2% | 4.8%(-0.550)#180 | 4.9%(-0.725)#14,932 |
| 31. | 85018 | 4.2% | 4.8%(-0.588)#185 | 4.9%(-0.763)#15,085 |
| 32. | 85048 | 3.9% | 4.8%(-0.853)#198 | 4.9%(-1.03)#16,280 |
| 33. | 85012 | 3.9% | 4.8%(-0.886)#200 | 4.9%(-1.06)#16,421 |
| 34. | 85014 | 3.9% | 4.8%(-0.912)#202 | 4.9%(-1.09)#16,536 |
| 35. | 85029 | 3.6% | 4.8%(-1.15)#216 | 4.9%(-1.32)#17,554 |
| 36. | 85028 | 3.6% | 4.8%(-1.20)#217 | 4.9%(-1.38)#17,782 |
| 37. | 85085 | 3.4% | 4.8%(-1.34)#224 | 4.9%(-1.52)#18,377 |
| 38. | 85050 | 3.1% | 4.8%(-1.67)#240 | 4.9%(-1.84)#19,788 |
| 39. | 85024 | 3.1% | 4.8%(-1.69)#242 | 4.9%(-1.87)#19,915 |
| 40. | 85020 | 3.1% | 4.8%(-1.70)#243 | 4.9%(-1.88)#19,963 |
| 41. | 85083 | 2.9% | 4.8%(-1.89)#256 | 4.9%(-2.07)#20,784 |
| 42. | 85027 | 2.8% | 4.8%(-2.01)#258 | 4.9%(-2.19)#21,299 |
1
Common Questions
What are the Top 10 Zip Codes with the Highest Percentage of Population Employed in Transportation & Warehousing in Phoenix, AZ?
Top 10 Zip Codes with the Highest Percentage of Population Employed in Transportation & Warehousing in Phoenix, AZ are:
What zip code has the Highest Percentage of Population Employed in Transportation & Warehousing in Phoenix, AZ?
85037 has the Highest Percentage of Population Employed in Transportation & Warehousing in Phoenix, AZ with 10.5%.
What is the Percentage of Population Employed in Transportation & Warehousing in Phoenix, AZ?
Percentage of Population Employed in Transportation & Warehousing in Phoenix is 5.4%.
What is the Percentage of Population Employed in Transportation & Warehousing in Arizona?
Percentage of Population Employed in Transportation & Warehousing in Arizona is 4.8%.
What is the Percentage of Population Employed in Transportation & Warehousing in the United States?
Percentage of Population Employed in Transportation & Warehousing in the United States is 4.9%.