Zip Codes with the Highest Percentage of Population Employed in Farming, Fishing & Forestry in Peoria, AZ
RELATED REPORTS & OPTIONS
Farming, Fishing & Forestry
Peoria
Compare Zip Codes
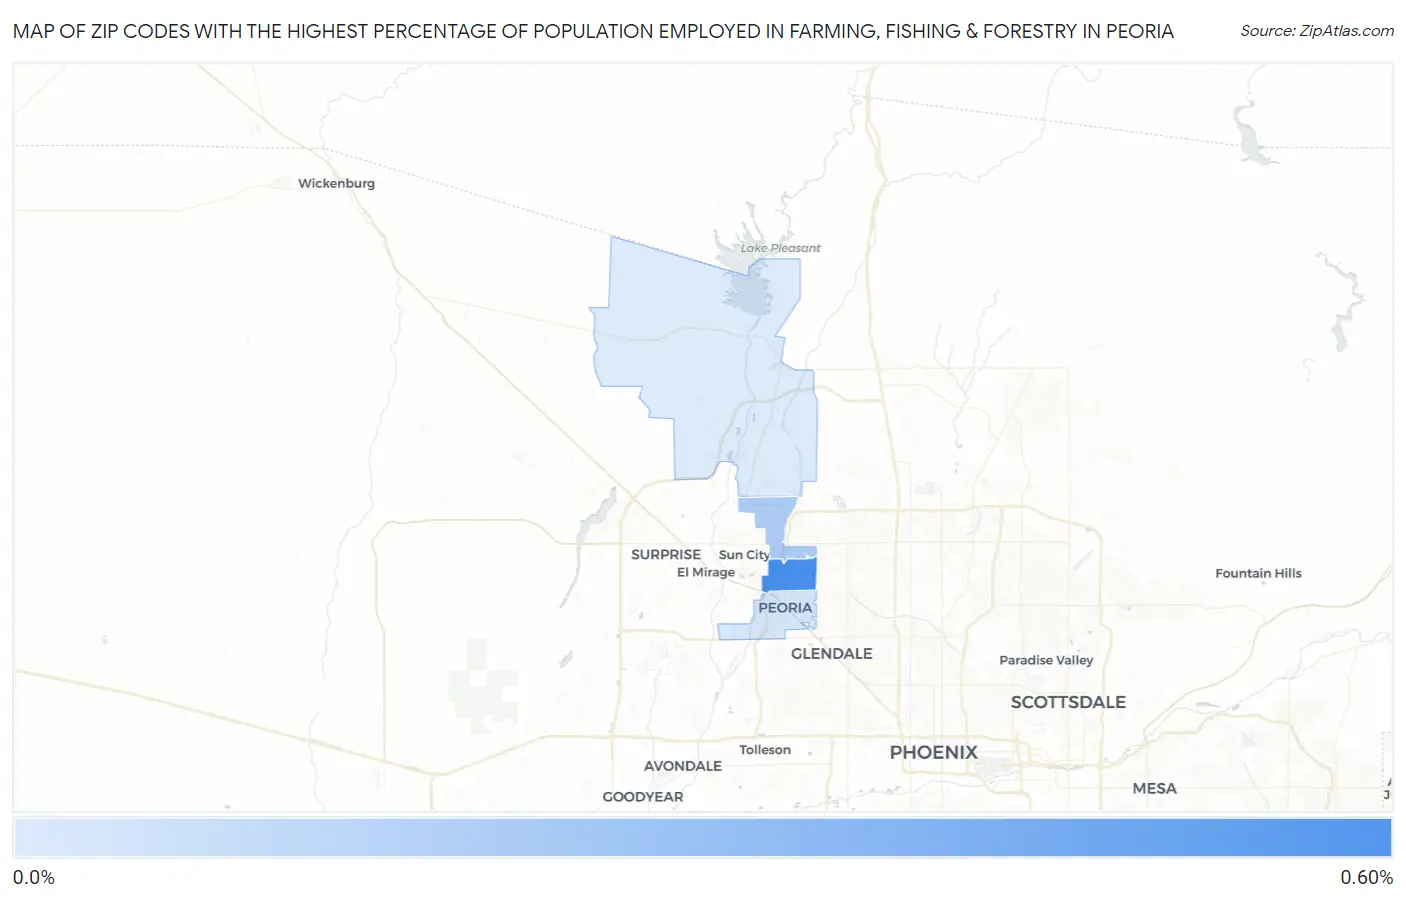
Map of Zip Codes with the Highest Percentage of Population Employed in Farming, Fishing & Forestry in Peoria
0.0%
0.60%
Zip Codes with the Highest Percentage of Population Employed in Farming, Fishing & Forestry in Peoria, AZ
| Zip Code | % Employed | vs State | vs National | |
| 1. | 85381 | 0.51% | 0.51%(+0.006)#109 | 0.61%(-0.093)#12,731 |
| 2. | 85382 | 0.23% | 0.51%(-0.282)#151 | 0.61%(-0.380)#15,762 |
| 3. | 85345 | 0.11% | 0.51%(-0.394)#179 | 0.61%(-0.492)#17,540 |
| 4. | 85383 | 0.093% | 0.51%(-0.414)#183 | 0.61%(-0.513)#17,875 |
1
Common Questions
What are the Top 3 Zip Codes with the Highest Percentage of Population Employed in Farming, Fishing & Forestry in Peoria, AZ?
Top 3 Zip Codes with the Highest Percentage of Population Employed in Farming, Fishing & Forestry in Peoria, AZ are:
What zip code has the Highest Percentage of Population Employed in Farming, Fishing & Forestry in Peoria, AZ?
85381 has the Highest Percentage of Population Employed in Farming, Fishing & Forestry in Peoria, AZ with 0.51%.
What is the Percentage of Population Employed in Farming, Fishing & Forestry in Peoria, AZ?
Percentage of Population Employed in Farming, Fishing & Forestry in Peoria is 0.19%.
What is the Percentage of Population Employed in Farming, Fishing & Forestry in Arizona?
Percentage of Population Employed in Farming, Fishing & Forestry in Arizona is 0.51%.
What is the Percentage of Population Employed in Farming, Fishing & Forestry in the United States?
Percentage of Population Employed in Farming, Fishing & Forestry in the United States is 0.61%.