Zip Codes with the Highest Percentage of Population Employed in Sales & Related in Flagstaff, AZ
RELATED REPORTS & OPTIONS
Sales & Related
Flagstaff
Compare Zip Codes
Map of Zip Codes with the Highest Percentage of Population Employed in Sales & Related in Flagstaff
7.9%
10.0%
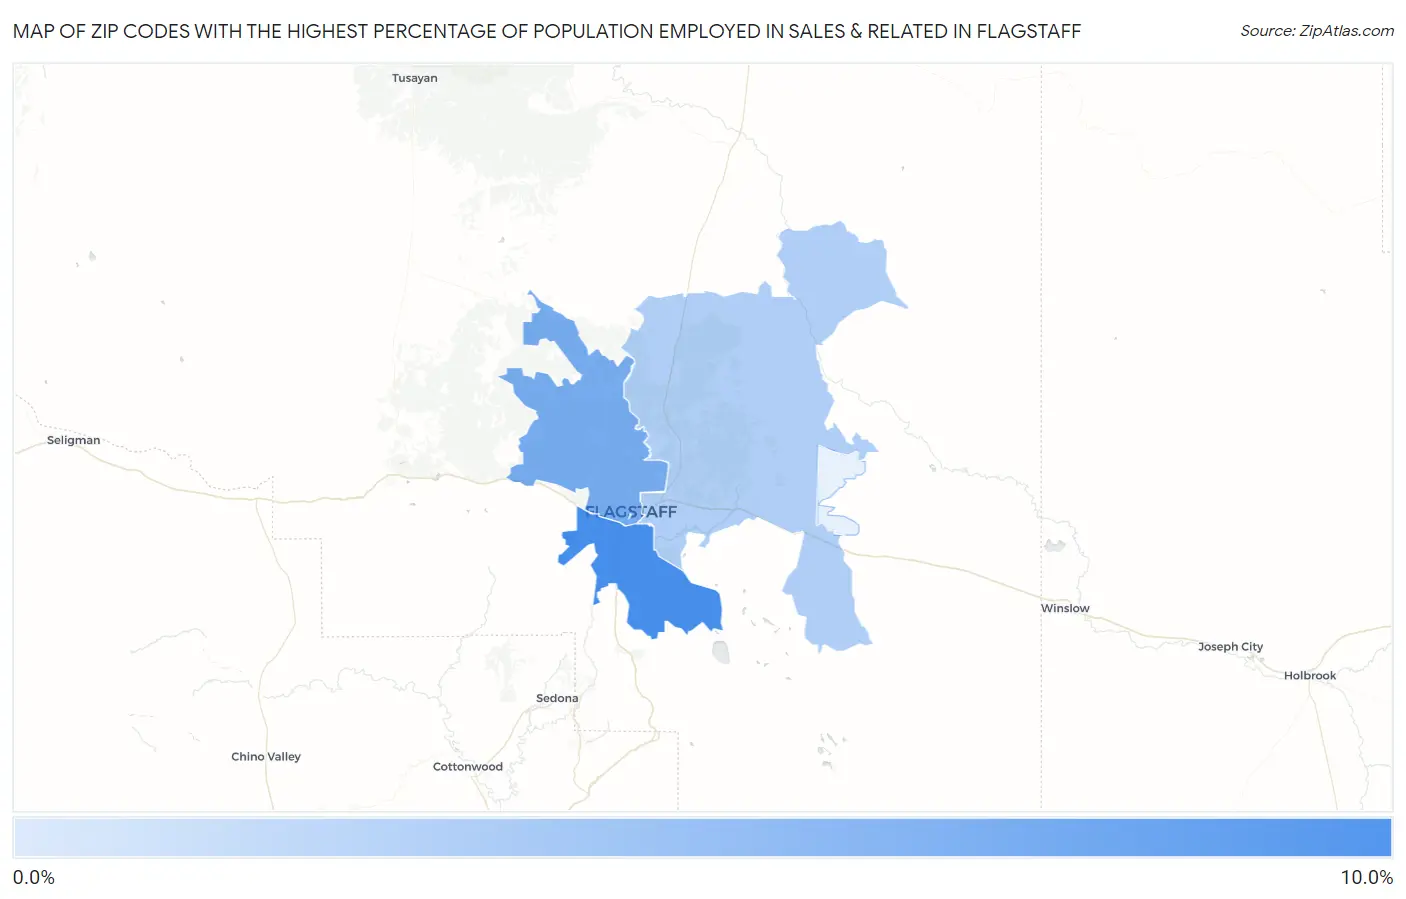
Zip Codes with the Highest Percentage of Population Employed in Sales & Related in Flagstaff, AZ
| Zip Code | % Employed | vs State | vs National | |
| 1. | 86005 | 10.0% | 10.3%(-0.345)#173 | 9.6%(+0.405)#10,995 |
| 2. | 86001 | 9.3% | 10.3%(-1.02)#198 | 9.6%(-0.267)#13,331 |
| 3. | 86004 | 8.5% | 10.3%(-1.81)#236 | 9.6%(-1.06)#16,208 |
| 4. | 86011 | 7.9% | 10.3%(-2.41)#263 | 9.6%(-1.67)#18,259 |
1
Common Questions
What are the Top 3 Zip Codes with the Highest Percentage of Population Employed in Sales & Related in Flagstaff, AZ?
Top 3 Zip Codes with the Highest Percentage of Population Employed in Sales & Related in Flagstaff, AZ are:
What zip code has the Highest Percentage of Population Employed in Sales & Related in Flagstaff, AZ?
86005 has the Highest Percentage of Population Employed in Sales & Related in Flagstaff, AZ with 10.0%.
What is the Percentage of Population Employed in Sales & Related in Flagstaff, AZ?
Percentage of Population Employed in Sales & Related in Flagstaff is 9.7%.
What is the Percentage of Population Employed in Sales & Related in Arizona?
Percentage of Population Employed in Sales & Related in Arizona is 10.3%.
What is the Percentage of Population Employed in Sales & Related in the United States?
Percentage of Population Employed in Sales & Related in the United States is 9.6%.