Zip Codes with the Highest Percentage of Population Employed in Arts, Entertainment & Recreation in Chandler, AZ
RELATED REPORTS & OPTIONS
Arts, Entertainment & Recreation
Chandler
Compare Zip Codes
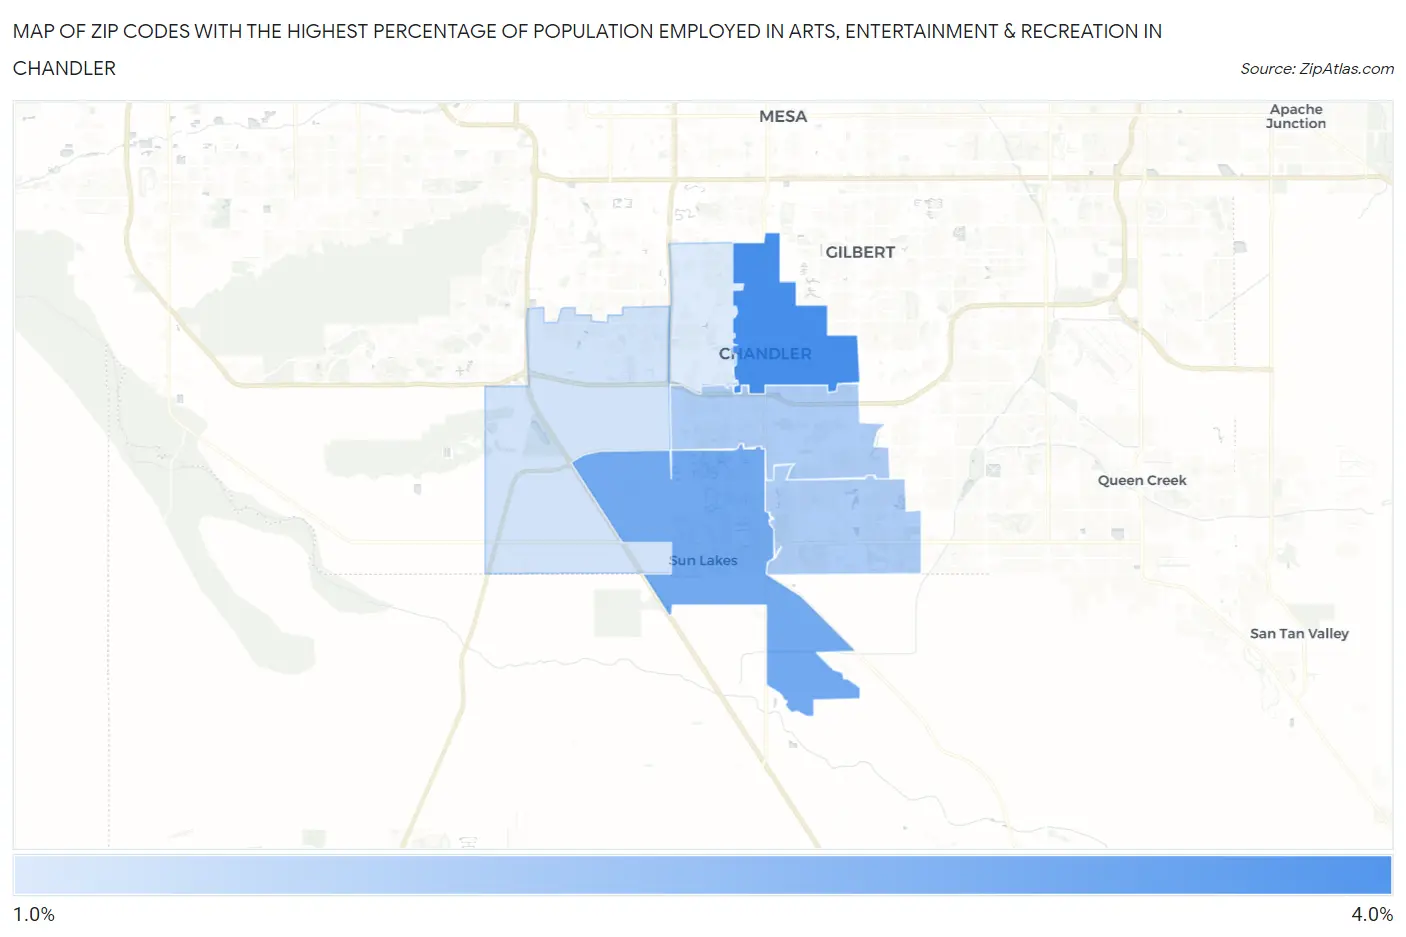
Map of Zip Codes with the Highest Percentage of Population Employed in Arts, Entertainment & Recreation in Chandler
0.0%
4.0%
Zip Codes with the Highest Percentage of Population Employed in Arts, Entertainment & Recreation in Chandler, AZ
| Zip Code | % Employed | vs State | vs National | |
| 1. | 85225 | 3.7% | 2.3%(+1.36)#73 | 2.1%(+1.59)#3,827 |
| 2. | 85248 | 3.0% | 2.3%(+0.719)#99 | 2.1%(+0.947)#5,275 |
| 3. | 85286 | 2.2% | 2.3%(-0.076)#159 | 2.1%(+0.152)#8,443 |
| 4. | 85249 | 2.2% | 2.3%(-0.082)#160 | 2.1%(+0.146)#8,474 |
| 5. | 85226 | 1.7% | 2.3%(-0.600)#215 | 2.1%(-0.372)#11,665 |
| 6. | 85224 | 1.5% | 2.3%(-0.768)#239 | 2.1%(-0.540)#12,941 |
1
Common Questions
What are the Top 5 Zip Codes with the Highest Percentage of Population Employed in Arts, Entertainment & Recreation in Chandler, AZ?
Top 5 Zip Codes with the Highest Percentage of Population Employed in Arts, Entertainment & Recreation in Chandler, AZ are:
What zip code has the Highest Percentage of Population Employed in Arts, Entertainment & Recreation in Chandler, AZ?
85225 has the Highest Percentage of Population Employed in Arts, Entertainment & Recreation in Chandler, AZ with 3.7%.
What is the Percentage of Population Employed in Arts, Entertainment & Recreation in Chandler, AZ?
Percentage of Population Employed in Arts, Entertainment & Recreation in Chandler is 2.5%.
What is the Percentage of Population Employed in Arts, Entertainment & Recreation in Arizona?
Percentage of Population Employed in Arts, Entertainment & Recreation in Arizona is 2.3%.
What is the Percentage of Population Employed in Arts, Entertainment & Recreation in the United States?
Percentage of Population Employed in Arts, Entertainment & Recreation in the United States is 2.1%.