Zip Codes with the Highest Percentage of Population Employed in Arts, Entertainment & Recreation in Casa Grande, AZ
RELATED REPORTS & OPTIONS
Arts, Entertainment & Recreation
Casa Grande
Compare Zip Codes
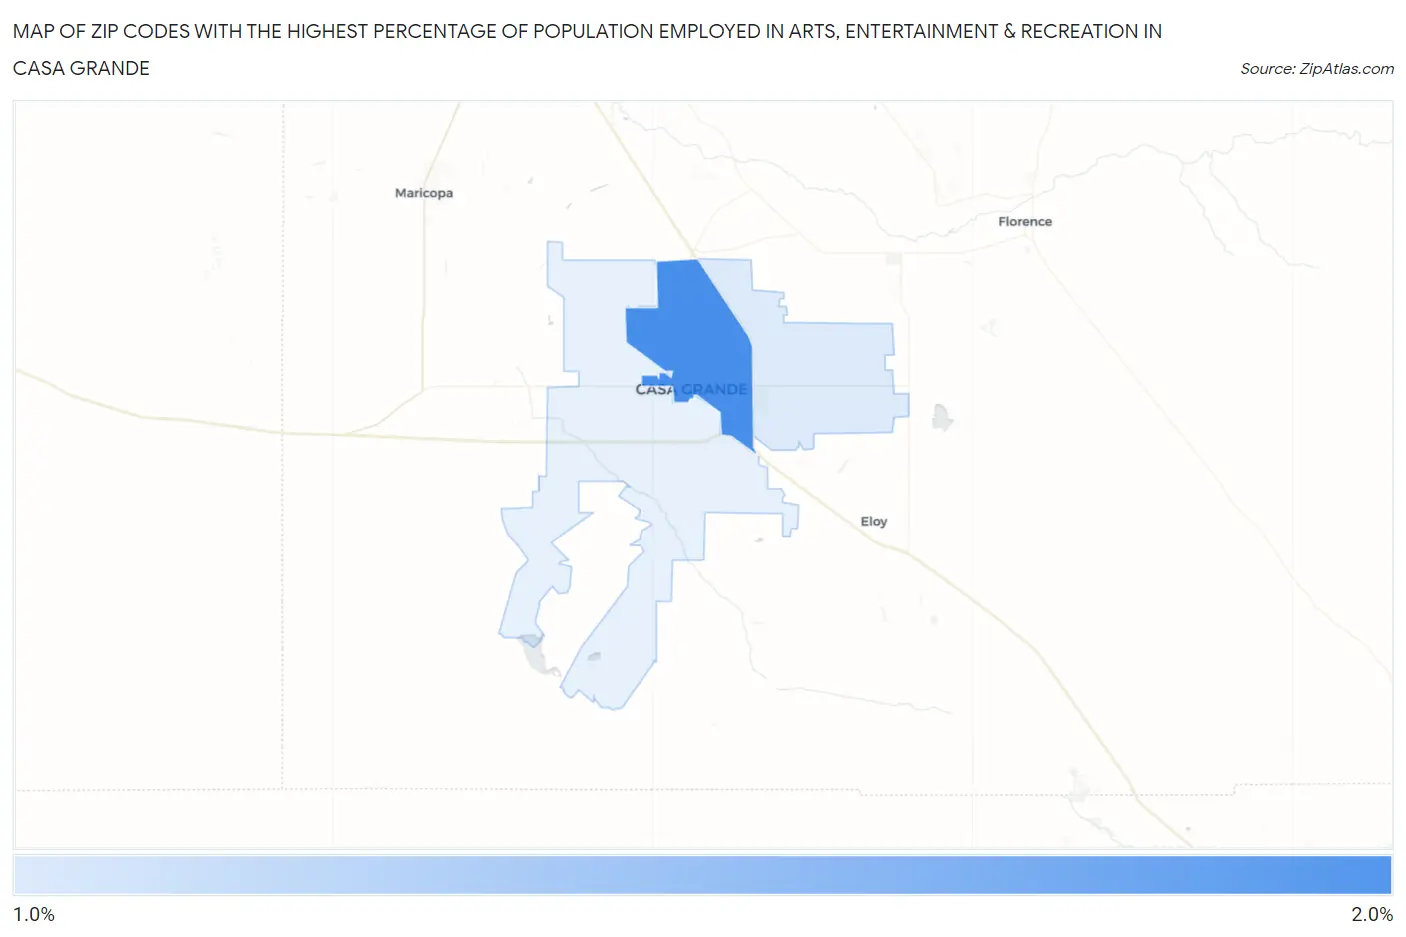
Map of Zip Codes with the Highest Percentage of Population Employed in Arts, Entertainment & Recreation in Casa Grande
0.0%
2.0%
Zip Codes with the Highest Percentage of Population Employed in Arts, Entertainment & Recreation in Casa Grande, AZ
| Zip Code | % Employed | vs State | vs National | |
| 1. | 85122 | 1.9% | 2.3%(-0.400)#198 | 2.1%(-0.172)#10,321 |
| 2. | 85194 | 1.3% | 2.3%(-1.05)#266 | 2.1%(-0.819)#14,997 |
1
Common Questions
What are the Top Zip Codes with the Highest Percentage of Population Employed in Arts, Entertainment & Recreation in Casa Grande, AZ?
Top Zip Codes with the Highest Percentage of Population Employed in Arts, Entertainment & Recreation in Casa Grande, AZ are:
What zip code has the Highest Percentage of Population Employed in Arts, Entertainment & Recreation in Casa Grande, AZ?
85122 has the Highest Percentage of Population Employed in Arts, Entertainment & Recreation in Casa Grande, AZ with 1.9%.
What is the Percentage of Population Employed in Arts, Entertainment & Recreation in Casa Grande, AZ?
Percentage of Population Employed in Arts, Entertainment & Recreation in Casa Grande is 1.9%.
What is the Percentage of Population Employed in Arts, Entertainment & Recreation in Arizona?
Percentage of Population Employed in Arts, Entertainment & Recreation in Arizona is 2.3%.
What is the Percentage of Population Employed in Arts, Entertainment & Recreation in the United States?
Percentage of Population Employed in Arts, Entertainment & Recreation in the United States is 2.1%.