Zip Codes with the Highest Percentage of Population Employed in Farming, Fishing & Forestry in Casa Grande, AZ
RELATED REPORTS & OPTIONS
Farming, Fishing & Forestry
Casa Grande
Compare Zip Codes
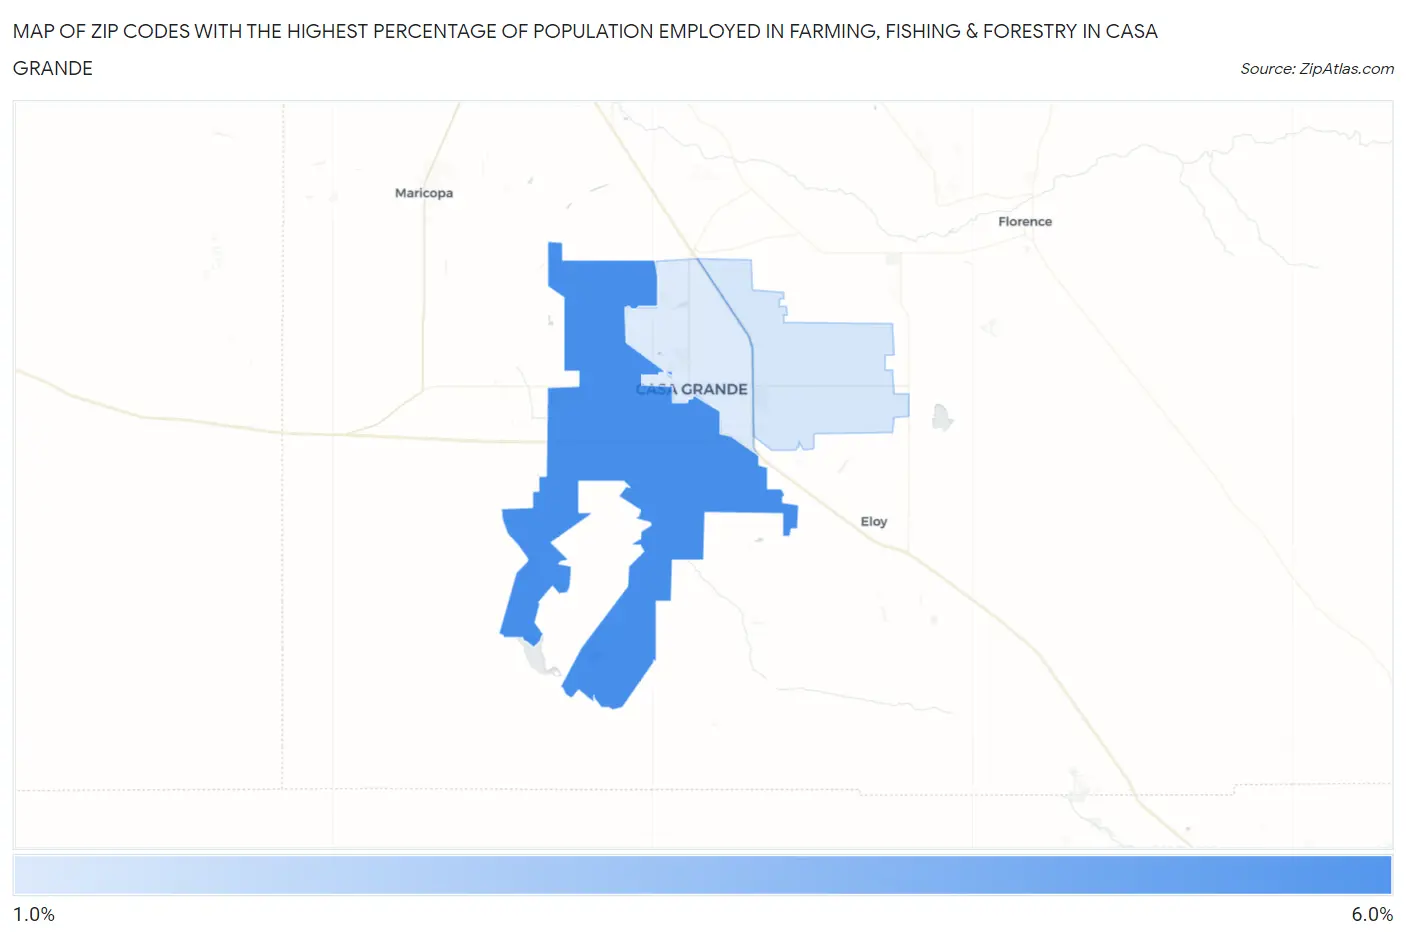
Map of Zip Codes with the Highest Percentage of Population Employed in Farming, Fishing & Forestry in Casa Grande
0.0%
6.0%
Zip Codes with the Highest Percentage of Population Employed in Farming, Fishing & Forestry in Casa Grande, AZ
| Zip Code | % Employed | vs State | vs National | |
| 1. | 85193 | 5.1% | 0.51%(+4.56)#22 | 0.61%(+4.47)#2,880 |
| 2. | 85194 | 1.6% | 0.51%(+1.08)#53 | 0.61%(+0.985)#7,607 |
| 3. | 85122 | 1.4% | 0.51%(+0.923)#58 | 0.61%(+0.824)#8,104 |
1
Common Questions
What are the Top Zip Codes with the Highest Percentage of Population Employed in Farming, Fishing & Forestry in Casa Grande, AZ?
Top Zip Codes with the Highest Percentage of Population Employed in Farming, Fishing & Forestry in Casa Grande, AZ are:
What zip code has the Highest Percentage of Population Employed in Farming, Fishing & Forestry in Casa Grande, AZ?
85193 has the Highest Percentage of Population Employed in Farming, Fishing & Forestry in Casa Grande, AZ with 5.1%.
What is the Percentage of Population Employed in Farming, Fishing & Forestry in Casa Grande, AZ?
Percentage of Population Employed in Farming, Fishing & Forestry in Casa Grande is 1.5%.
What is the Percentage of Population Employed in Farming, Fishing & Forestry in Arizona?
Percentage of Population Employed in Farming, Fishing & Forestry in Arizona is 0.51%.
What is the Percentage of Population Employed in Farming, Fishing & Forestry in the United States?
Percentage of Population Employed in Farming, Fishing & Forestry in the United States is 0.61%.