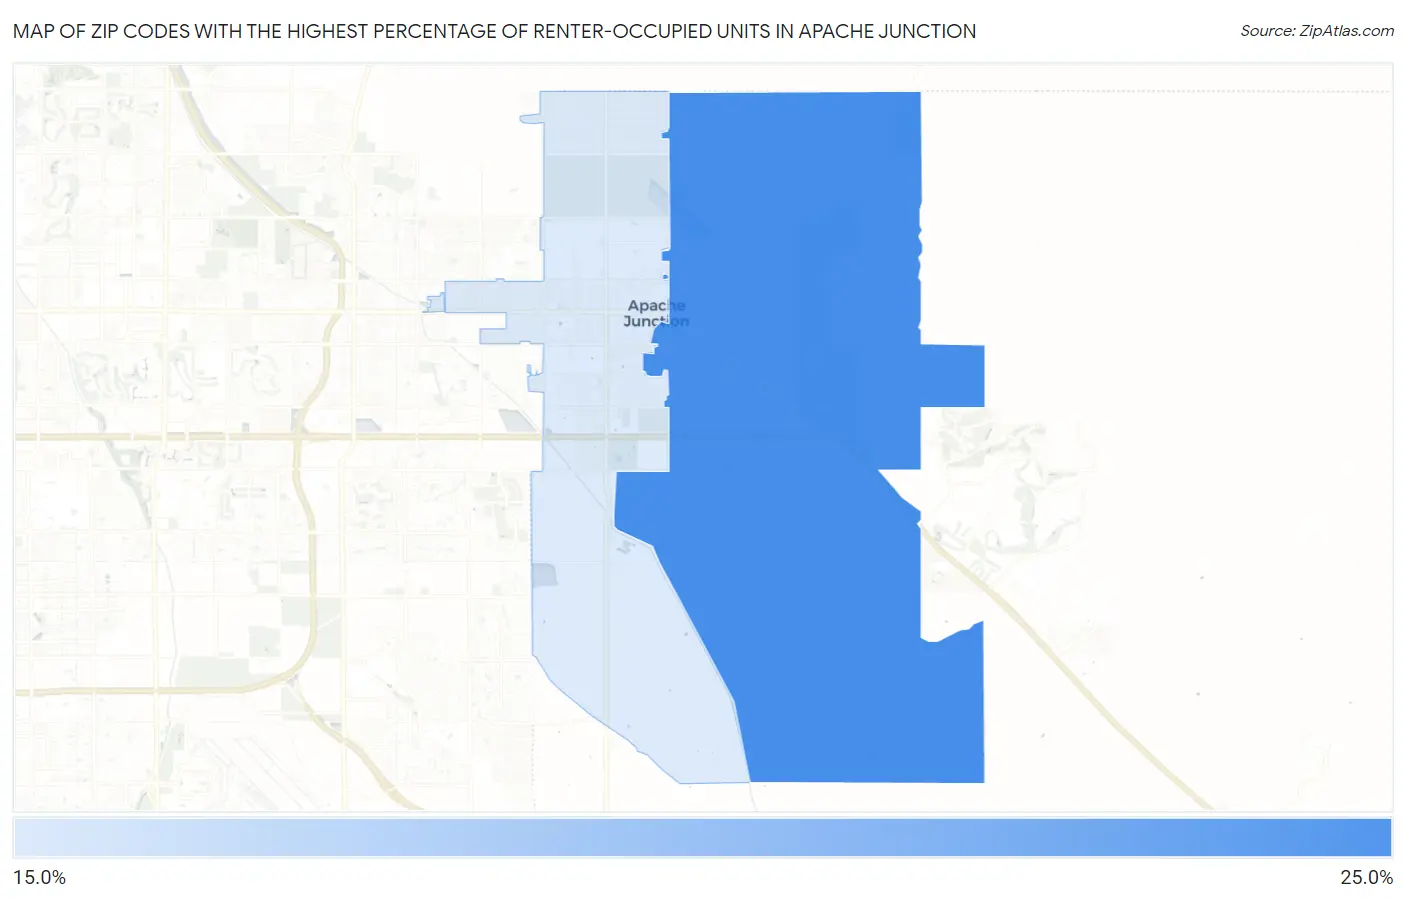
Zip Codes with the Highest Percentage of Renter-Occupied Units in Apache Junction, AZ
RELATED REPORTS & OPTIONS
Highest Renter-Occupied
Apache Junction
Compare Zip Codes
Map of Zip Codes with the Highest Percentage of Renter-Occupied Units in Apache Junction
18.5%
21.1%
Zip Codes with the Highest Percentage of Renter-Occupied Units in Apache Junction, AZ
| Zip Code | % Renter-Occupied | vs State | vs National | |
| 1. | 85119 | 21.1% | 33.7%(-12.6)#235 | 35.2%(-14.1)#17,154 |
| 2. | 85120 | 18.5% | 33.7%(-15.3)#263 | 35.2%(-16.7)#19,711 |
1
Common Questions
What are the Top Zip Codes with the Highest Percentage of Renter-Occupied Units in Apache Junction, AZ?
Top Zip Codes with the Highest Percentage of Renter-Occupied Units in Apache Junction, AZ are:
What zip code has the Highest Percentage of Renter-Occupied Units in Apache Junction, AZ?
85119 has the Highest Percentage of Renter-Occupied Units in Apache Junction, AZ with 21.1%.
What is the Percentage of Renter-Occupied Units in Apache Junction, AZ?
Percentage of Renter-Occupied Units in Apache Junction is 22.2%.
What is the Percentage of Renter-Occupied Units in Arizona?
Percentage of Renter-Occupied Units in Arizona is 33.7%.
What is the Percentage of Renter-Occupied Units in the United States?
Percentage of Renter-Occupied Units in the United States is 35.2%.