Zip Codes with the Highest Unemployment Rate in Arkansas
RELATED REPORTS & OPTIONS
Highest Unemployment
Arkansas
Compare Zip Codes
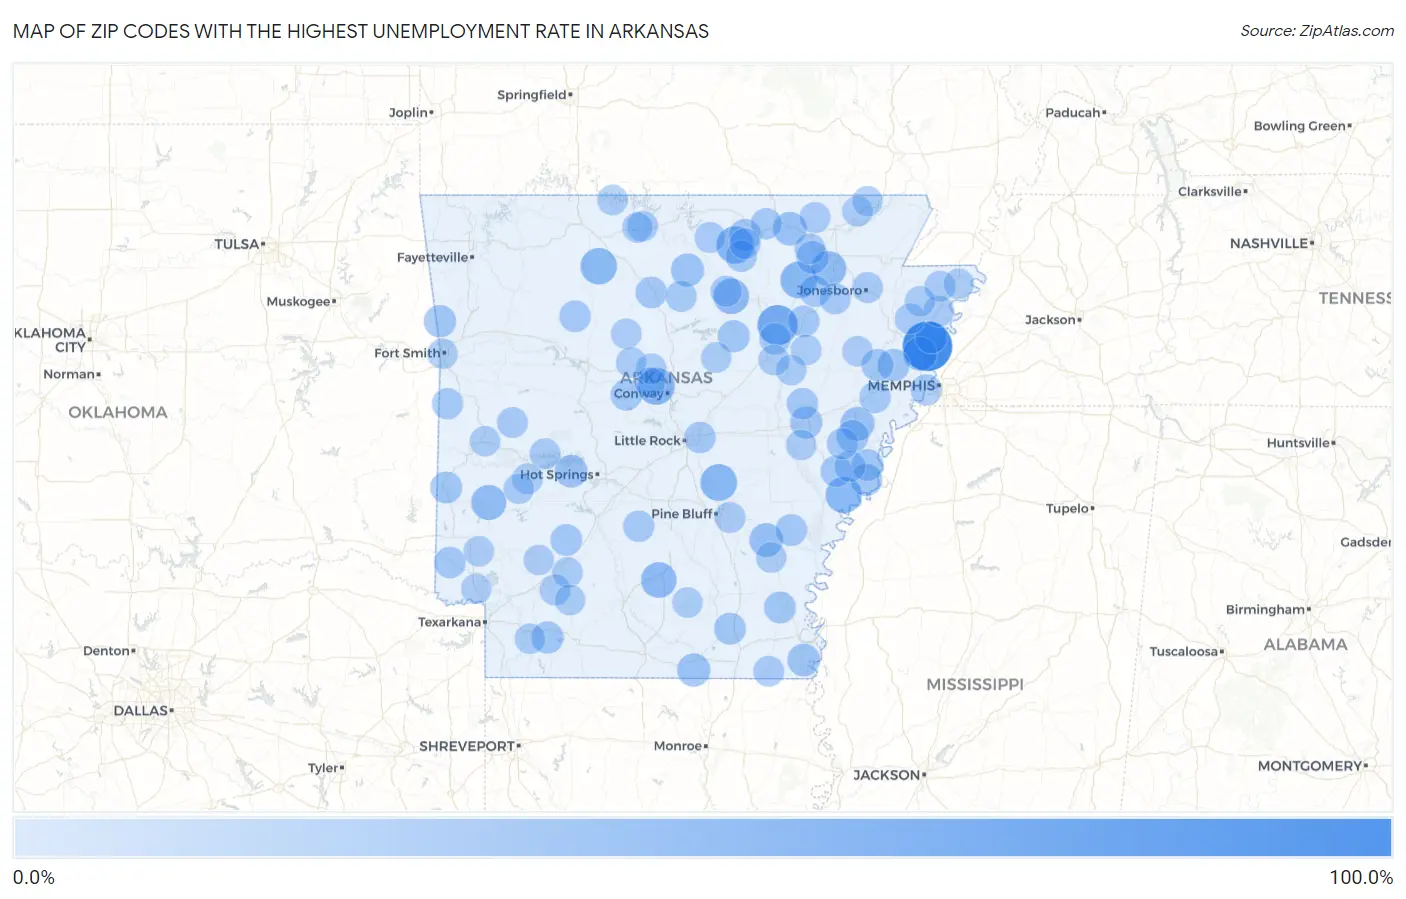
Map of Zip Codes with the Highest Unemployment Rate in Arkansas
0.0%
100.0%
Zip Codes with the Highest Unemployment Rate in Arkansas
| Zip Code | Unemployment Rate | vs State | vs National | |
| 1. | 72338 | 100.0% | 4.8%(+95.2)#1 | 5.0%(+95.0)#20 |
| 2. | 72165 | 54.5% | 4.8%(+49.7)#2 | 5.0%(+49.5)#82 |
| 3. | 72584 | 40.8% | 4.8%(+36.0)#3 | 5.0%(+35.8)#172 |
| 4. | 72107 | 40.0% | 4.8%(+35.2)#4 | 5.0%(+35.0)#183 |
| 5. | 72572 | 38.3% | 4.8%(+33.5)#5 | 5.0%(+33.3)#200 |
| 6. | 72168 | 38.2% | 4.8%(+33.4)#6 | 5.0%(+33.2)#201 |
| 7. | 72640 | 36.8% | 4.8%(+32.0)#7 | 5.0%(+31.8)#219 |
| 8. | 72389 | 35.6% | 4.8%(+30.8)#8 | 5.0%(+30.6)#233 |
| 9. | 71766 | 33.3% | 4.8%(+28.5)#9 | 5.0%(+28.3)#263 |
| 10. | 72555 | 33.0% | 4.8%(+28.2)#10 | 5.0%(+28.0)#276 |
| 11. | 72445 | 30.4% | 4.8%(+25.6)#11 | 5.0%(+25.4)#330 |
| 12. | 71971 | 30.2% | 4.8%(+25.4)#12 | 5.0%(+25.2)#334 |
| 13. | 72384 | 25.0% | 4.8%(+20.2)#13 | 5.0%(+20.0)#506 |
| 14. | 72341 | 24.8% | 4.8%(+20.0)#14 | 5.0%(+19.8)#523 |
| 15. | 71643 | 24.3% | 4.8%(+19.5)#15 | 5.0%(+19.3)#539 |
| 16. | 72482 | 23.6% | 4.8%(+18.8)#16 | 5.0%(+18.6)#574 |
| 17. | 71747 | 21.6% | 4.8%(+16.8)#17 | 5.0%(+16.6)#686 |
| 18. | 72533 | 21.2% | 4.8%(+16.4)#18 | 5.0%(+16.2)#716 |
| 19. | 71640 | 19.2% | 4.8%(+14.4)#19 | 5.0%(+14.2)#891 |
| 20. | 71968 | 19.1% | 4.8%(+14.3)#20 | 5.0%(+14.1)#898 |
| 21. | 72458 | 18.7% | 4.8%(+13.9)#21 | 5.0%(+13.7)#932 |
| 22. | 72360 | 17.8% | 4.8%(+13.0)#22 | 5.0%(+12.8)#1,016 |
| 23. | 72955 | 17.3% | 4.8%(+12.5)#23 | 5.0%(+12.3)#1,084 |
| 24. | 72021 | 17.2% | 4.8%(+12.4)#24 | 5.0%(+12.2)#1,090 |
| 25. | 71860 | 16.8% | 4.8%(+12.0)#25 | 5.0%(+11.8)#1,149 |
| 26. | 72331 | 16.7% | 4.8%(+11.9)#26 | 5.0%(+11.7)#1,167 |
| 27. | 72512 | 16.5% | 4.8%(+11.7)#27 | 5.0%(+11.5)#1,196 |
| 28. | 72179 | 16.4% | 4.8%(+11.6)#28 | 5.0%(+11.4)#1,209 |
| 29. | 72342 | 15.8% | 4.8%(+11.0)#29 | 5.0%(+10.8)#1,277 |
| 30. | 72373 | 15.6% | 4.8%(+10.8)#30 | 5.0%(+10.6)#1,317 |
| 31. | 71638 | 15.3% | 4.8%(+10.5)#31 | 5.0%(+10.3)#1,361 |
| 32. | 71937 | 15.3% | 4.8%(+10.5)#32 | 5.0%(+10.3)#1,364 |
| 33. | 71642 | 15.3% | 4.8%(+10.5)#33 | 5.0%(+10.3)#1,369 |
| 34. | 72390 | 15.2% | 4.8%(+10.4)#34 | 5.0%(+10.2)#1,381 |
| 35. | 72350 | 15.0% | 4.8%(+10.2)#35 | 5.0%(+10.00)#1,439 |
| 36. | 72055 | 14.8% | 4.8%(+10.0)#36 | 5.0%(+9.80)#1,474 |
| 37. | 71962 | 14.7% | 4.8%(+9.90)#37 | 5.0%(+9.70)#1,498 |
| 38. | 72839 | 14.1% | 4.8%(+9.30)#38 | 5.0%(+9.10)#1,623 |
| 39. | 72645 | 14.0% | 4.8%(+9.20)#39 | 5.0%(+9.00)#1,644 |
| 40. | 72366 | 13.9% | 4.8%(+9.10)#40 | 5.0%(+8.90)#1,667 |
| 41. | 71866 | 13.8% | 4.8%(+9.00)#41 | 5.0%(+8.80)#1,707 |
| 42. | 72112 | 13.5% | 4.8%(+8.70)#42 | 5.0%(+8.50)#1,760 |
| 43. | 72117 | 13.3% | 4.8%(+8.50)#43 | 5.0%(+8.30)#1,821 |
| 44. | 72036 | 13.3% | 4.8%(+8.50)#44 | 5.0%(+8.30)#1,837 |
| 45. | 72394 | 13.0% | 4.8%(+8.20)#45 | 5.0%(+8.00)#1,928 |
| 46. | 72125 | 12.8% | 4.8%(+8.00)#46 | 5.0%(+7.80)#1,977 |
| 47. | 72374 | 12.8% | 4.8%(+8.00)#47 | 5.0%(+7.80)#1,981 |
| 48. | 72020 | 12.6% | 4.8%(+7.80)#48 | 5.0%(+7.60)#2,028 |
| 49. | 72084 | 12.5% | 4.8%(+7.70)#49 | 5.0%(+7.50)#2,076 |
| 50. | 72311 | 12.5% | 4.8%(+7.70)#50 | 5.0%(+7.50)#2,087 |
| 51. | 72301 | 12.4% | 4.8%(+7.60)#51 | 5.0%(+7.40)#2,092 |
| 52. | 72573 | 12.4% | 4.8%(+7.60)#52 | 5.0%(+7.40)#2,117 |
| 53. | 72471 | 12.1% | 4.8%(+7.30)#53 | 5.0%(+7.10)#2,216 |
| 54. | 72938 | 11.9% | 4.8%(+7.10)#54 | 5.0%(+6.90)#2,295 |
| 55. | 72421 | 11.9% | 4.8%(+7.10)#55 | 5.0%(+6.90)#2,297 |
| 56. | 72567 | 11.9% | 4.8%(+7.10)#56 | 5.0%(+6.90)#2,300 |
| 57. | 72051 | 11.8% | 4.8%(+7.00)#57 | 5.0%(+6.80)#2,336 |
| 58. | 72529 | 11.7% | 4.8%(+6.90)#58 | 5.0%(+6.70)#2,359 |
| 59. | 71601 | 11.3% | 4.8%(+6.50)#59 | 5.0%(+6.30)#2,526 |
| 60. | 72370 | 11.2% | 4.8%(+6.40)#60 | 5.0%(+6.20)#2,576 |
| 61. | 72467 | 11.0% | 4.8%(+6.20)#61 | 5.0%(+6.00)#2,688 |
| 62. | 72566 | 11.0% | 4.8%(+6.20)#62 | 5.0%(+6.00)#2,699 |
| 63. | 71970 | 10.9% | 4.8%(+6.10)#63 | 5.0%(+5.90)#2,751 |
| 64. | 72460 | 10.8% | 4.8%(+6.00)#64 | 5.0%(+5.80)#2,803 |
| 65. | 72841 | 10.8% | 4.8%(+6.00)#65 | 5.0%(+5.80)#2,811 |
| 66. | 71835 | 10.7% | 4.8%(+5.90)#66 | 5.0%(+5.70)#2,853 |
| 67. | 72536 | 10.7% | 4.8%(+5.90)#67 | 5.0%(+5.70)#2,862 |
| 68. | 72426 | 10.5% | 4.8%(+5.70)#68 | 5.0%(+5.50)#2,979 |
| 69. | 71676 | 10.4% | 4.8%(+5.60)#69 | 5.0%(+5.40)#3,035 |
| 70. | 72354 | 10.3% | 4.8%(+5.50)#70 | 5.0%(+5.30)#3,072 |
| 71. | 72687 | 10.2% | 4.8%(+5.40)#71 | 5.0%(+5.20)#3,114 |
| 72. | 72415 | 10.0% | 4.8%(+5.20)#72 | 5.0%(+5.00)#3,269 |
| 73. | 72010 | 9.9% | 4.8%(+5.10)#73 | 5.0%(+4.90)#3,317 |
| 74. | 72169 | 9.8% | 4.8%(+5.00)#74 | 5.0%(+4.80)#3,434 |
| 75. | 72006 | 9.7% | 4.8%(+4.90)#75 | 5.0%(+4.70)#3,478 |
| 76. | 71960 | 9.7% | 4.8%(+4.90)#76 | 5.0%(+4.70)#3,489 |
| 77. | 71846 | 9.6% | 4.8%(+4.80)#77 | 5.0%(+4.60)#3,553 |
| 78. | 72137 | 9.6% | 4.8%(+4.80)#78 | 5.0%(+4.60)#3,556 |
| 79. | 71857 | 9.5% | 4.8%(+4.70)#79 | 5.0%(+4.50)#3,616 |
| 80. | 71858 | 9.5% | 4.8%(+4.70)#80 | 5.0%(+4.50)#3,638 |
| 81. | 71845 | 9.5% | 4.8%(+4.70)#81 | 5.0%(+4.50)#3,639 |
| 82. | 71639 | 9.4% | 4.8%(+4.60)#82 | 5.0%(+4.40)#3,689 |
| 83. | 72157 | 9.4% | 4.8%(+4.60)#83 | 5.0%(+4.40)#3,706 |
| 84. | 72630 | 9.4% | 4.8%(+4.60)#84 | 5.0%(+4.40)#3,731 |
| 85. | 72324 | 9.3% | 4.8%(+4.50)#85 | 5.0%(+4.30)#3,781 |
| 86. | 72029 | 9.2% | 4.8%(+4.40)#86 | 5.0%(+4.20)#3,856 |
| 87. | 72926 | 9.2% | 4.8%(+4.40)#87 | 5.0%(+4.20)#3,877 |
| 88. | 72080 | 9.2% | 4.8%(+4.40)#88 | 5.0%(+4.20)#3,885 |
| 89. | 72428 | 9.2% | 4.8%(+4.40)#89 | 5.0%(+4.20)#3,889 |
| 90. | 72127 | 9.1% | 4.8%(+4.30)#90 | 5.0%(+4.10)#3,947 |
| 91. | 72901 | 9.0% | 4.8%(+4.20)#91 | 5.0%(+4.00)#3,984 |
| 92. | 72677 | 9.0% | 4.8%(+4.20)#92 | 5.0%(+4.00)#4,039 |
| 93. | 71631 | 9.0% | 4.8%(+4.20)#93 | 5.0%(+4.00)#4,041 |
| 94. | 72462 | 9.0% | 4.8%(+4.20)#94 | 5.0%(+4.00)#4,045 |
| 95. | 71822 | 8.9% | 4.8%(+4.10)#95 | 5.0%(+3.90)#4,087 |
| 96. | 71825 | 8.9% | 4.8%(+4.10)#96 | 5.0%(+3.90)#4,129 |
| 97. | 72063 | 8.8% | 4.8%(+4.00)#97 | 5.0%(+3.80)#4,214 |
| 98. | 71935 | 8.8% | 4.8%(+4.00)#98 | 5.0%(+3.80)#4,242 |
| 99. | 72470 | 8.8% | 4.8%(+4.00)#99 | 5.0%(+3.80)#4,253 |
| 100. | 72315 | 8.7% | 4.8%(+3.90)#100 | 5.0%(+3.70)#4,268 |
Common Questions
What are the Top 10 Zip Codes with the Highest Unemployment Rate in Arkansas?
Top 10 Zip Codes with the Highest Unemployment Rate in Arkansas are:
What zip code has the Highest Unemployment Rate in Arkansas?
72338 has the Highest Unemployment Rate in Arkansas with 100.0%.
What is the Unemployment Rate in the State of Arkansas?
Unemployment Rate in Arkansas is 4.8%.
What is the Unemployment Rate in the United States?
Unemployment Rate in the United States is 5.0%.