Warren, AR
Warren Map
Warren Overview
5,409
TOTAL POPULATION
2,681
MALE POPULATION
2,728
FEMALE POPULATION
98.28
MALES / 100 FEMALES
101.75
FEMALES / 100 MALES
38.0
MEDIAN AGE
4.2
AVG FAMILY SIZE
2.9
AVG HOUSEHOLD SIZE
$21,120
PER CAPITA INCOME
$48,125
AVG FAMILY INCOME
$39,222
AVG HOUSEHOLD INCOME
38.4%
WAGE / INCOME GAP [ % ]
61.6¢/ $1
WAGE / INCOME GAP [ $ ]
$8,289
FAMILY INCOME DEFICIT
0.47
INEQUALITY / GINI INDEX
2,087
LABOR FORCE [ PEOPLE ]
51.3%
PERCENT IN LABOR FORCE
4.4%
UNEMPLOYMENT RATE
Warren Zip Codes
Warren Area Codes
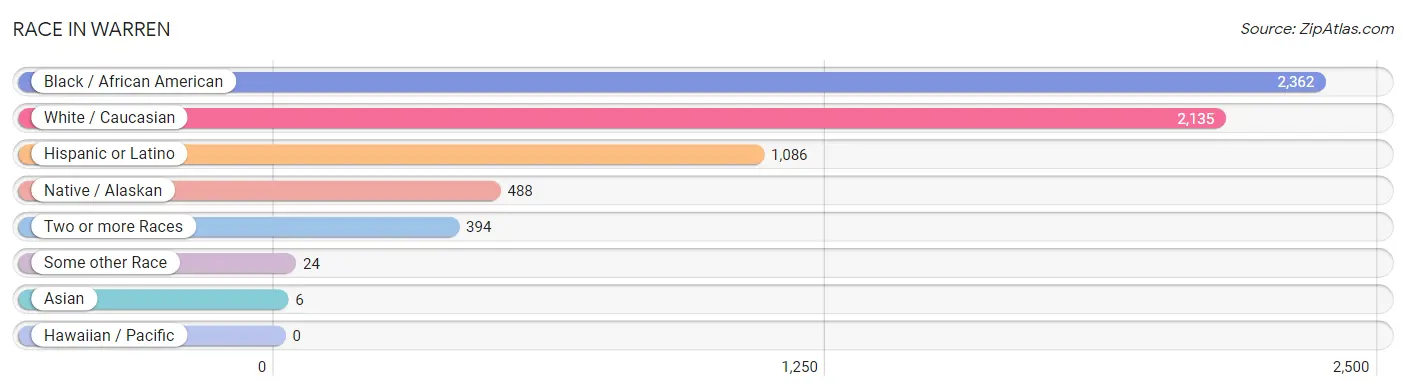
Race in Warren
The most populous races in Warren are Black / African American (2,362 | 43.7%), White / Caucasian (2,135 | 39.5%), and Hispanic or Latino (1,086 | 20.1%).
| Race | # Population | % Population |
| Asian | 6 | 0.1% |
| Black / African American | 2,362 | 43.7% |
| Hawaiian / Pacific | 0 | 0.0% |
| Hispanic or Latino | 1,086 | 20.1% |
| Native / Alaskan | 488 | 9.0% |
| White / Caucasian | 2,135 | 39.5% |
| Two or more Races | 394 | 7.3% |
| Some other Race | 24 | 0.4% |
| Total | 5,409 | 100.0% |
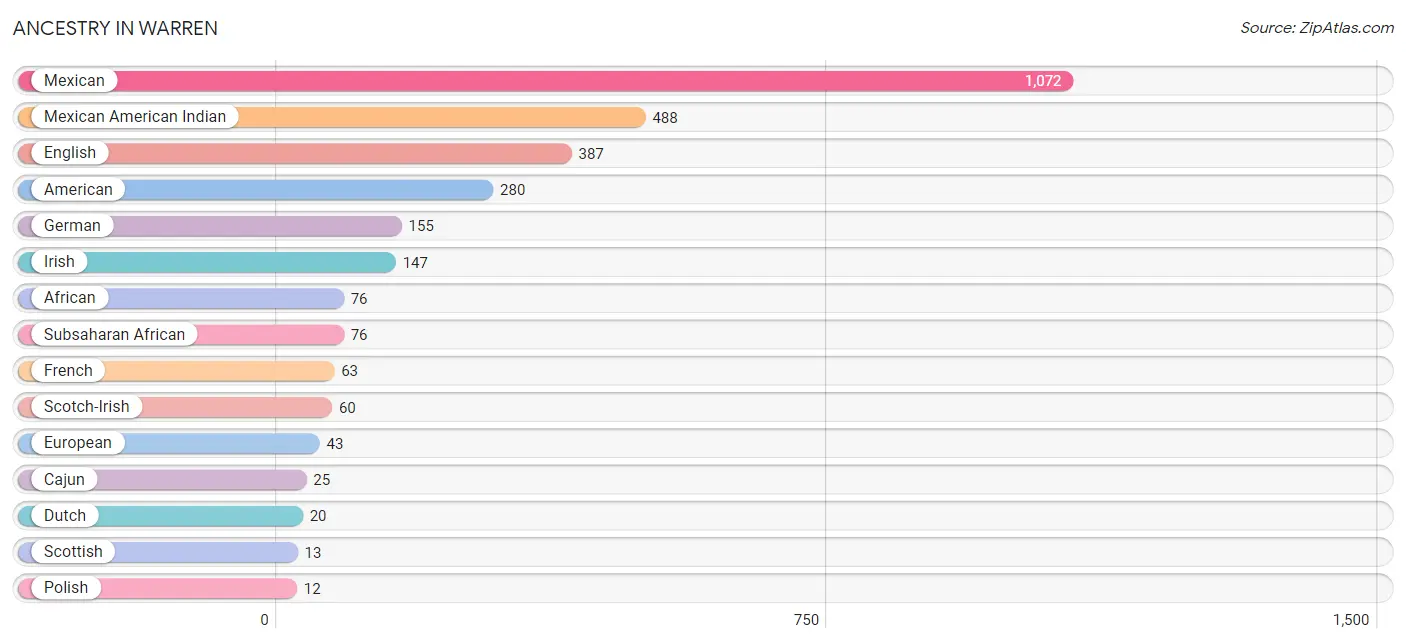
Ancestry in Warren
The most populous ancestries reported in Warren are Mexican (1,072 | 19.8%), Mexican American Indian (488 | 9.0%), English (387 | 7.1%), American (280 | 5.2%), and German (155 | 2.9%), together accounting for 44.0% of all Warren residents.
| Ancestry | # Population | % Population |
| African | 76 | 1.4% |
| American | 280 | 5.2% |
| Bhutanese | 6 | 0.1% |
| Cajun | 25 | 0.5% |
| Celtic | 4 | 0.1% |
| Dutch | 20 | 0.4% |
| English | 387 | 7.1% |
| European | 43 | 0.8% |
| French | 63 | 1.2% |
| French Canadian | 5 | 0.1% |
| German | 155 | 2.9% |
| Irish | 147 | 2.7% |
| Mexican | 1,072 | 19.8% |
| Mexican American Indian | 488 | 9.0% |
| Pakistani | 10 | 0.2% |
| Polish | 12 | 0.2% |
| Scotch-Irish | 60 | 1.1% |
| Scottish | 13 | 0.2% |
| Subsaharan African | 76 | 1.4% |
| Swedish | 3 | 0.1% | View All 20 Rows |
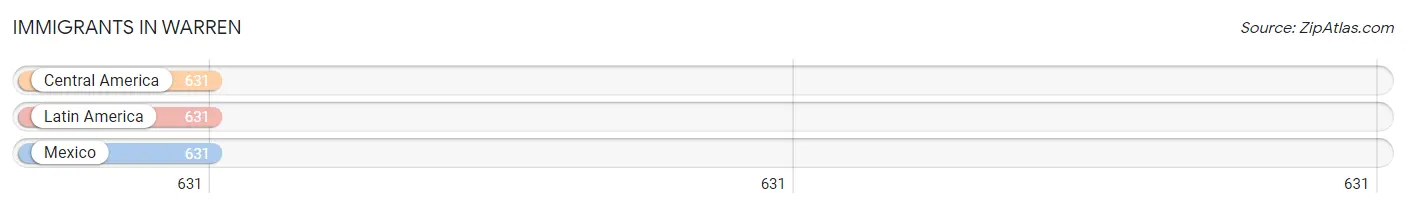
Immigrants in Warren
The most numerous immigrant groups reported in Warren came from Central America (631 | 11.7%), Latin America (631 | 11.7%), and Mexico (631 | 11.7%), together accounting for 35.0% of all Warren residents.
| Immigration Origin | # Population | % Population |
| Central America | 631 | 11.7% |
| Latin America | 631 | 11.7% |
| Mexico | 631 | 11.7% | View All 3 Rows |
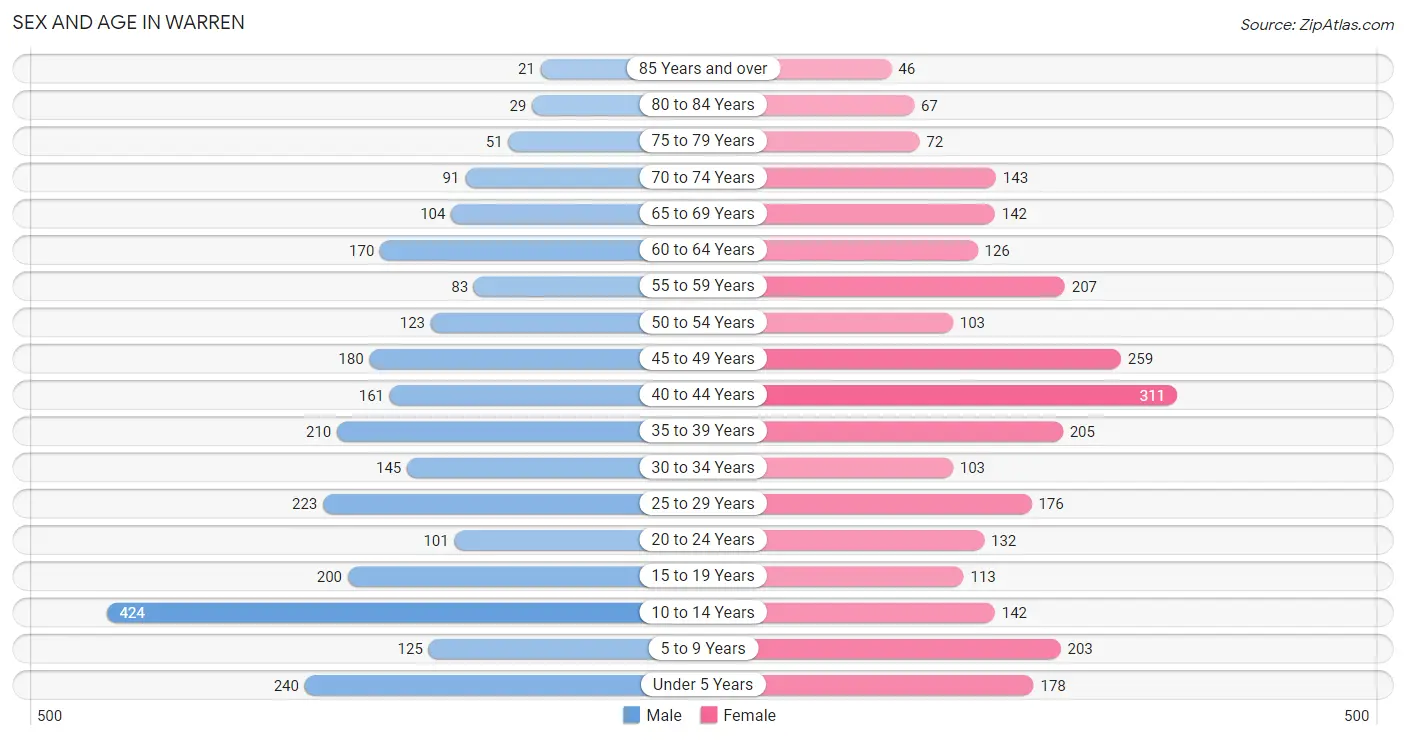
Sex and Age in Warren
Sex and Age in Warren
The most populous age groups in Warren are 10 to 14 Years (424 | 15.8%) for men and 40 to 44 Years (311 | 11.4%) for women.
| Age Bracket | Male | Female |
| Under 5 Years | 240 (8.9%) | 178 (6.5%) |
| 5 to 9 Years | 125 (4.7%) | 203 (7.4%) |
| 10 to 14 Years | 424 (15.8%) | 142 (5.2%) |
| 15 to 19 Years | 200 (7.5%) | 113 (4.1%) |
| 20 to 24 Years | 101 (3.8%) | 132 (4.8%) |
| 25 to 29 Years | 223 (8.3%) | 176 (6.5%) |
| 30 to 34 Years | 145 (5.4%) | 103 (3.8%) |
| 35 to 39 Years | 210 (7.8%) | 205 (7.5%) |
| 40 to 44 Years | 161 (6.0%) | 311 (11.4%) |
| 45 to 49 Years | 180 (6.7%) | 259 (9.5%) |
| 50 to 54 Years | 123 (4.6%) | 103 (3.8%) |
| 55 to 59 Years | 83 (3.1%) | 207 (7.6%) |
| 60 to 64 Years | 170 (6.3%) | 126 (4.6%) |
| 65 to 69 Years | 104 (3.9%) | 142 (5.2%) |
| 70 to 74 Years | 91 (3.4%) | 143 (5.2%) |
| 75 to 79 Years | 51 (1.9%) | 72 (2.6%) |
| 80 to 84 Years | 29 (1.1%) | 67 (2.5%) |
| 85 Years and over | 21 (0.8%) | 46 (1.7%) |
| Total | 2,681 (100.0%) | 2,728 (100.0%) |
Families and Households in Warren
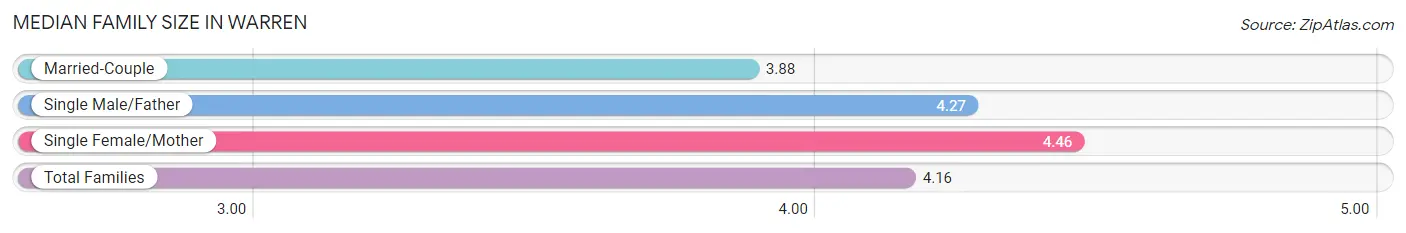
Median Family Size in Warren
The median family size in Warren is 4.16 persons per family, with single female/mother families (456 | 44.1%) accounting for the largest median family size of 4.46 persons per family. On the other hand, married-couple families (515 | 49.8%) represent the smallest median family size with 3.88 persons per family.
| Family Type | # Families | Family Size |
| Married-Couple | 515 (49.8%) | 3.88 |
| Single Male/Father | 64 (6.2%) | 4.27 |
| Single Female/Mother | 456 (44.1%) | 4.46 |
| Total Families | 1,035 (100.0%) | 4.16 |
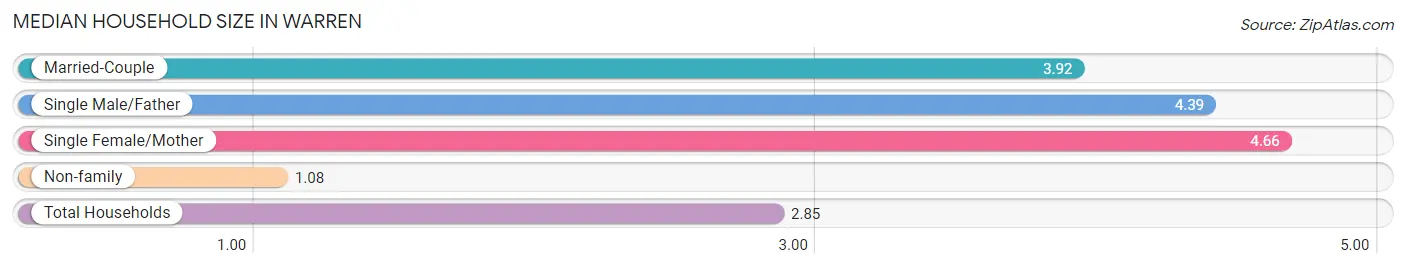
Median Household Size in Warren
The median household size in Warren is 2.85 persons per household, with single female/mother households (456 | 24.5%) accounting for the largest median household size of 4.66 persons per household. non-family households (827 | 44.4%) represent the smallest median household size with 1.08 persons per household.
| Household Type | # Households | Household Size |
| Married-Couple | 515 (27.7%) | 3.92 |
| Single Male/Father | 64 (3.4%) | 4.39 |
| Single Female/Mother | 456 (24.5%) | 4.66 |
| Non-family | 827 (44.4%) | 1.08 |
| Total Households | 1,862 (100.0%) | 2.85 |
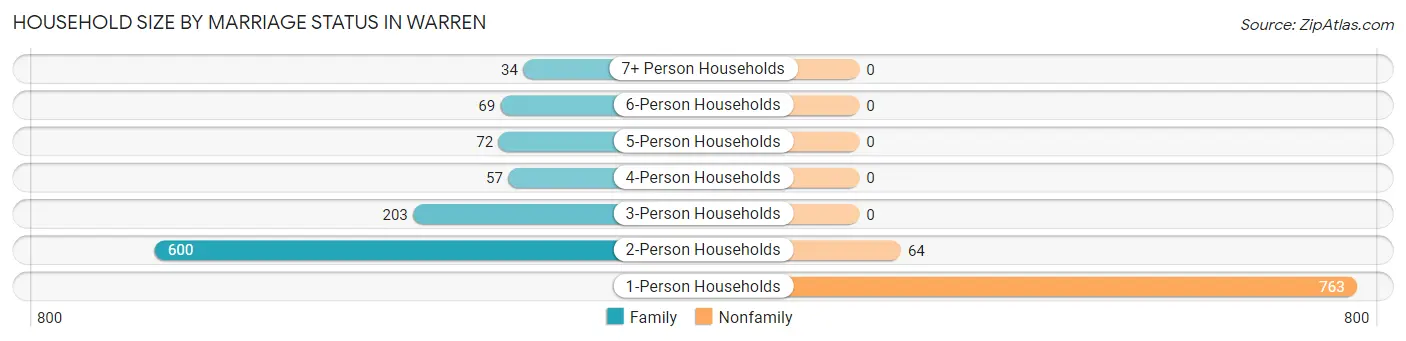
Household Size by Marriage Status in Warren
Out of a total of 1,862 households in Warren, 1,035 (55.6%) are family households, while 827 (44.4%) are nonfamily households. The most numerous type of family households are 2-person households, comprising 600, and the most common type of nonfamily households are 1-person households, comprising 763.
| Household Size | Family Households | Nonfamily Households |
| 1-Person Households | - | 763 (41.0%) |
| 2-Person Households | 600 (32.2%) | 64 (3.4%) |
| 3-Person Households | 203 (10.9%) | 0 (0.0%) |
| 4-Person Households | 57 (3.1%) | 0 (0.0%) |
| 5-Person Households | 72 (3.9%) | 0 (0.0%) |
| 6-Person Households | 69 (3.7%) | 0 (0.0%) |
| 7+ Person Households | 34 (1.8%) | 0 (0.0%) |
| Total | 1,035 (55.6%) | 827 (44.4%) |
Female Fertility in Warren
Fertility by Age in Warren
Average fertility rate in Warren is 54.0 births per 1,000 women. Women in the age bracket of 15 to 19 years have the highest fertility rate with 159.0 births per 1,000 women. Women in the age bracket of 20 to 34 years acount for 67.1% of all women with births.
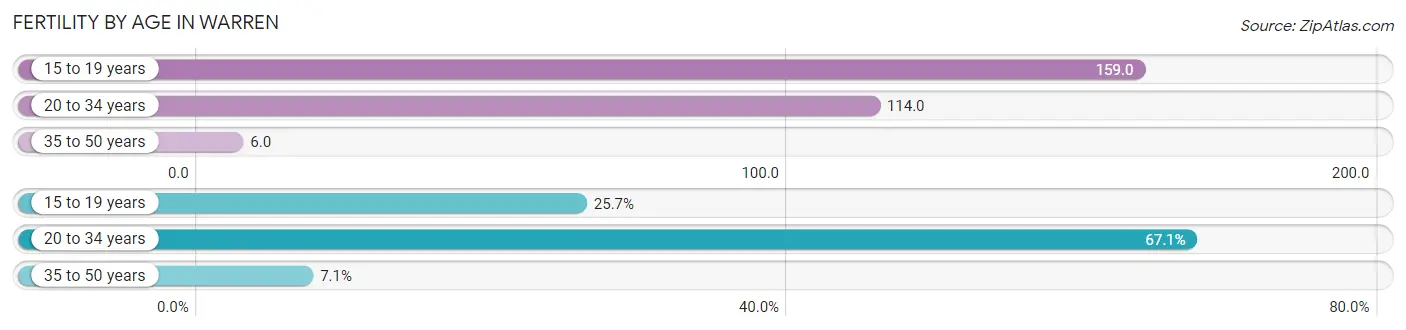
| Age Bracket | Women with Births | Births / 1,000 Women |
| 15 to 19 years | 18 (25.7%) | 159.0 |
| 20 to 34 years | 47 (67.1%) | 114.0 |
| 35 to 50 years | 5 (7.1%) | 6.0 |
| Total | 70 (100.0%) | 54.0 |
Fertility by Age by Marriage Status in Warren
7.1% of women with births (70) in Warren are married. The highest percentage of unmarried women with births falls into 15 to 19 years age bracket with 100.0% of them unmarried at the time of birth, while the lowest percentage of unmarried women with births belong to 35 to 50 years age bracket with 0.0% of them unmarried.
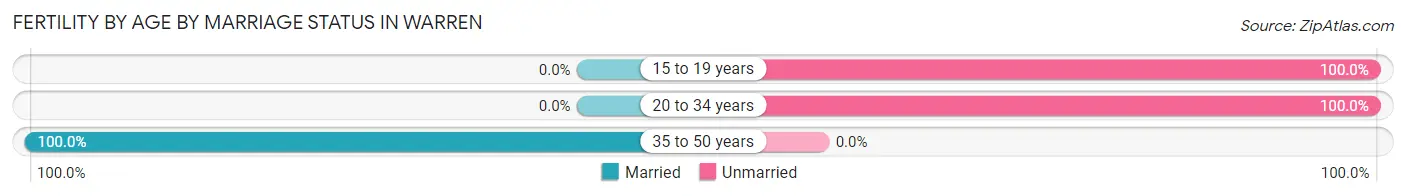
| Age Bracket | Married | Unmarried |
| 15 to 19 years | 0 (0.0%) | 18 (100.0%) |
| 20 to 34 years | 0 (0.0%) | 47 (100.0%) |
| 35 to 50 years | 5 (100.0%) | 0 (0.0%) |
| Total | 5 (7.1%) | 65 (92.9%) |
Fertility by Education in Warren
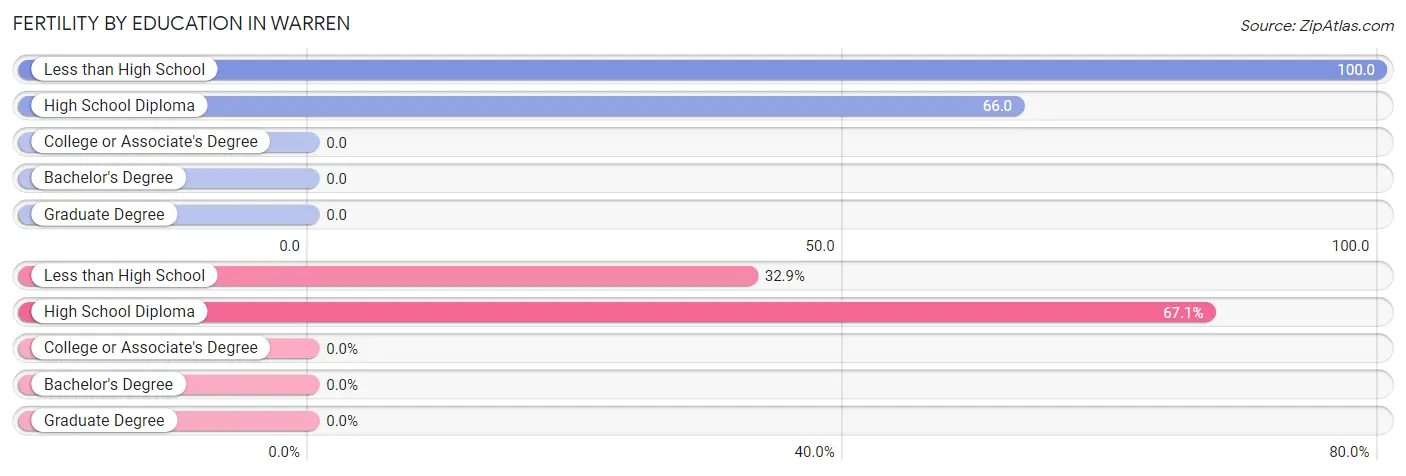
| Educational Attainment | Women with Births | Births / 1,000 Women |
| Less than High School | 23 (32.9%) | 100.0 |
| High School Diploma | 47 (67.1%) | 66.0 |
| College or Associate's Degree | 0 (0.0%) | 0.0 |
| Bachelor's Degree | 0 (0.0%) | 0.0 |
| Graduate Degree | 0 (0.0%) | 0.0 |
| Total | 70 (100.0%) | 54.0 |
Fertility by Education by Marriage Status in Warren
92.9% of women with births in Warren are unmarried. Women with the educational attainment of less than high school are most likely to be married with 21.7% of them married at childbirth, while women with the educational attainment of high school diploma are least likely to be married with 100.0% of them unmarried at childbirth.
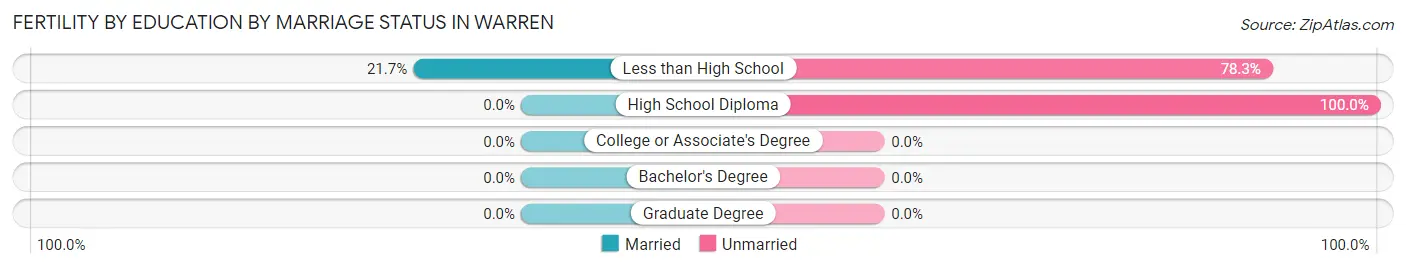
| Educational Attainment | Married | Unmarried |
| Less than High School | 5 (21.7%) | 18 (78.3%) |
| High School Diploma | 0 (0.0%) | 47 (100.0%) |
| College or Associate's Degree | 0 (0.0%) | 0 (0.0%) |
| Bachelor's Degree | 0 (0.0%) | 0 (0.0%) |
| Graduate Degree | 0 (0.0%) | 0 (0.0%) |
| Total | 5 (7.1%) | 65 (92.9%) |
Income in Warren
Income Overview in Warren
Per Capita Income in Warren is $21,120, while median incomes of families and households are $48,125 and $39,222 respectively.
| Characteristic | Number | Measure |
| Per Capita Income | 5,409 | $21,120 |
| Median Family Income | 1,035 | $48,125 |
| Mean Family Income | 1,035 | $60,657 |
| Median Household Income | 1,862 | $39,222 |
| Mean Household Income | 1,862 | $49,233 |
| Income Deficit | 1,035 | $8,289 |
| Wage / Income Gap (%) | 5,409 | 38.44% |
| Wage / Income Gap ($) | 5,409 | 61.56¢ per $1 |
| Gini / Inequality Index | 5,409 | 0.47 |
Earnings by Sex in Warren
Average Earnings in Warren are $35,875, $43,750 for men and $26,933 for women, a difference of 38.4%.
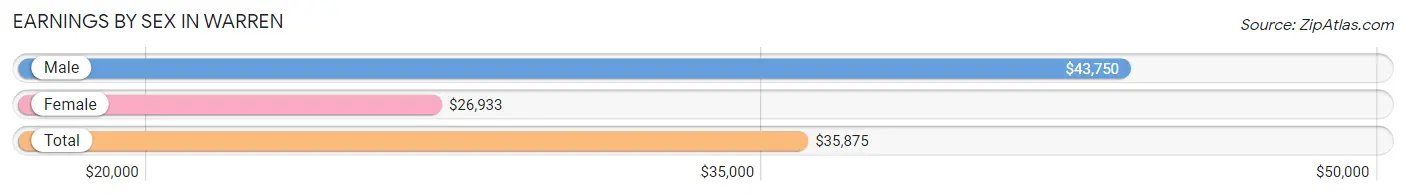
| Sex | Number | Average Earnings |
| Male | 1,055 (49.0%) | $43,750 |
| Female | 1,098 (51.0%) | $26,933 |
| Total | 2,153 (100.0%) | $35,875 |
Earnings by Sex by Income Bracket in Warren
The most common earnings brackets in Warren are $55,000 to $64,999 for men (175 | 16.6%) and $25,000 to $29,999 for women (271 | 24.7%).

| Income | Male | Female |
| $2,499 or less | 4 (0.4%) | 60 (5.5%) |
| $2,500 to $4,999 | 19 (1.8%) | 18 (1.6%) |
| $5,000 to $7,499 | 30 (2.8%) | 34 (3.1%) |
| $7,500 to $9,999 | 6 (0.6%) | 68 (6.2%) |
| $10,000 to $12,499 | 74 (7.0%) | 21 (1.9%) |
| $12,500 to $14,999 | 10 (0.9%) | 0 (0.0%) |
| $15,000 to $17,499 | 0 (0.0%) | 24 (2.2%) |
| $17,500 to $19,999 | 0 (0.0%) | 55 (5.0%) |
| $20,000 to $22,499 | 19 (1.8%) | 38 (3.5%) |
| $22,500 to $24,999 | 89 (8.4%) | 40 (3.6%) |
| $25,000 to $29,999 | 31 (2.9%) | 271 (24.7%) |
| $30,000 to $34,999 | 63 (6.0%) | 78 (7.1%) |
| $35,000 to $39,999 | 33 (3.1%) | 65 (5.9%) |
| $40,000 to $44,999 | 164 (15.5%) | 111 (10.1%) |
| $45,000 to $49,999 | 102 (9.7%) | 73 (6.7%) |
| $50,000 to $54,999 | 6 (0.6%) | 6 (0.5%) |
| $55,000 to $64,999 | 175 (16.6%) | 10 (0.9%) |
| $65,000 to $74,999 | 110 (10.4%) | 11 (1.0%) |
| $75,000 to $99,999 | 59 (5.6%) | 91 (8.3%) |
| $100,000+ | 61 (5.8%) | 24 (2.2%) |
| Total | 1,055 (100.0%) | 1,098 (100.0%) |
Earnings by Sex by Educational Attainment in Warren
Average earnings in Warren are $47,971 for men and $27,475 for women, a difference of 42.7%. Men with an educational attainment of college or associate's degree enjoy the highest average annual earnings of $67,791, while those with less than high school education earn the least with $31,125. Women with an educational attainment of bachelor's degree earn the most with the average annual earnings of $39,948, while those with less than high school education have the smallest earnings of $25,650.
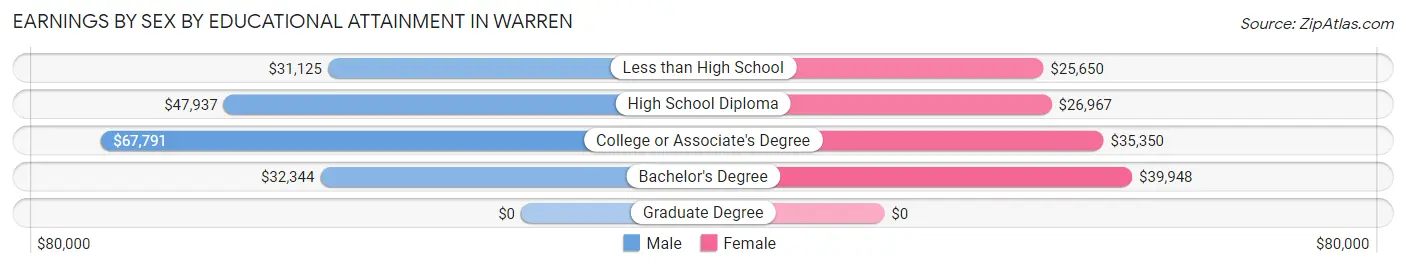
| Educational Attainment | Male Income | Female Income |
| Less than High School | $31,125 | $25,650 |
| High School Diploma | $47,937 | $26,967 |
| College or Associate's Degree | $67,791 | $35,350 |
| Bachelor's Degree | $32,344 | $39,948 |
| Graduate Degree | - | - |
| Total | $47,971 | $27,475 |
Family Income in Warren
Family Income Brackets in Warren
According to the Warren family income data, there are 283 families falling into the $50,000 to $74,999 income range, which is the most common income bracket and makes up 27.3% of all families. Conversely, the $200,000+ income bracket is the least frequent group with only 25 families (2.4%) belonging to this category.
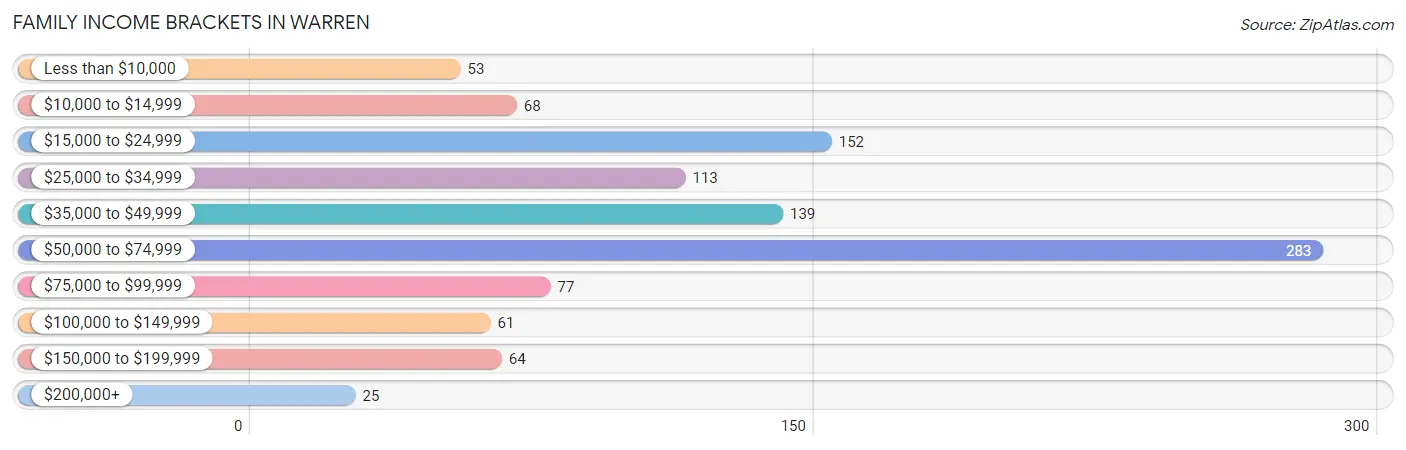
| Income Bracket | # Families | % Families |
| Less than $10,000 | 53 | 5.1% |
| $10,000 to $14,999 | 68 | 6.6% |
| $15,000 to $24,999 | 152 | 14.7% |
| $25,000 to $34,999 | 113 | 10.9% |
| $35,000 to $49,999 | 139 | 13.4% |
| $50,000 to $74,999 | 283 | 27.3% |
| $75,000 to $99,999 | 77 | 7.4% |
| $100,000 to $149,999 | 61 | 5.9% |
| $150,000 to $199,999 | 64 | 6.2% |
| $200,000+ | 25 | 2.4% |
Family Income by Famaliy Size in Warren
3-person families (176 | 17.0%) account for the highest median family income in Warren with $50,000 per family, while 2-person families (640 | 61.8%) have the highest median income of $22,250 per family member.
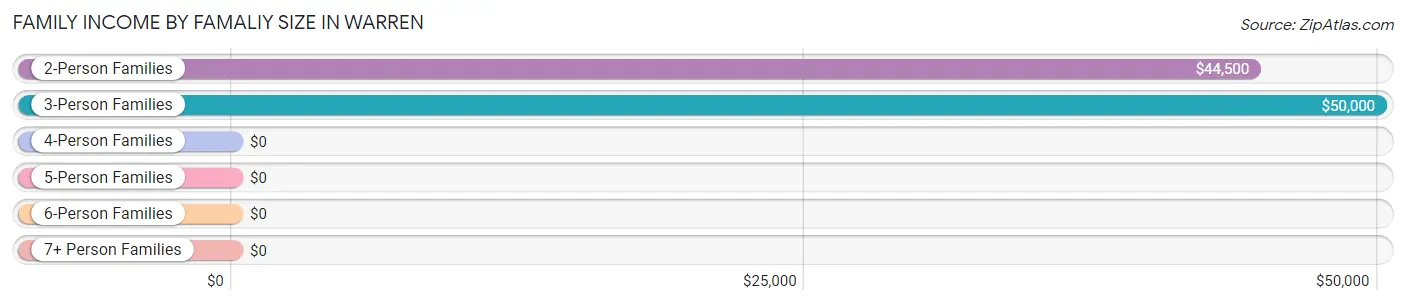
| Income Bracket | # Families | Median Income |
| 2-Person Families | 640 (61.8%) | $44,500 |
| 3-Person Families | 176 (17.0%) | $50,000 |
| 4-Person Families | 53 (5.1%) | $0 |
| 5-Person Families | 73 (7.0%) | $0 |
| 6-Person Families | 59 (5.7%) | $0 |
| 7+ Person Families | 34 (3.3%) | $0 |
| Total | 1,035 (100.0%) | $48,125 |
Family Income by Number of Earners in Warren
The median family income in Warren is $48,125, with families comprising 3+ earners (103) having the highest median family income of $121,771, while families with no earners (255) have the lowest median family income of $25,938, accounting for 10.0% and 24.6% of families, respectively.
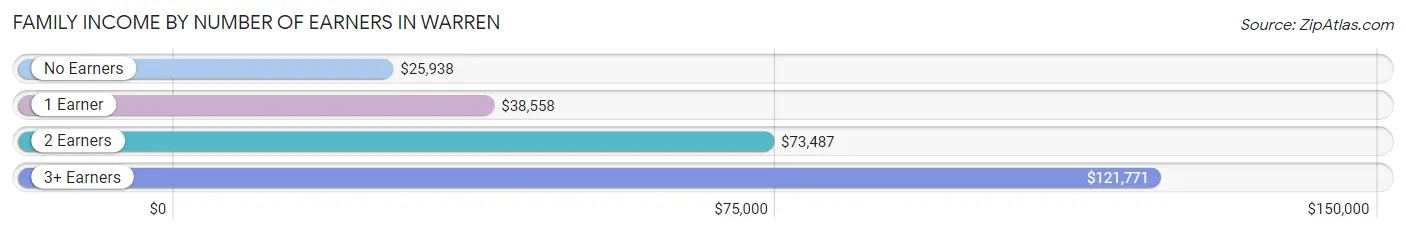
| Number of Earners | # Families | Median Income |
| No Earners | 255 (24.6%) | $25,938 |
| 1 Earner | 470 (45.4%) | $38,558 |
| 2 Earners | 207 (20.0%) | $73,487 |
| 3+ Earners | 103 (10.0%) | $121,771 |
| Total | 1,035 (100.0%) | $48,125 |
Household Income in Warren
Household Income Brackets in Warren
With 320 households falling in the category, the $50,000 to $74,999 income range is the most frequent in Warren, accounting for 17.2% of all households. In contrast, only 24 households (1.3%) fall into the $200,000+ income bracket, making it the least populous group.
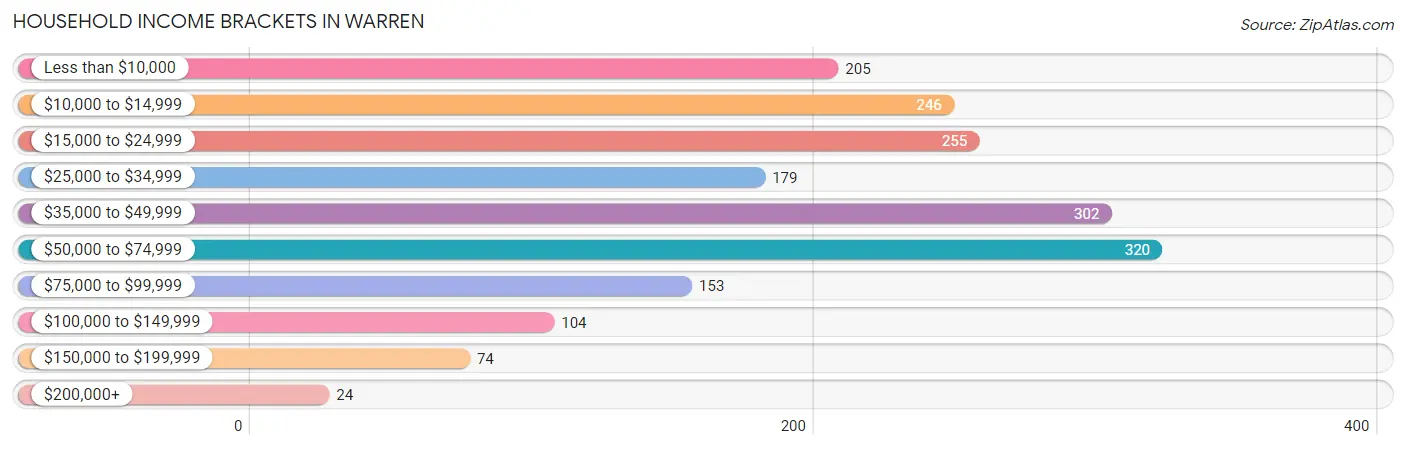
| Income Bracket | # Households | % Households |
| Less than $10,000 | 205 | 11.0% |
| $10,000 to $14,999 | 246 | 13.2% |
| $15,000 to $24,999 | 255 | 13.7% |
| $25,000 to $34,999 | 179 | 9.6% |
| $35,000 to $49,999 | 302 | 16.2% |
| $50,000 to $74,999 | 320 | 17.2% |
| $75,000 to $99,999 | 153 | 8.2% |
| $100,000 to $149,999 | 104 | 5.6% |
| $150,000 to $199,999 | 74 | 4.0% |
| $200,000+ | 24 | 1.3% |
Household Income by Householder Age in Warren
The median household income in Warren is $39,222, with the highest median household income of $48,500 found in the 25 to 44 years age bracket for the primary householder. A total of 556 households (29.9%) fall into this category. Meanwhile, the 15 to 24 years age bracket for the primary householder has the lowest median household income of $0, with 47 households (2.5%) in this group.
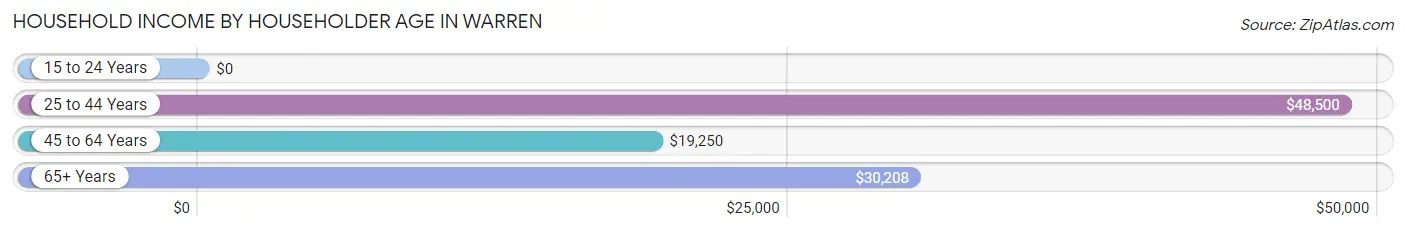
| Income Bracket | # Households | Median Income |
| 15 to 24 Years | 47 (2.5%) | $0 |
| 25 to 44 Years | 556 (29.9%) | $48,500 |
| 45 to 64 Years | 695 (37.3%) | $19,250 |
| 65+ Years | 564 (30.3%) | $30,208 |
| Total | 1,862 (100.0%) | $39,222 |
Poverty in Warren
Income Below Poverty by Sex and Age in Warren
With 15.0% poverty level for males and 27.4% for females among the residents of Warren, 5 year old males and 5 year old females are the most vulnerable to poverty, with 29 males (67.4%) and 12 females (57.1%) in their respective age groups living below the poverty level.
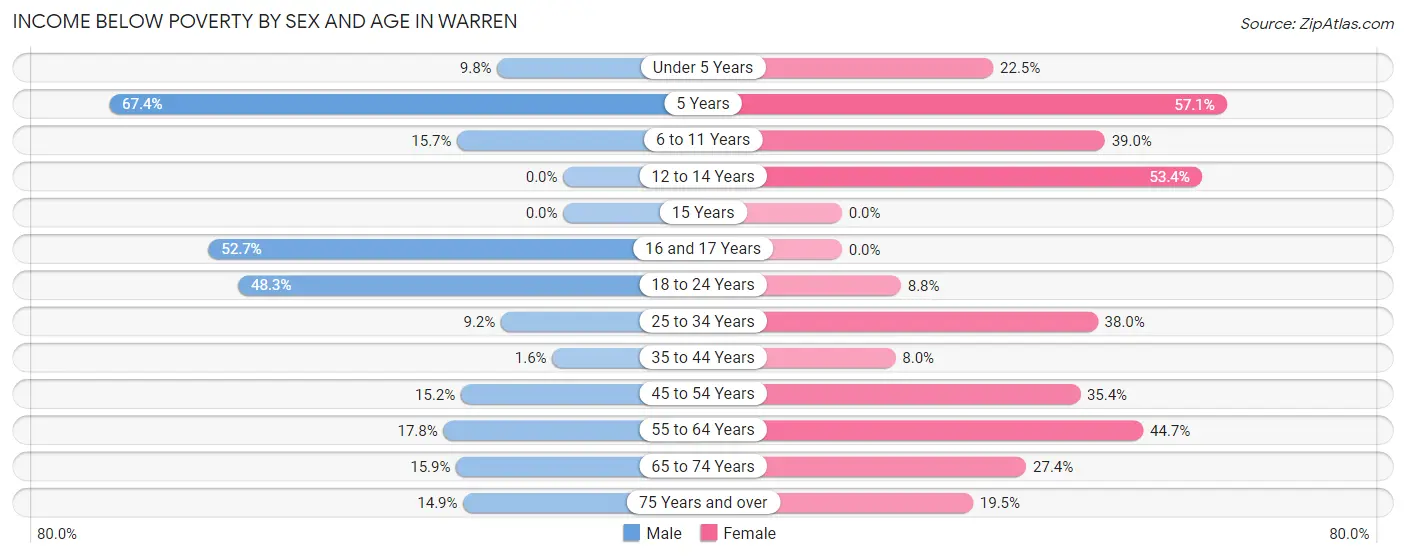
| Age Bracket | Male | Female |
| Under 5 Years | 23 (9.8%) | 40 (22.5%) |
| 5 Years | 29 (67.4%) | 12 (57.1%) |
| 6 to 11 Years | 34 (15.7%) | 98 (39.0%) |
| 12 to 14 Years | 0 (0.0%) | 39 (53.4%) |
| 15 Years | 0 (0.0%) | 0 (0.0%) |
| 16 and 17 Years | 39 (52.7%) | 0 (0.0%) |
| 18 to 24 Years | 99 (48.3%) | 19 (8.8%) |
| 25 to 34 Years | 34 (9.2%) | 106 (38.0%) |
| 35 to 44 Years | 6 (1.6%) | 41 (8.0%) |
| 45 to 54 Years | 46 (15.2%) | 128 (35.4%) |
| 55 to 64 Years | 45 (17.8%) | 149 (44.7%) |
| 65 to 74 Years | 31 (15.9%) | 78 (27.4%) |
| 75 Years and over | 15 (14.8%) | 36 (19.5%) |
| Total | 401 (15.0%) | 746 (27.4%) |
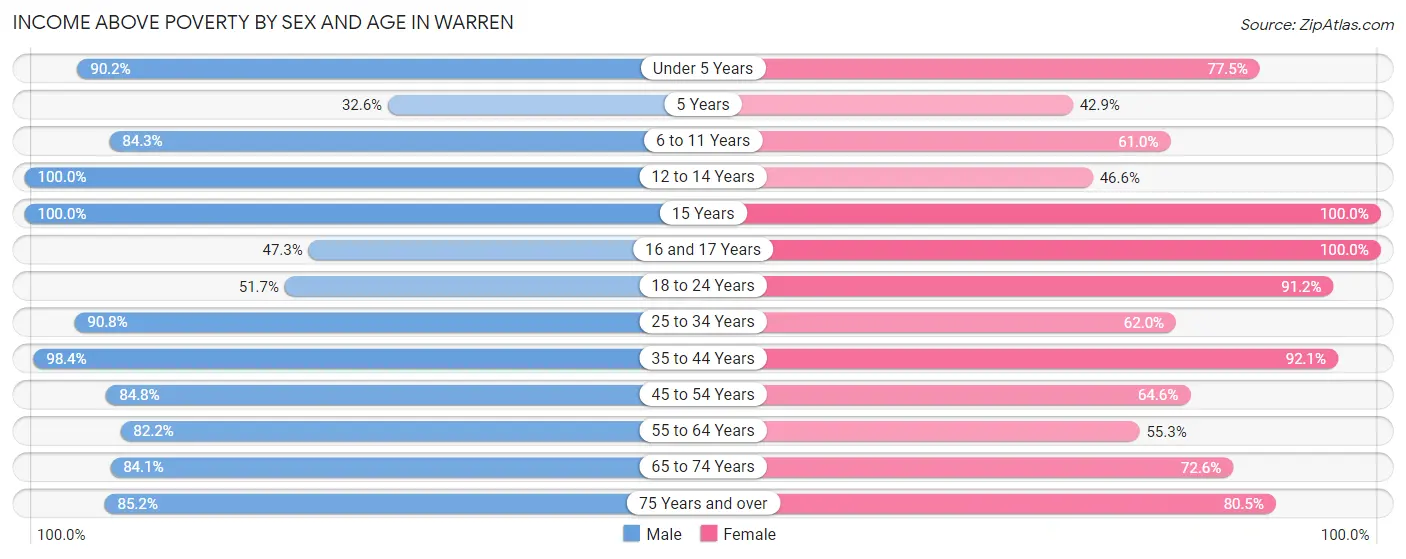
Income Above Poverty by Sex and Age in Warren
According to the poverty statistics in Warren, males aged 12 to 14 years and females aged 15 years are the age groups that are most secure financially, with 100.0% of males and 100.0% of females in these age groups living above the poverty line.
| Age Bracket | Male | Female |
| Under 5 Years | 212 (90.2%) | 138 (77.5%) |
| 5 Years | 14 (32.6%) | 9 (42.9%) |
| 6 to 11 Years | 182 (84.3%) | 153 (61.0%) |
| 12 to 14 Years | 290 (100.0%) | 34 (46.6%) |
| 15 Years | 22 (100.0%) | 6 (100.0%) |
| 16 and 17 Years | 35 (47.3%) | 22 (100.0%) |
| 18 to 24 Years | 106 (51.7%) | 198 (91.2%) |
| 25 to 34 Years | 334 (90.8%) | 173 (62.0%) |
| 35 to 44 Years | 365 (98.4%) | 475 (92.0%) |
| 45 to 54 Years | 257 (84.8%) | 234 (64.6%) |
| 55 to 64 Years | 208 (82.2%) | 184 (55.3%) |
| 65 to 74 Years | 164 (84.1%) | 207 (72.6%) |
| 75 Years and over | 86 (85.2%) | 149 (80.5%) |
| Total | 2,275 (85.0%) | 1,982 (72.7%) |
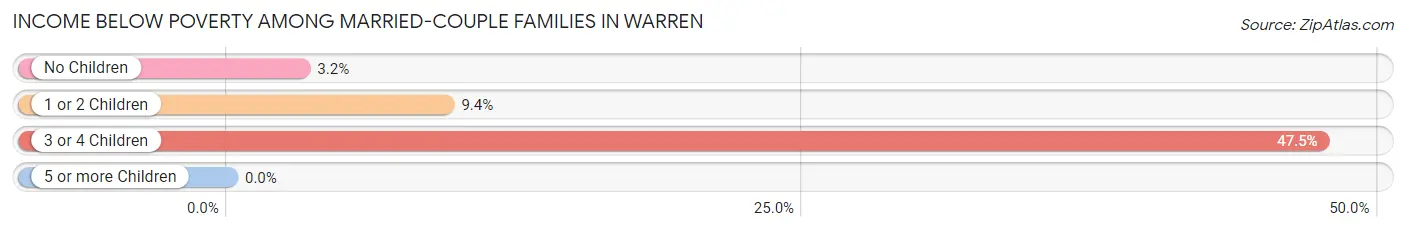
Income Below Poverty Among Married-Couple Families in Warren
The poverty statistics for married-couple families in Warren show that 8.2% or 42 of the total 515 families live below the poverty line. Families with 3 or 4 children have the highest poverty rate of 47.5%, comprising of 19 families. On the other hand, families with 5 or more children have the lowest poverty rate of 0.0%, which includes 0 families.
| Children | Above Poverty | Below Poverty |
| No Children | 307 (96.9%) | 10 (3.2%) |
| 1 or 2 Children | 125 (90.6%) | 13 (9.4%) |
| 3 or 4 Children | 21 (52.5%) | 19 (47.5%) |
| 5 or more Children | 20 (100.0%) | 0 (0.0%) |
| Total | 473 (91.8%) | 42 (8.2%) |
Income Below Poverty Among Single-Parent Households in Warren
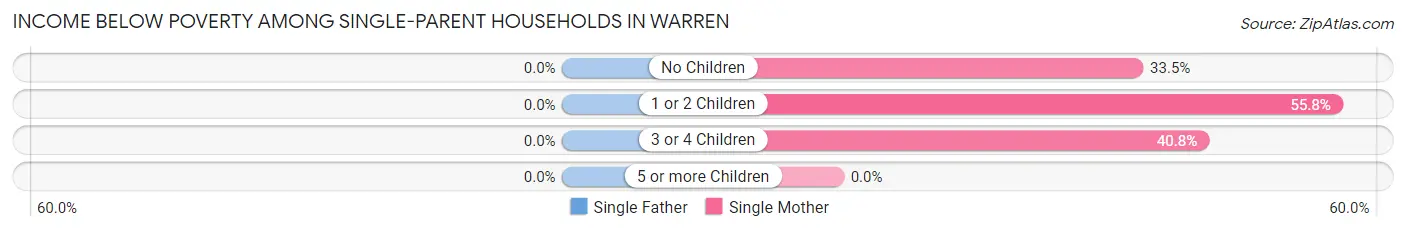
| Children | Single Father | Single Mother |
| No Children | 0 (0.0%) | 81 (33.5%) |
| 1 or 2 Children | 0 (0.0%) | 92 (55.8%) |
| 3 or 4 Children | 0 (0.0%) | 20 (40.8%) |
| 5 or more Children | 0 (0.0%) | 0 (0.0%) |
| Total | 0 (0.0%) | 193 (42.3%) |
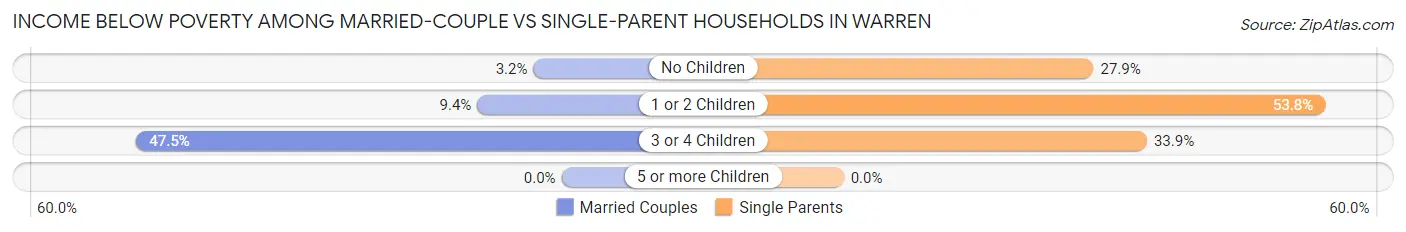
Income Below Poverty Among Married-Couple vs Single-Parent Households in Warren
The poverty data for Warren shows that 42 of the married-couple family households (8.2%) and 193 of the single-parent households (37.1%) are living below the poverty level. Within the married-couple family households, those with 3 or 4 children have the highest poverty rate, with 19 households (47.5%) falling below the poverty line. Among the single-parent households, those with 1 or 2 children have the highest poverty rate, with 92 household (53.8%) living below poverty.
| Children | Married-Couple Families | Single-Parent Households |
| No Children | 10 (3.2%) | 81 (27.9%) |
| 1 or 2 Children | 13 (9.4%) | 92 (53.8%) |
| 3 or 4 Children | 19 (47.5%) | 20 (33.9%) |
| 5 or more Children | 0 (0.0%) | 0 (0.0%) |
| Total | 42 (8.2%) | 193 (37.1%) |
Employment Characteristics in Warren
Employment by Class of Employer in Warren
Among the 1,952 employed individuals in Warren, private company employees (1,382 | 70.8%), state government employees (247 | 12.7%), and local government employees (177 | 9.1%) make up the most common classes of employment.
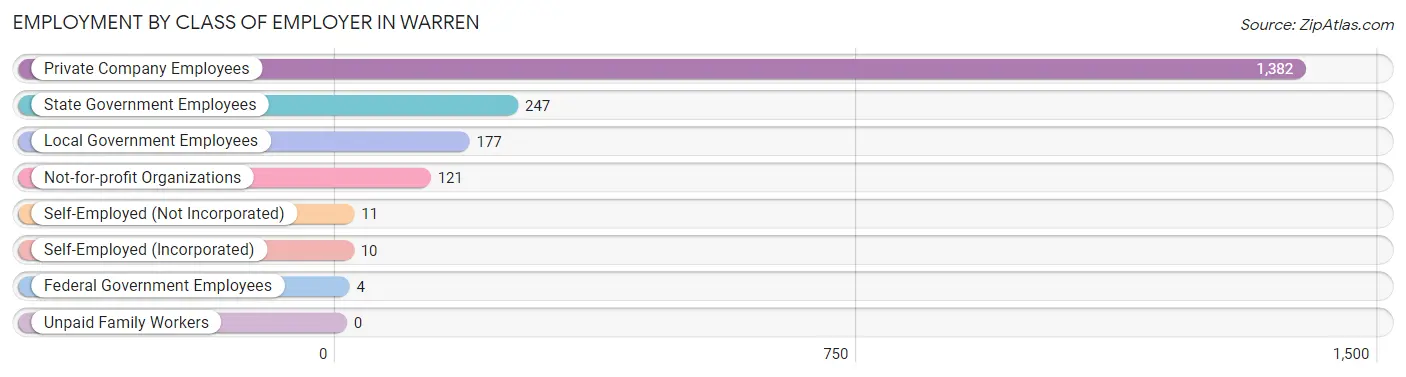
| Employer Class | # Employees | % Employees |
| Private Company Employees | 1,382 | 70.8% |
| Self-Employed (Incorporated) | 10 | 0.5% |
| Self-Employed (Not Incorporated) | 11 | 0.6% |
| Not-for-profit Organizations | 121 | 6.2% |
| Local Government Employees | 177 | 9.1% |
| State Government Employees | 247 | 12.7% |
| Federal Government Employees | 4 | 0.2% |
| Unpaid Family Workers | 0 | 0.0% |
| Total | 1,952 | 100.0% |
Employment Status by Age in Warren
According to the labor force statistics for Warren, out of the total population over 16 years of age (4,069), 51.3% or 2,087 individuals are in the labor force, with 4.4% or 92 of them unemployed. The age group with the highest labor force participation rate is 30 to 34 years, with 88.7% or 220 individuals in the labor force. Within the labor force, the 16 to 19 years age range has the highest percentage of unemployed individuals, with 26.8% or 15 of them being unemployed.
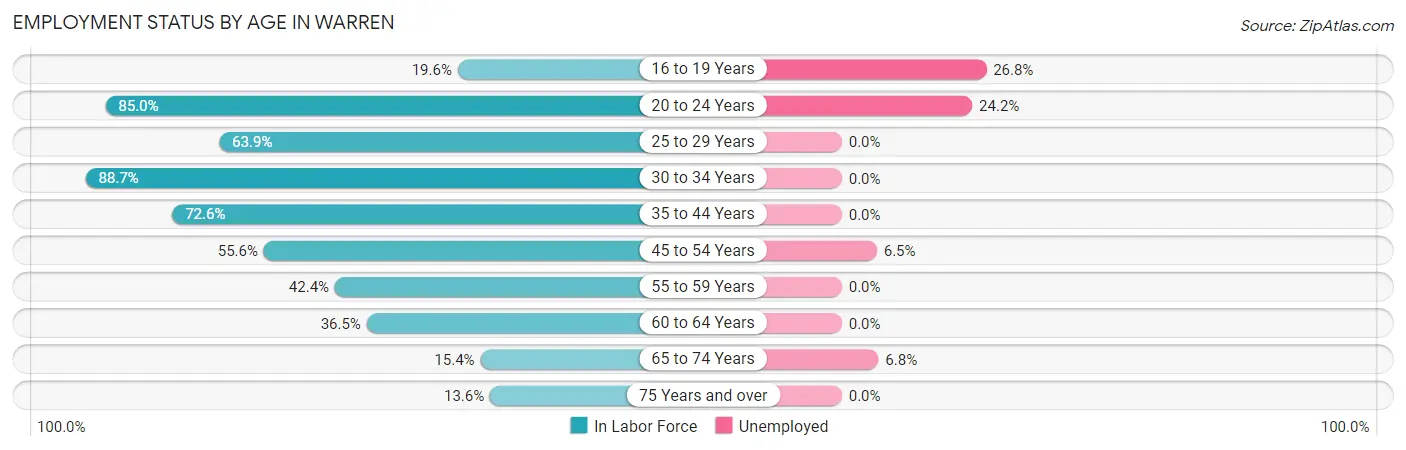
| Age Bracket | In Labor Force | Unemployed |
| 16 to 19 Years | 56 (19.6%) | 15 (26.8%) |
| 20 to 24 Years | 198 (85.0%) | 48 (24.2%) |
| 25 to 29 Years | 255 (63.9%) | 0 (0.0%) |
| 30 to 34 Years | 220 (88.7%) | 0 (0.0%) |
| 35 to 44 Years | 644 (72.6%) | 0 (0.0%) |
| 45 to 54 Years | 370 (55.6%) | 24 (6.5%) |
| 55 to 59 Years | 123 (42.4%) | 0 (0.0%) |
| 60 to 64 Years | 108 (36.5%) | 0 (0.0%) |
| 65 to 74 Years | 74 (15.4%) | 5 (6.8%) |
| 75 Years and over | 39 (13.6%) | 0 (0.0%) |
| Total | 2,087 (51.3%) | 92 (4.4%) |
Employment Status by Educational Attainment in Warren
According to labor force statistics for Warren, 61.8% of individuals (1,721) out of the total population between 25 and 64 years of age (2,785) are in the labor force, with 1.4% or 24 of them being unemployed. The group with the highest labor force participation rate are those with the educational attainment of college / associate degree, with 70.6% or 520 individuals in the labor force. Within the labor force, individuals with less than high school education have the highest percentage of unemployment, with 10.0% or 13 of them being unemployed.
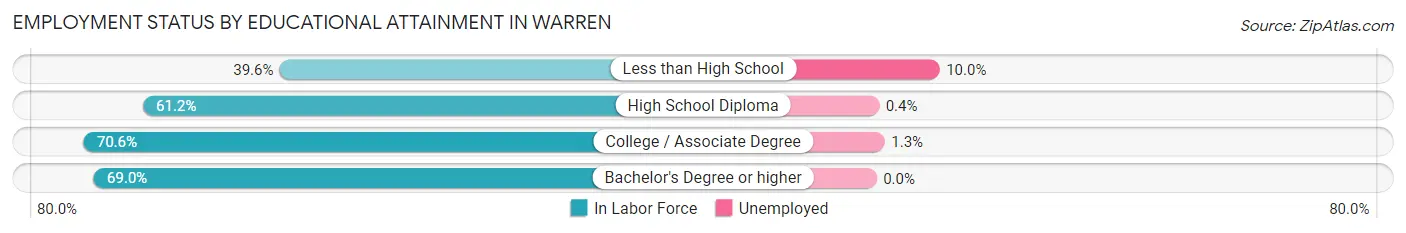
| Educational Attainment | In Labor Force | Unemployed |
| Less than High School | 130 (39.6%) | 33 (10.0%) |
| High School Diploma | 914 (61.2%) | 6 (0.4%) |
| College / Associate Degree | 520 (70.6%) | 10 (1.3%) |
| Bachelor's Degree or higher | 156 (69.0%) | 0 (0.0%) |
| Total | 1,721 (61.8%) | 39 (1.4%) |
Employment Occupations by Sex in Warren
Management, Business, Science and Arts Occupations
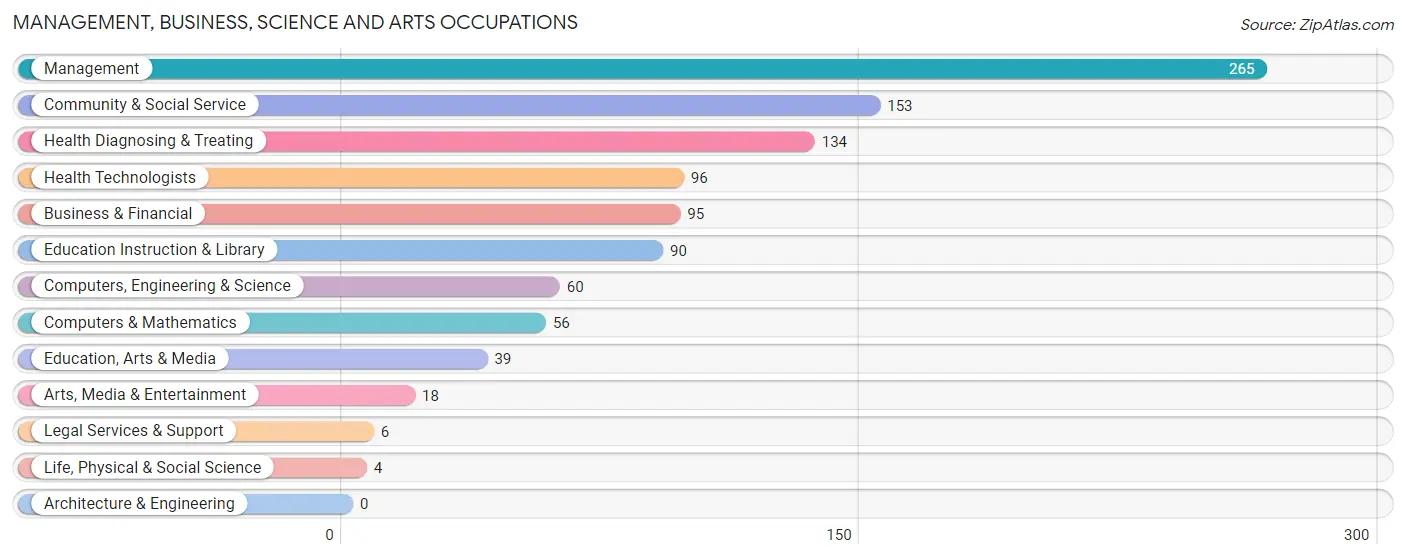
The most common Management, Business, Science and Arts occupations in Warren are Management (265 | 13.3%), Community & Social Service (153 | 7.7%), Health Diagnosing & Treating (134 | 6.7%), Health Technologists (96 | 4.8%), and Business & Financial (95 | 4.8%).
Management, Business, Science and Arts Occupations by Sex
Within the Management, Business, Science and Arts occupations in Warren, the most male-oriented occupations are Life, Physical & Social Science (100.0%), Legal Services & Support (100.0%), and Business & Financial (90.5%), while the most female-oriented occupations are Computers & Mathematics (100.0%), Computers, Engineering & Science (93.3%), and Education, Arts & Media (89.7%).
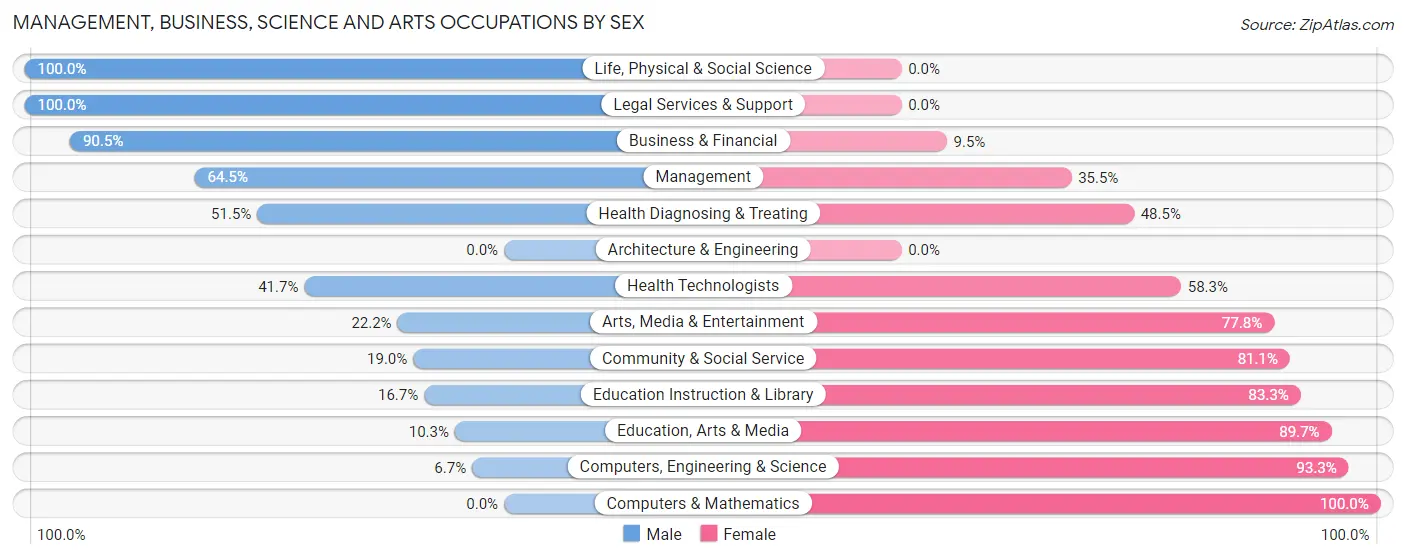
| Occupation | Male | Female |
| Management | 171 (64.5%) | 94 (35.5%) |
| Business & Financial | 86 (90.5%) | 9 (9.5%) |
| Computers, Engineering & Science | 4 (6.7%) | 56 (93.3%) |
| Computers & Mathematics | 0 (0.0%) | 56 (100.0%) |
| Architecture & Engineering | 0 (0.0%) | 0 (0.0%) |
| Life, Physical & Social Science | 4 (100.0%) | 0 (0.0%) |
| Community & Social Service | 29 (19.0%) | 124 (81.0%) |
| Education, Arts & Media | 4 (10.3%) | 35 (89.7%) |
| Legal Services & Support | 6 (100.0%) | 0 (0.0%) |
| Education Instruction & Library | 15 (16.7%) | 75 (83.3%) |
| Arts, Media & Entertainment | 4 (22.2%) | 14 (77.8%) |
| Health Diagnosing & Treating | 69 (51.5%) | 65 (48.5%) |
| Health Technologists | 40 (41.7%) | 56 (58.3%) |
| Total (Category) | 359 (50.8%) | 348 (49.2%) |
| Total (Overall) | 1,013 (50.8%) | 982 (49.2%) |
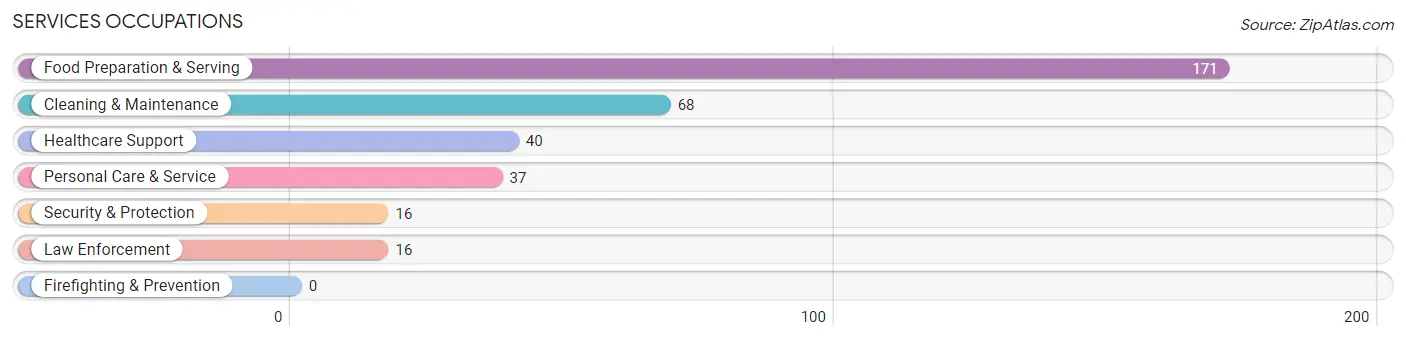
Services Occupations
The most common Services occupations in Warren are Food Preparation & Serving (171 | 8.6%), Cleaning & Maintenance (68 | 3.4%), Healthcare Support (40 | 2.0%), Personal Care & Service (37 | 1.8%), and Security & Protection (16 | 0.8%).
Services Occupations by Sex
Within the Services occupations in Warren, the most male-oriented occupations are Security & Protection (100.0%), Law Enforcement (100.0%), and Personal Care & Service (81.1%), while the most female-oriented occupations are Healthcare Support (95.0%), Food Preparation & Serving (81.9%), and Cleaning & Maintenance (75.0%).
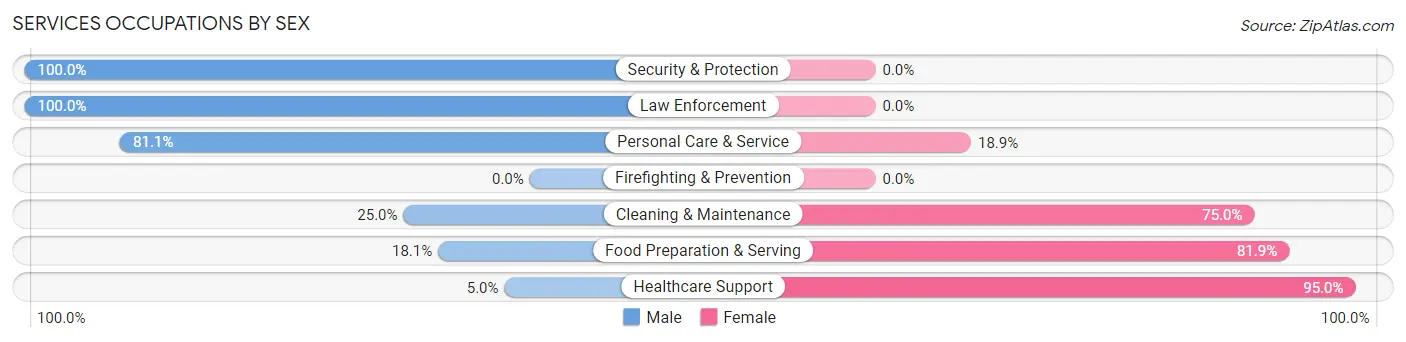
| Occupation | Male | Female |
| Healthcare Support | 2 (5.0%) | 38 (95.0%) |
| Security & Protection | 16 (100.0%) | 0 (0.0%) |
| Firefighting & Prevention | 0 (0.0%) | 0 (0.0%) |
| Law Enforcement | 16 (100.0%) | 0 (0.0%) |
| Food Preparation & Serving | 31 (18.1%) | 140 (81.9%) |
| Cleaning & Maintenance | 17 (25.0%) | 51 (75.0%) |
| Personal Care & Service | 30 (81.1%) | 7 (18.9%) |
| Total (Category) | 96 (28.9%) | 236 (71.1%) |
| Total (Overall) | 1,013 (50.8%) | 982 (49.2%) |
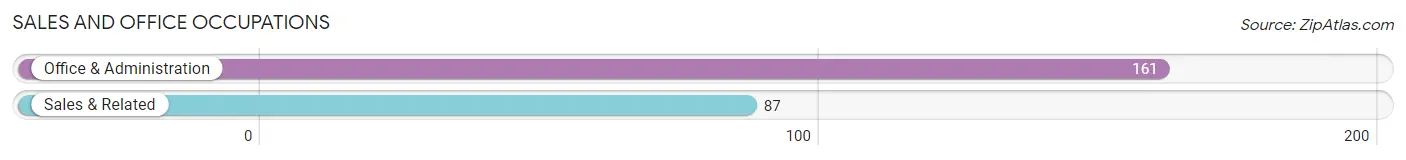
Sales and Office Occupations
The most common Sales and Office occupations in Warren are Office & Administration (161 | 8.1%), and Sales & Related (87 | 4.4%).
Sales and Office Occupations by Sex
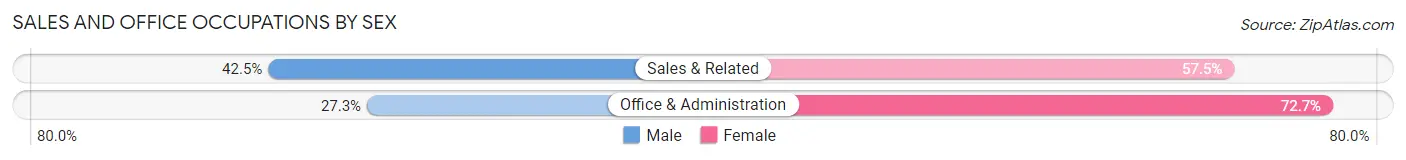
| Occupation | Male | Female |
| Sales & Related | 37 (42.5%) | 50 (57.5%) |
| Office & Administration | 44 (27.3%) | 117 (72.7%) |
| Total (Category) | 81 (32.7%) | 167 (67.3%) |
| Total (Overall) | 1,013 (50.8%) | 982 (49.2%) |
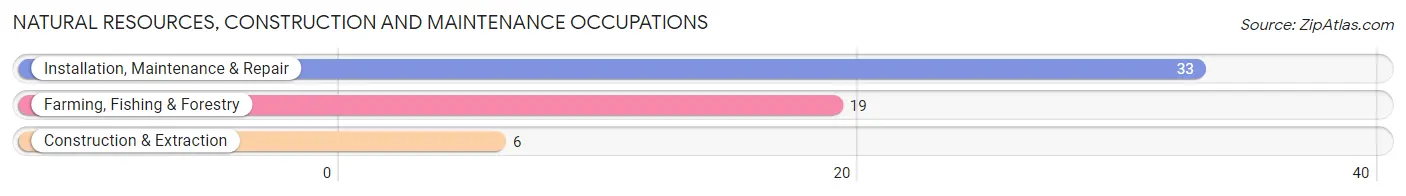
Natural Resources, Construction and Maintenance Occupations
The most common Natural Resources, Construction and Maintenance occupations in Warren are Installation, Maintenance & Repair (33 | 1.7%), Farming, Fishing & Forestry (19 | 0.9%), and Construction & Extraction (6 | 0.3%).
Natural Resources, Construction and Maintenance Occupations by Sex
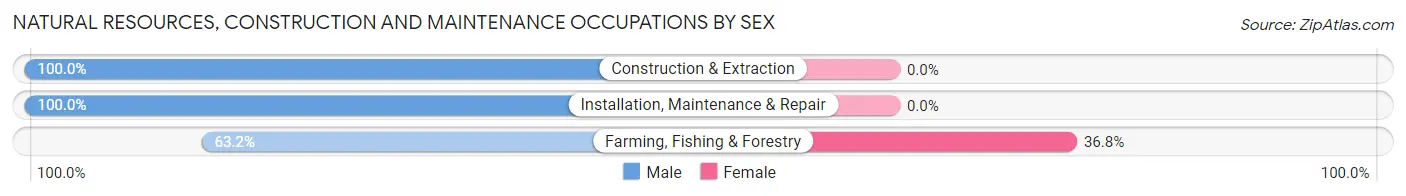
| Occupation | Male | Female |
| Farming, Fishing & Forestry | 12 (63.2%) | 7 (36.8%) |
| Construction & Extraction | 6 (100.0%) | 0 (0.0%) |
| Installation, Maintenance & Repair | 33 (100.0%) | 0 (0.0%) |
| Total (Category) | 51 (87.9%) | 7 (12.1%) |
| Total (Overall) | 1,013 (50.8%) | 982 (49.2%) |
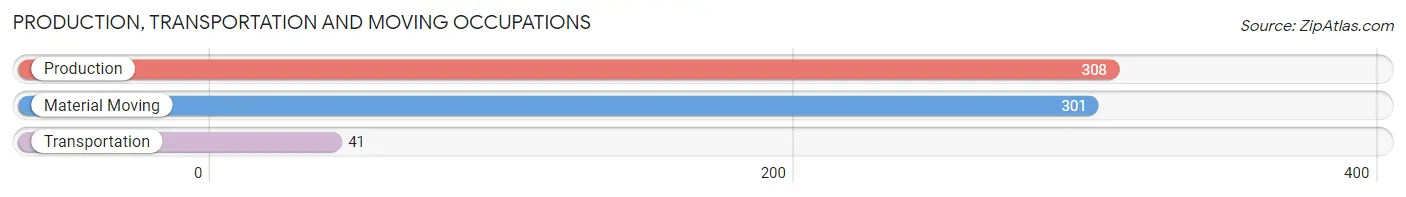
Production, Transportation and Moving Occupations
The most common Production, Transportation and Moving occupations in Warren are Production (308 | 15.4%), Material Moving (301 | 15.1%), and Transportation (41 | 2.1%).
Production, Transportation and Moving Occupations by Sex
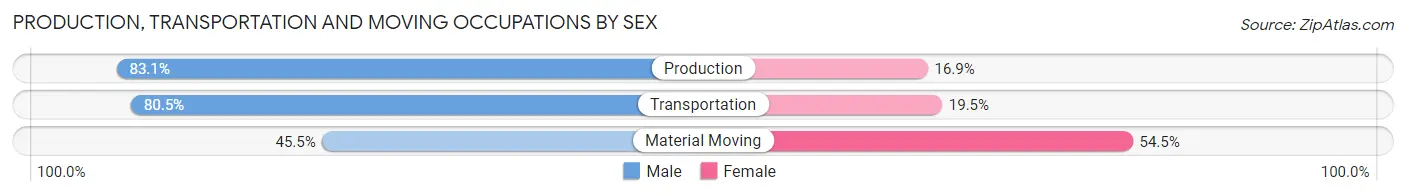
| Occupation | Male | Female |
| Production | 256 (83.1%) | 52 (16.9%) |
| Transportation | 33 (80.5%) | 8 (19.5%) |
| Material Moving | 137 (45.5%) | 164 (54.5%) |
| Total (Category) | 426 (65.5%) | 224 (34.5%) |
| Total (Overall) | 1,013 (50.8%) | 982 (49.2%) |
Employment Industries by Sex in Warren
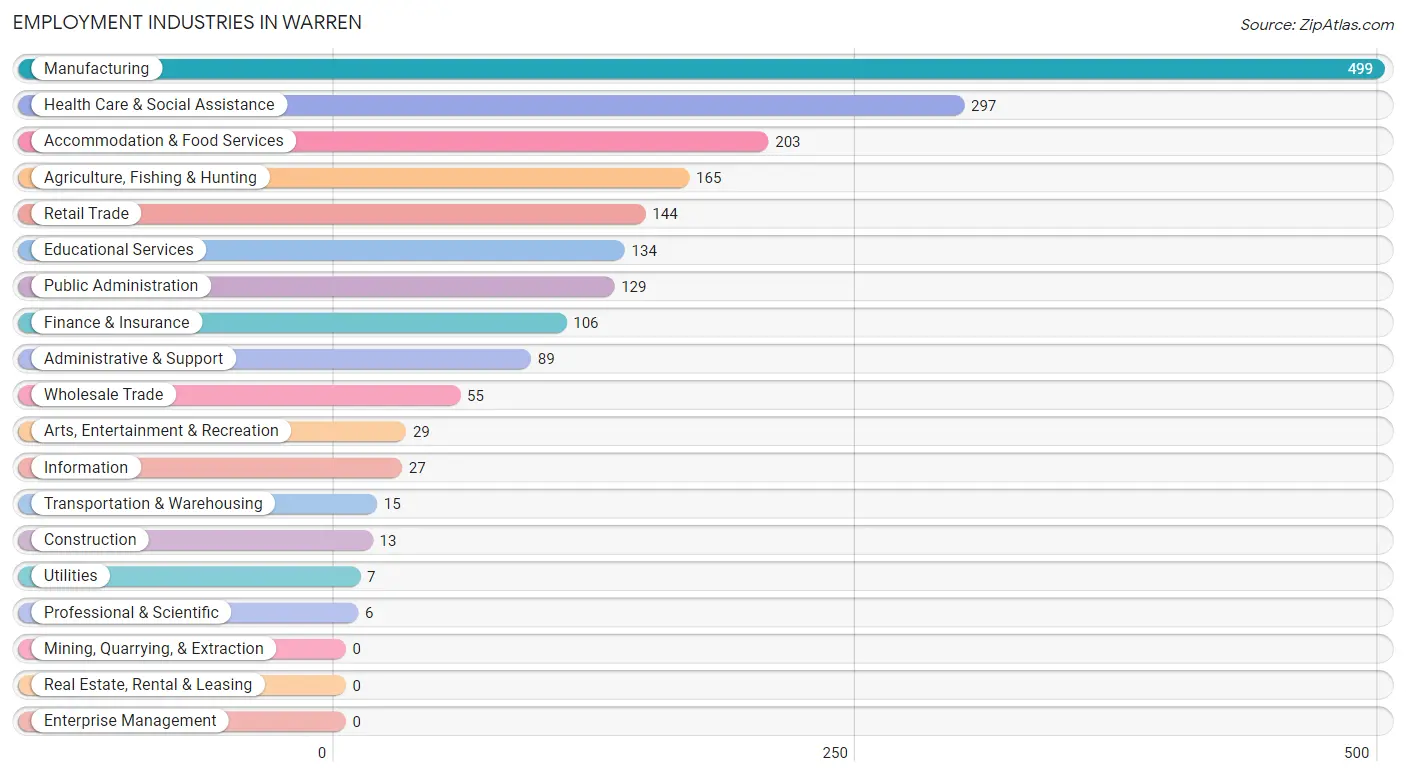
Employment Industries in Warren
The major employment industries in Warren include Manufacturing (499 | 25.0%), Health Care & Social Assistance (297 | 14.9%), Accommodation & Food Services (203 | 10.2%), Agriculture, Fishing & Hunting (165 | 8.3%), and Retail Trade (144 | 7.2%).
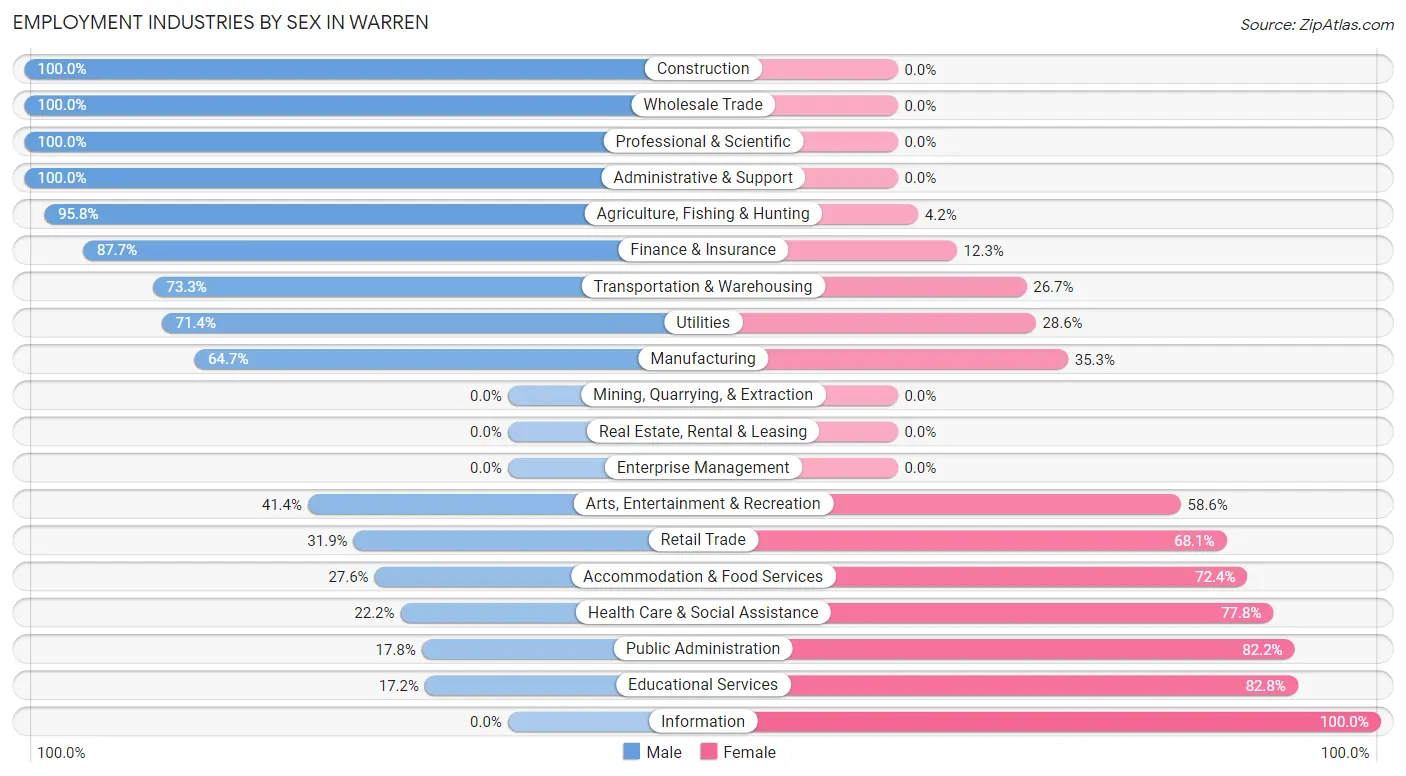
Employment Industries by Sex in Warren
The Warren industries that see more men than women are Construction (100.0%), Wholesale Trade (100.0%), and Professional & Scientific (100.0%), whereas the industries that tend to have a higher number of women are Information (100.0%), Educational Services (82.8%), and Public Administration (82.2%).
| Industry | Male | Female |
| Agriculture, Fishing & Hunting | 158 (95.8%) | 7 (4.2%) |
| Mining, Quarrying, & Extraction | 0 (0.0%) | 0 (0.0%) |
| Construction | 13 (100.0%) | 0 (0.0%) |
| Manufacturing | 323 (64.7%) | 176 (35.3%) |
| Wholesale Trade | 55 (100.0%) | 0 (0.0%) |
| Retail Trade | 46 (31.9%) | 98 (68.1%) |
| Transportation & Warehousing | 11 (73.3%) | 4 (26.7%) |
| Utilities | 5 (71.4%) | 2 (28.6%) |
| Information | 0 (0.0%) | 27 (100.0%) |
| Finance & Insurance | 93 (87.7%) | 13 (12.3%) |
| Real Estate, Rental & Leasing | 0 (0.0%) | 0 (0.0%) |
| Professional & Scientific | 6 (100.0%) | 0 (0.0%) |
| Enterprise Management | 0 (0.0%) | 0 (0.0%) |
| Administrative & Support | 89 (100.0%) | 0 (0.0%) |
| Educational Services | 23 (17.2%) | 111 (82.8%) |
| Health Care & Social Assistance | 66 (22.2%) | 231 (77.8%) |
| Arts, Entertainment & Recreation | 12 (41.4%) | 17 (58.6%) |
| Accommodation & Food Services | 56 (27.6%) | 147 (72.4%) |
| Public Administration | 23 (17.8%) | 106 (82.2%) |
| Total | 1,013 (50.8%) | 982 (49.2%) |
Education in Warren
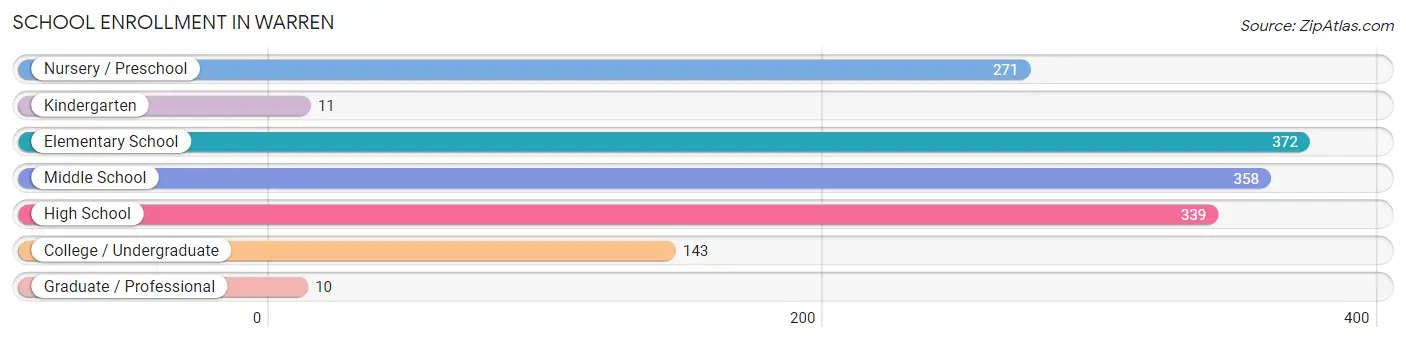
School Enrollment in Warren
The most common levels of schooling among the 1,504 students in Warren are elementary school (372 | 24.7%), middle school (358 | 23.8%), and high school (339 | 22.5%).
| School Level | # Students | % Students |
| Nursery / Preschool | 271 | 18.0% |
| Kindergarten | 11 | 0.7% |
| Elementary School | 372 | 24.7% |
| Middle School | 358 | 23.8% |
| High School | 339 | 22.5% |
| College / Undergraduate | 143 | 9.5% |
| Graduate / Professional | 10 | 0.7% |
| Total | 1,504 | 100.0% |
School Enrollment by Age by Funding Source in Warren
Out of a total of 1,504 students who are enrolled in schools in Warren, 56 (3.7%) attend a private institution, while the remaining 1,448 (96.3%) are enrolled in public schools. The age group of 25 to 34 year olds has the highest likelihood of being enrolled in private schools, with 13 (26.5% in the age bracket) enrolled. Conversely, the age group of 3 to 4 year olds has the lowest likelihood of being enrolled in a private school, with 213 (100.0% in the age bracket) attending a public institution.
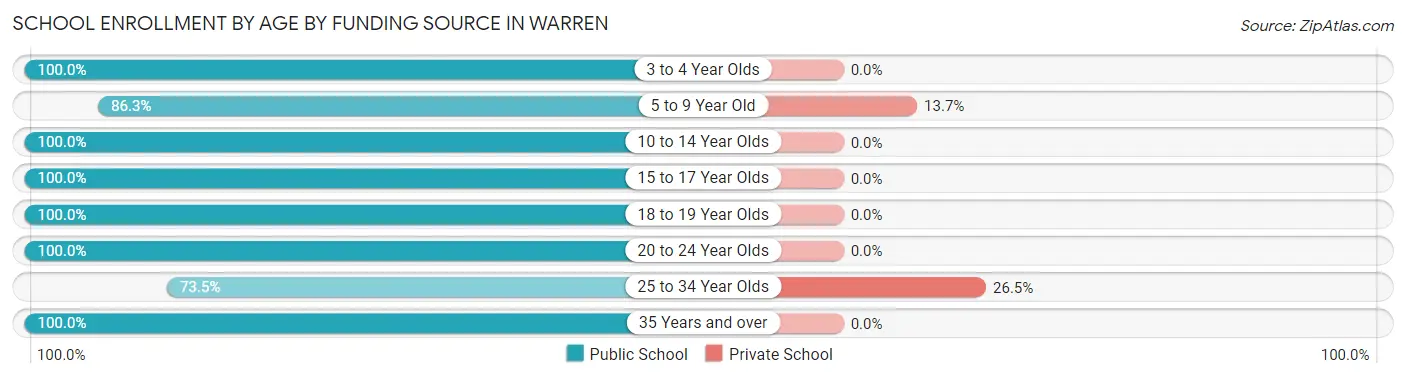
| Age Bracket | Public School | Private School |
| 3 to 4 Year Olds | 213 (100.0%) | 0 (0.0%) |
| 5 to 9 Year Old | 271 (86.3%) | 43 (13.7%) |
| 10 to 14 Year Olds | 566 (100.0%) | 0 (0.0%) |
| 15 to 17 Year Olds | 118 (100.0%) | 0 (0.0%) |
| 18 to 19 Year Olds | 130 (100.0%) | 0 (0.0%) |
| 20 to 24 Year Olds | 87 (100.0%) | 0 (0.0%) |
| 25 to 34 Year Olds | 36 (73.5%) | 13 (26.5%) |
| 35 Years and over | 27 (100.0%) | 0 (0.0%) |
| Total | 1,448 (96.3%) | 56 (3.7%) |
Educational Attainment by Field of Study in Warren
Education (105 | 25.1%), business (74 | 17.7%), science & technology (54 | 12.9%), computers & mathematics (40 | 9.6%), and arts & humanities (40 | 9.6%) are the most common fields of study among 418 individuals in Warren who have obtained a bachelor's degree or higher.
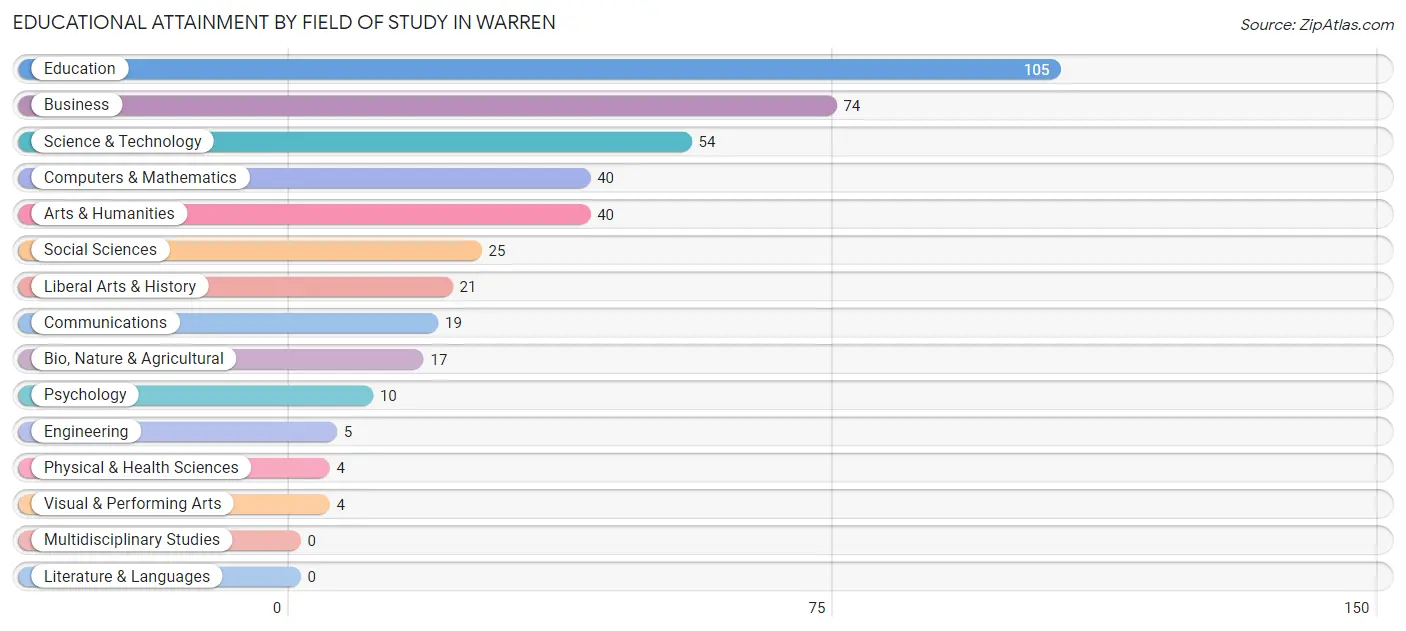
| Field of Study | # Graduates | % Graduates |
| Computers & Mathematics | 40 | 9.6% |
| Bio, Nature & Agricultural | 17 | 4.1% |
| Physical & Health Sciences | 4 | 1.0% |
| Psychology | 10 | 2.4% |
| Social Sciences | 25 | 6.0% |
| Engineering | 5 | 1.2% |
| Multidisciplinary Studies | 0 | 0.0% |
| Science & Technology | 54 | 12.9% |
| Business | 74 | 17.7% |
| Education | 105 | 25.1% |
| Literature & Languages | 0 | 0.0% |
| Liberal Arts & History | 21 | 5.0% |
| Visual & Performing Arts | 4 | 1.0% |
| Communications | 19 | 4.5% |
| Arts & Humanities | 40 | 9.6% |
| Total | 418 | 100.0% |
Transportation & Commute in Warren
Vehicle Availability by Sex in Warren
The most prevalent vehicle ownership categories in Warren are males with 2 vehicles (448, accounting for 44.2%) and females with 2 vehicles (363, making up 47.7%).
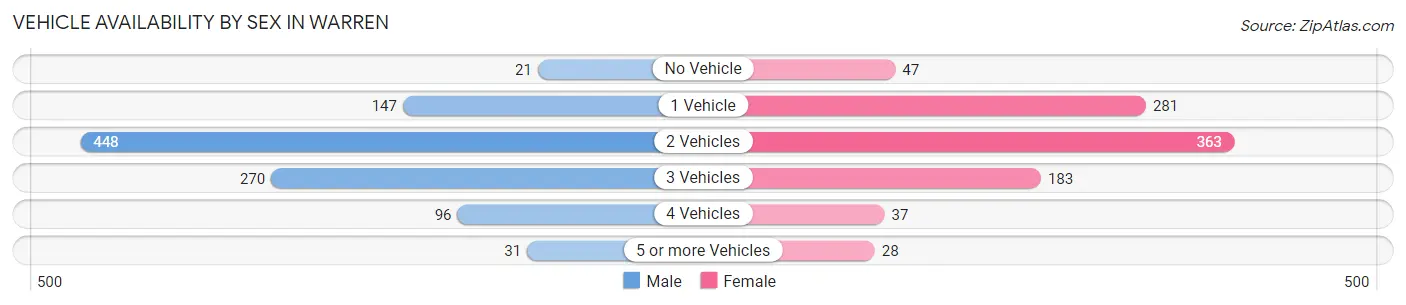
| Vehicles Available | Male | Female |
| No Vehicle | 21 (2.1%) | 47 (5.0%) |
| 1 Vehicle | 147 (14.5%) | 281 (29.9%) |
| 2 Vehicles | 448 (44.2%) | 363 (38.7%) |
| 3 Vehicles | 270 (26.7%) | 183 (19.5%) |
| 4 Vehicles | 96 (9.5%) | 37 (3.9%) |
| 5 or more Vehicles | 31 (3.1%) | 28 (3.0%) |
| Total | 1,013 (100.0%) | 939 (100.0%) |
Commute Time in Warren
The most frequently occuring commute durations in Warren are 10 to 14 minutes (458 commuters, 23.6%), 5 to 9 minutes (430 commuters, 22.2%), and less than 5 minutes (332 commuters, 17.1%).
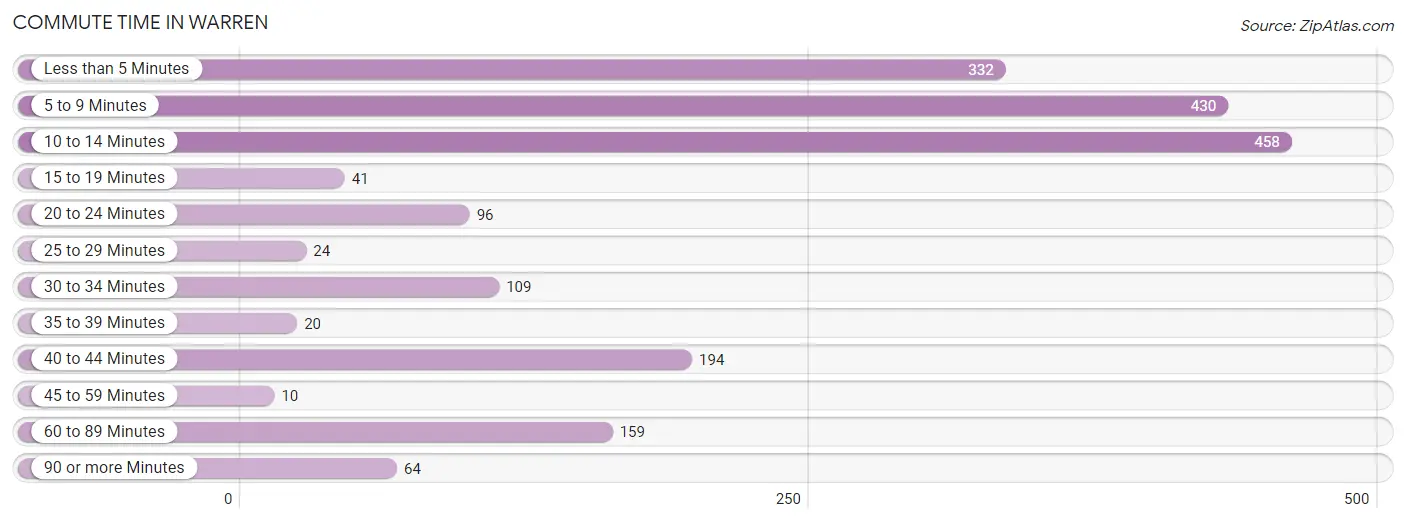
| Commute Time | # Commuters | % Commuters |
| Less than 5 Minutes | 332 | 17.1% |
| 5 to 9 Minutes | 430 | 22.2% |
| 10 to 14 Minutes | 458 | 23.6% |
| 15 to 19 Minutes | 41 | 2.1% |
| 20 to 24 Minutes | 96 | 5.0% |
| 25 to 29 Minutes | 24 | 1.2% |
| 30 to 34 Minutes | 109 | 5.6% |
| 35 to 39 Minutes | 20 | 1.0% |
| 40 to 44 Minutes | 194 | 10.0% |
| 45 to 59 Minutes | 10 | 0.5% |
| 60 to 89 Minutes | 159 | 8.2% |
| 90 or more Minutes | 64 | 3.3% |
Commute Time by Sex in Warren
The most common commute times in Warren are 10 to 14 minutes (256 commuters, 25.3%) for males and 5 to 9 minutes (221 commuters, 23.9%) for females.
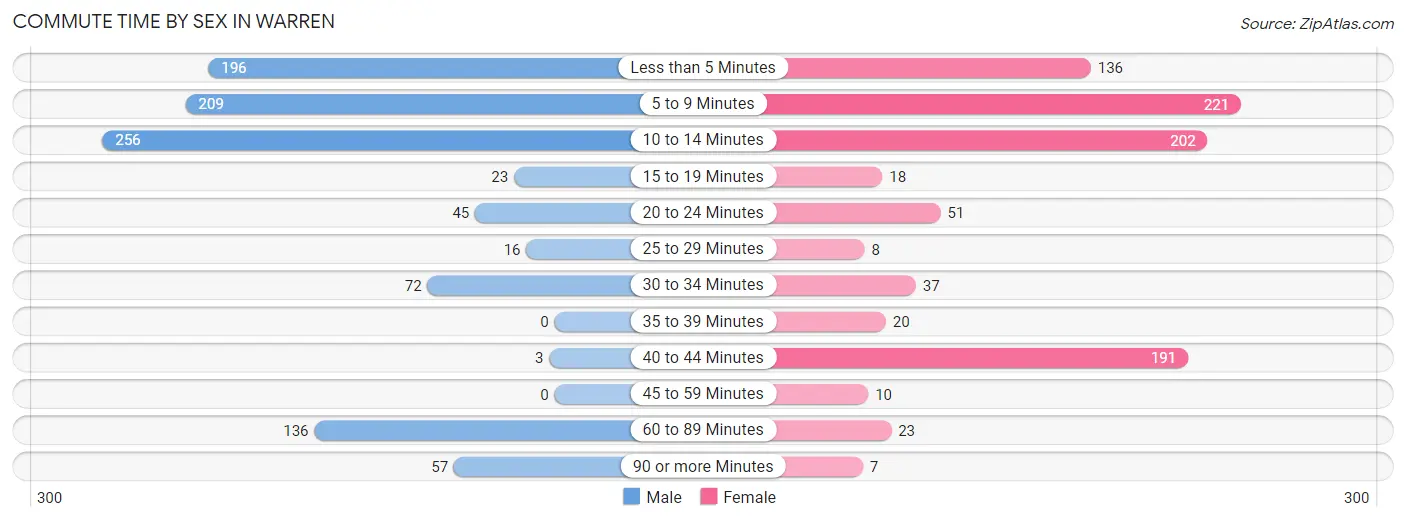
| Commute Time | Male | Female |
| Less than 5 Minutes | 196 (19.4%) | 136 (14.7%) |
| 5 to 9 Minutes | 209 (20.6%) | 221 (23.9%) |
| 10 to 14 Minutes | 256 (25.3%) | 202 (21.9%) |
| 15 to 19 Minutes | 23 (2.3%) | 18 (1.9%) |
| 20 to 24 Minutes | 45 (4.4%) | 51 (5.5%) |
| 25 to 29 Minutes | 16 (1.6%) | 8 (0.9%) |
| 30 to 34 Minutes | 72 (7.1%) | 37 (4.0%) |
| 35 to 39 Minutes | 0 (0.0%) | 20 (2.2%) |
| 40 to 44 Minutes | 3 (0.3%) | 191 (20.7%) |
| 45 to 59 Minutes | 0 (0.0%) | 10 (1.1%) |
| 60 to 89 Minutes | 136 (13.4%) | 23 (2.5%) |
| 90 or more Minutes | 57 (5.6%) | 7 (0.8%) |
Time of Departure to Work by Sex in Warren
The most frequent times of departure to work in Warren are 6:30 AM to 6:59 AM (176, 17.4%) for males and 5:00 AM to 5:29 AM (216, 23.4%) for females.
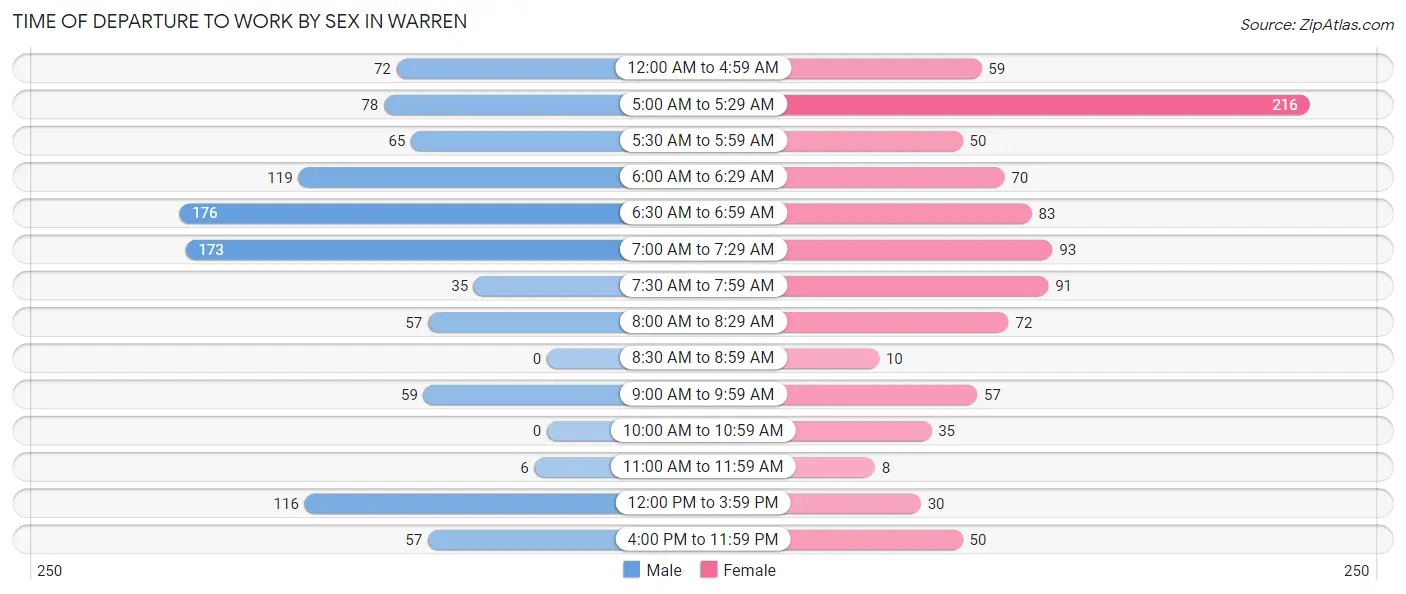
| Time of Departure | Male | Female |
| 12:00 AM to 4:59 AM | 72 (7.1%) | 59 (6.4%) |
| 5:00 AM to 5:29 AM | 78 (7.7%) | 216 (23.4%) |
| 5:30 AM to 5:59 AM | 65 (6.4%) | 50 (5.4%) |
| 6:00 AM to 6:29 AM | 119 (11.7%) | 70 (7.6%) |
| 6:30 AM to 6:59 AM | 176 (17.4%) | 83 (9.0%) |
| 7:00 AM to 7:29 AM | 173 (17.1%) | 93 (10.1%) |
| 7:30 AM to 7:59 AM | 35 (3.5%) | 91 (9.9%) |
| 8:00 AM to 8:29 AM | 57 (5.6%) | 72 (7.8%) |
| 8:30 AM to 8:59 AM | 0 (0.0%) | 10 (1.1%) |
| 9:00 AM to 9:59 AM | 59 (5.8%) | 57 (6.2%) |
| 10:00 AM to 10:59 AM | 0 (0.0%) | 35 (3.8%) |
| 11:00 AM to 11:59 AM | 6 (0.6%) | 8 (0.9%) |
| 12:00 PM to 3:59 PM | 116 (11.5%) | 30 (3.3%) |
| 4:00 PM to 11:59 PM | 57 (5.6%) | 50 (5.4%) |
| Total | 1,013 (100.0%) | 924 (100.0%) |
Housing Occupancy in Warren
Occupancy by Ownership in Warren
Of the total 1,862 dwellings in Warren, owner-occupied units account for 911 (48.9%), while renter-occupied units make up 951 (51.1%).
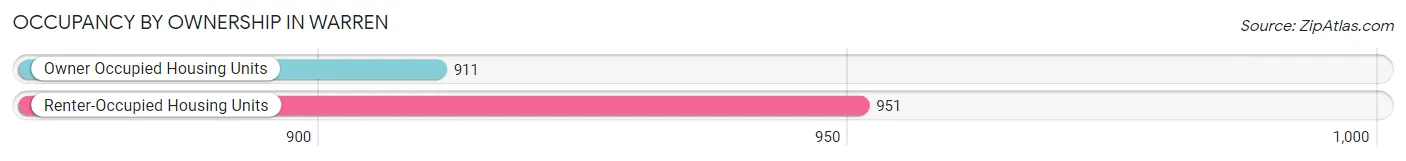
| Occupancy | # Housing Units | % Housing Units |
| Owner Occupied Housing Units | 911 | 48.9% |
| Renter-Occupied Housing Units | 951 | 51.1% |
| Total Occupied Housing Units | 1,862 | 100.0% |
Occupancy by Household Size in Warren
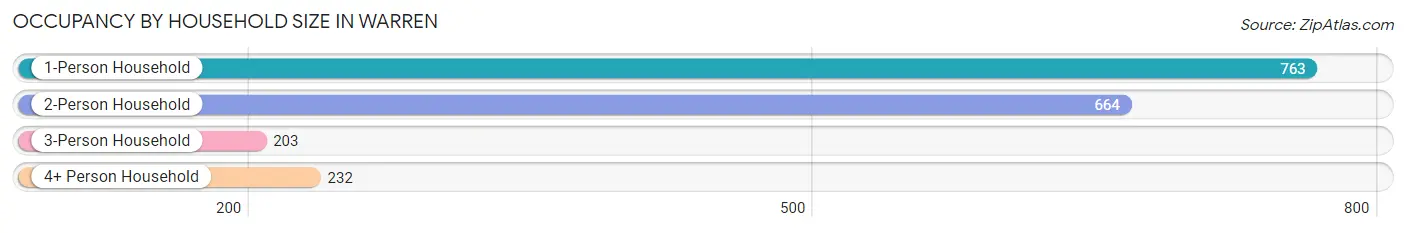
| Household Size | # Housing Units | % Housing Units |
| 1-Person Household | 763 | 41.0% |
| 2-Person Household | 664 | 35.7% |
| 3-Person Household | 203 | 10.9% |
| 4+ Person Household | 232 | 12.5% |
| Total Housing Units | 1,862 | 100.0% |
Occupancy by Ownership by Household Size in Warren
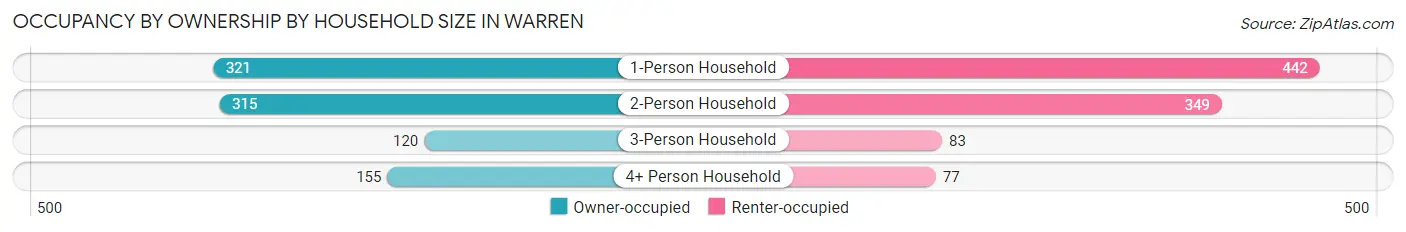
| Household Size | Owner-occupied | Renter-occupied |
| 1-Person Household | 321 (42.1%) | 442 (57.9%) |
| 2-Person Household | 315 (47.4%) | 349 (52.6%) |
| 3-Person Household | 120 (59.1%) | 83 (40.9%) |
| 4+ Person Household | 155 (66.8%) | 77 (33.2%) |
| Total Housing Units | 911 (48.9%) | 951 (51.1%) |
Occupancy by Educational Attainment in Warren
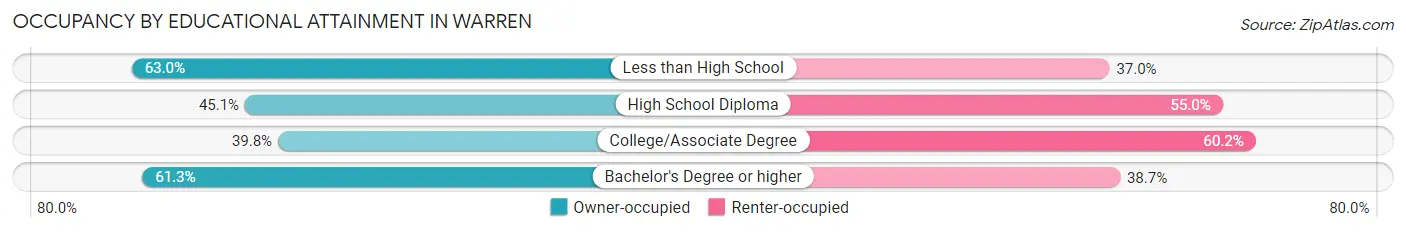
| Household Size | Owner-occupied | Renter-occupied |
| Less than High School | 189 (63.0%) | 111 (37.0%) |
| High School Diploma | 387 (45.1%) | 472 (54.9%) |
| College/Associate Degree | 178 (39.8%) | 269 (60.2%) |
| Bachelor's Degree or higher | 157 (61.3%) | 99 (38.7%) |
Occupancy by Age of Householder in Warren
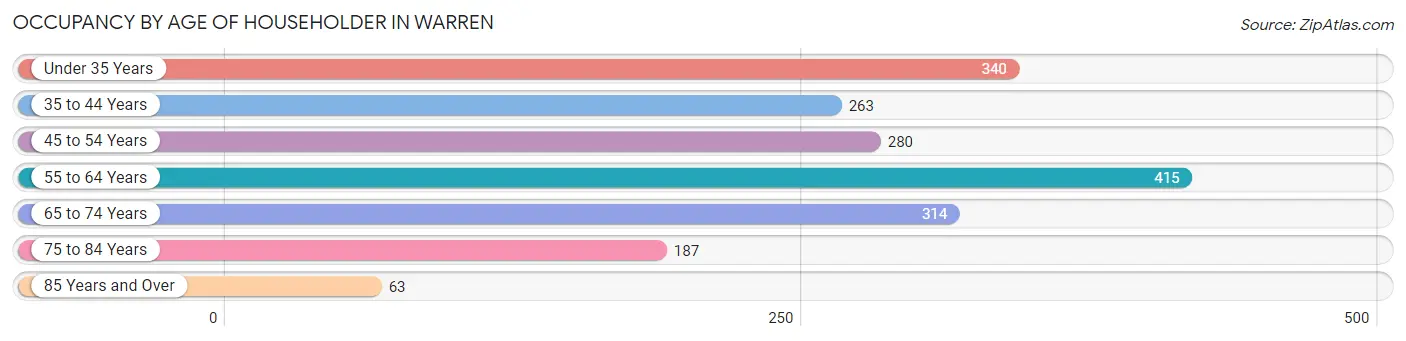
| Age Bracket | # Households | % Households |
| Under 35 Years | 340 | 18.3% |
| 35 to 44 Years | 263 | 14.1% |
| 45 to 54 Years | 280 | 15.0% |
| 55 to 64 Years | 415 | 22.3% |
| 65 to 74 Years | 314 | 16.9% |
| 75 to 84 Years | 187 | 10.0% |
| 85 Years and Over | 63 | 3.4% |
| Total | 1,862 | 100.0% |
Housing Finances in Warren
Median Income by Occupancy in Warren
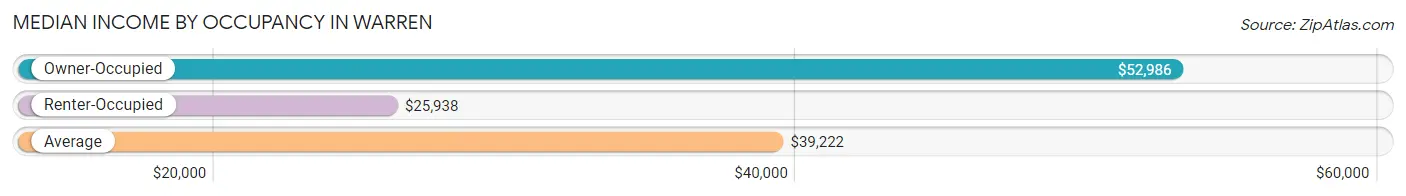
| Occupancy Type | # Households | Median Income |
| Owner-Occupied | 911 (48.9%) | $52,986 |
| Renter-Occupied | 951 (51.1%) | $25,938 |
| Average | 1,862 (100.0%) | $39,222 |
Occupancy by Householder Income Bracket in Warren
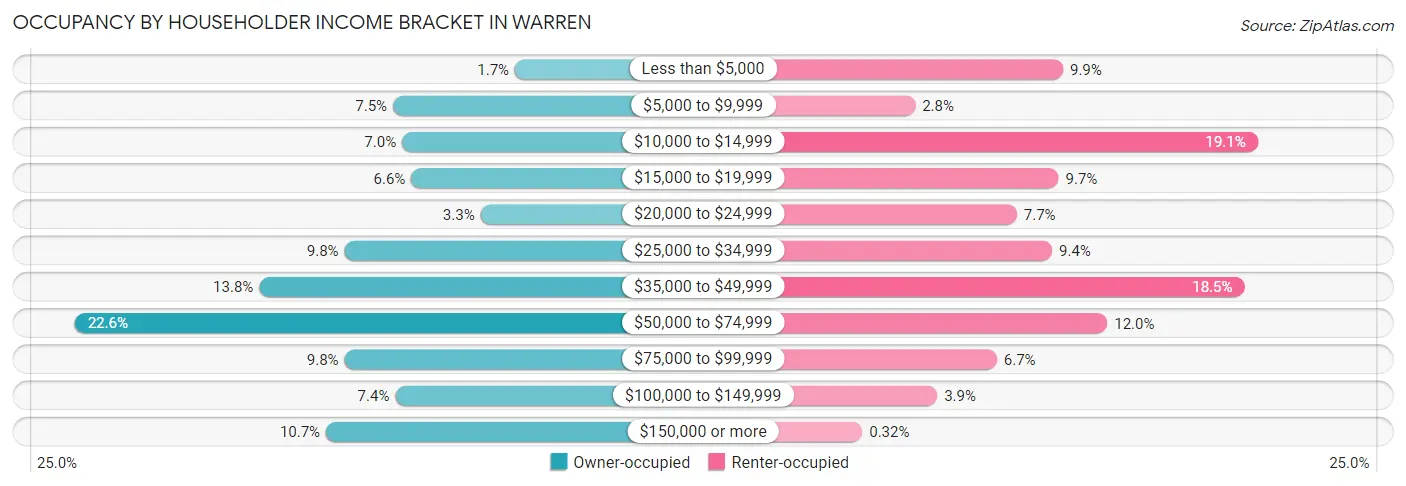
| Income Bracket | Owner-occupied | Renter-occupied |
| Less than $5,000 | 15 (1.7%) | 94 (9.9%) |
| $5,000 to $9,999 | 68 (7.5%) | 27 (2.8%) |
| $10,000 to $14,999 | 64 (7.0%) | 182 (19.1%) |
| $15,000 to $19,999 | 60 (6.6%) | 92 (9.7%) |
| $20,000 to $24,999 | 30 (3.3%) | 73 (7.7%) |
| $25,000 to $34,999 | 89 (9.8%) | 89 (9.4%) |
| $35,000 to $49,999 | 126 (13.8%) | 176 (18.5%) |
| $50,000 to $74,999 | 206 (22.6%) | 114 (12.0%) |
| $75,000 to $99,999 | 89 (9.8%) | 64 (6.7%) |
| $100,000 to $149,999 | 67 (7.3%) | 37 (3.9%) |
| $150,000 or more | 97 (10.6%) | 3 (0.3%) |
| Total | 911 (100.0%) | 951 (100.0%) |
Monthly Housing Cost Tiers in Warren
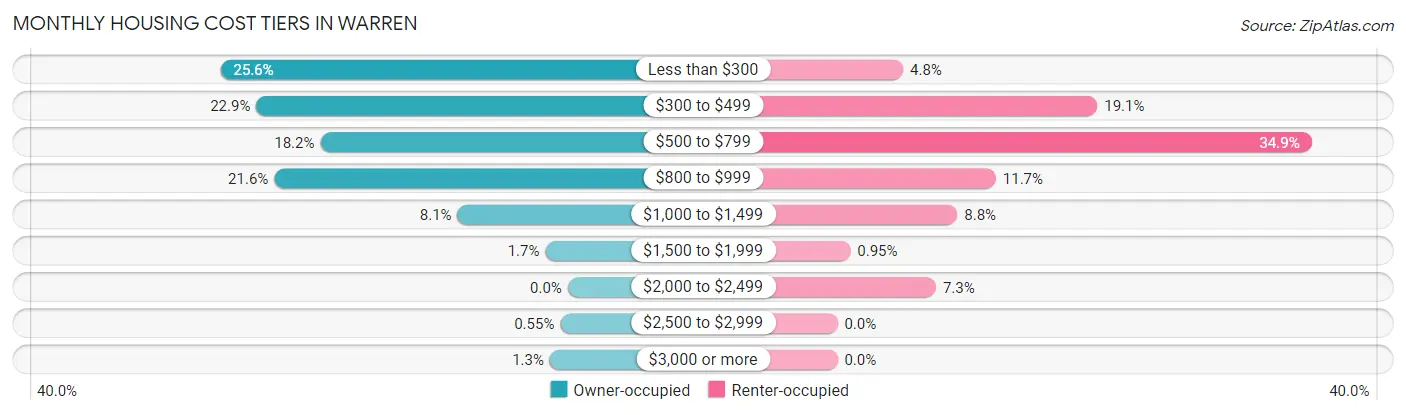
| Monthly Cost | Owner-occupied | Renter-occupied |
| Less than $300 | 233 (25.6%) | 46 (4.8%) |
| $300 to $499 | 209 (22.9%) | 182 (19.1%) |
| $500 to $799 | 166 (18.2%) | 332 (34.9%) |
| $800 to $999 | 197 (21.6%) | 111 (11.7%) |
| $1,000 to $1,499 | 74 (8.1%) | 84 (8.8%) |
| $1,500 to $1,999 | 15 (1.7%) | 9 (0.9%) |
| $2,000 to $2,499 | 0 (0.0%) | 69 (7.3%) |
| $2,500 to $2,999 | 5 (0.5%) | 0 (0.0%) |
| $3,000 or more | 12 (1.3%) | 0 (0.0%) |
| Total | 911 (100.0%) | 951 (100.0%) |
Physical Housing Characteristics in Warren
Housing Structures in Warren
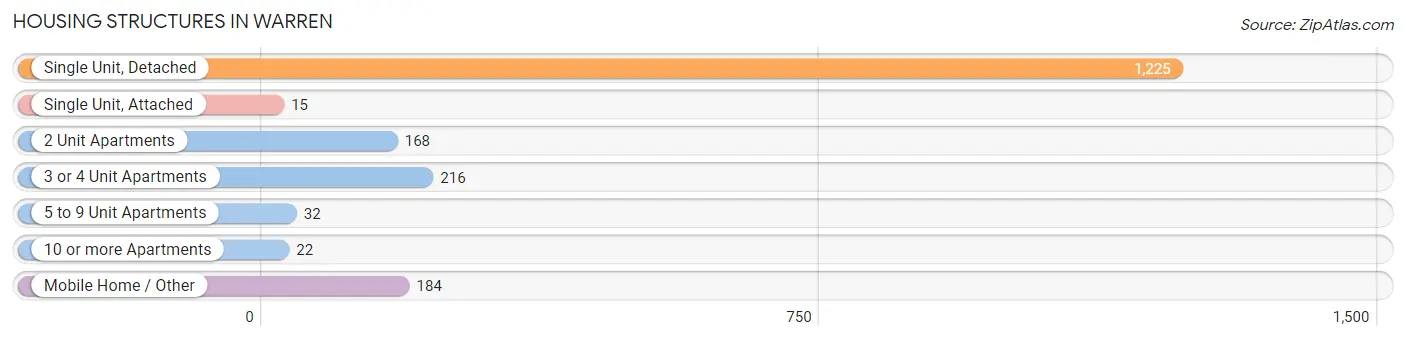
| Structure Type | # Housing Units | % Housing Units |
| Single Unit, Detached | 1,225 | 65.8% |
| Single Unit, Attached | 15 | 0.8% |
| 2 Unit Apartments | 168 | 9.0% |
| 3 or 4 Unit Apartments | 216 | 11.6% |
| 5 to 9 Unit Apartments | 32 | 1.7% |
| 10 or more Apartments | 22 | 1.2% |
| Mobile Home / Other | 184 | 9.9% |
| Total | 1,862 | 100.0% |
Housing Structures by Occupancy in Warren
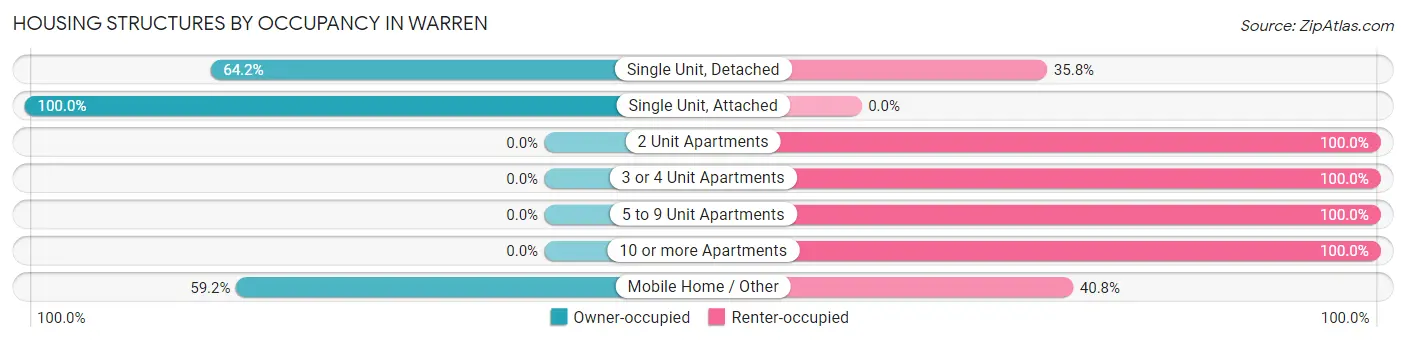
| Structure Type | Owner-occupied | Renter-occupied |
| Single Unit, Detached | 787 (64.2%) | 438 (35.8%) |
| Single Unit, Attached | 15 (100.0%) | 0 (0.0%) |
| 2 Unit Apartments | 0 (0.0%) | 168 (100.0%) |
| 3 or 4 Unit Apartments | 0 (0.0%) | 216 (100.0%) |
| 5 to 9 Unit Apartments | 0 (0.0%) | 32 (100.0%) |
| 10 or more Apartments | 0 (0.0%) | 22 (100.0%) |
| Mobile Home / Other | 109 (59.2%) | 75 (40.8%) |
| Total | 911 (48.9%) | 951 (51.1%) |
Housing Structures by Number of Rooms in Warren
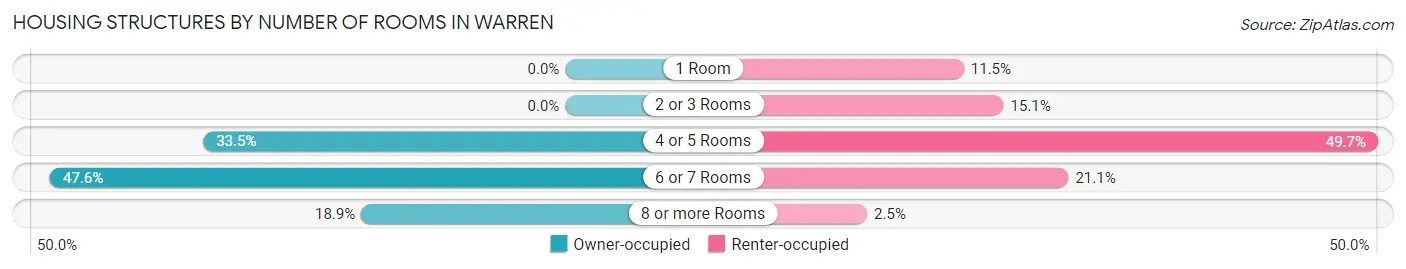
| Number of Rooms | Owner-occupied | Renter-occupied |
| 1 Room | 0 (0.0%) | 109 (11.5%) |
| 2 or 3 Rooms | 0 (0.0%) | 144 (15.1%) |
| 4 or 5 Rooms | 305 (33.5%) | 473 (49.7%) |
| 6 or 7 Rooms | 434 (47.6%) | 201 (21.1%) |
| 8 or more Rooms | 172 (18.9%) | 24 (2.5%) |
| Total | 911 (100.0%) | 951 (100.0%) |
Housing Structure by Heating Type in Warren
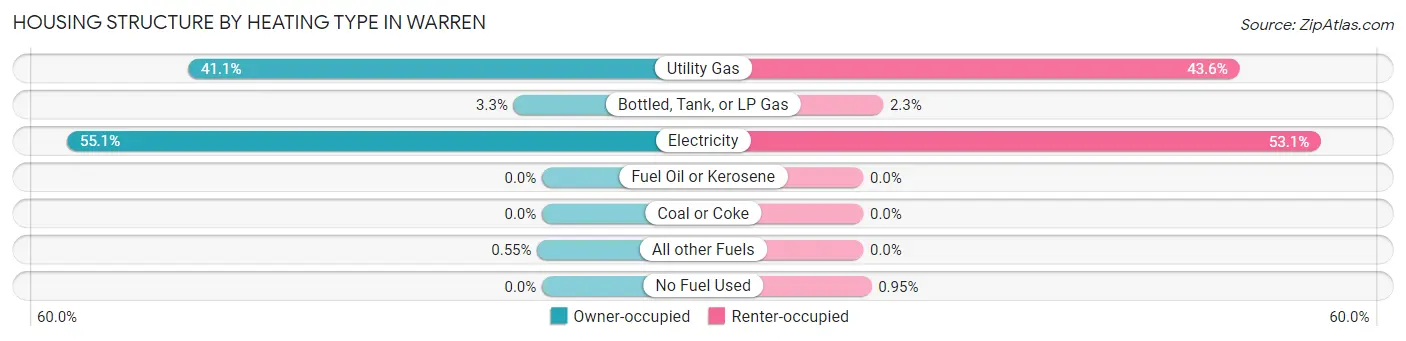
| Heating Type | Owner-occupied | Renter-occupied |
| Utility Gas | 374 (41.0%) | 415 (43.6%) |
| Bottled, Tank, or LP Gas | 30 (3.3%) | 22 (2.3%) |
| Electricity | 502 (55.1%) | 505 (53.1%) |
| Fuel Oil or Kerosene | 0 (0.0%) | 0 (0.0%) |
| Coal or Coke | 0 (0.0%) | 0 (0.0%) |
| All other Fuels | 5 (0.5%) | 0 (0.0%) |
| No Fuel Used | 0 (0.0%) | 9 (0.9%) |
| Total | 911 (100.0%) | 951 (100.0%) |
Household Vehicle Usage in Warren
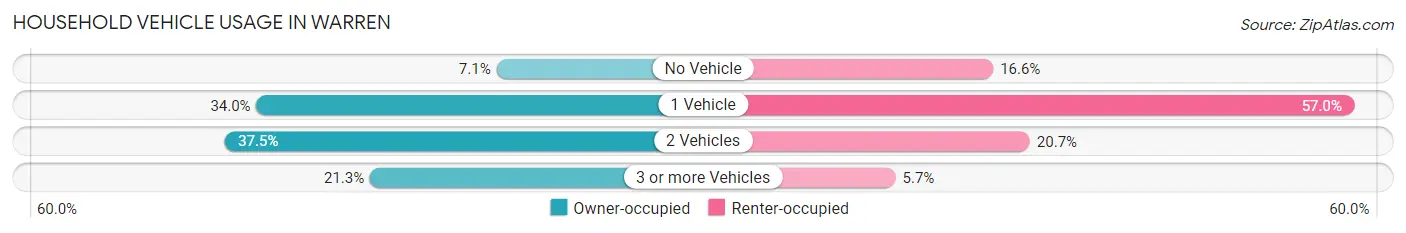
| Vehicles per Household | Owner-occupied | Renter-occupied |
| No Vehicle | 65 (7.1%) | 158 (16.6%) |
| 1 Vehicle | 310 (34.0%) | 542 (57.0%) |
| 2 Vehicles | 342 (37.5%) | 197 (20.7%) |
| 3 or more Vehicles | 194 (21.3%) | 54 (5.7%) |
| Total | 911 (100.0%) | 951 (100.0%) |
Real Estate & Mortgages in Warren
Real Estate and Mortgage Overview in Warren
| Characteristic | Without Mortgage | With Mortgage |
| Housing Units | 528 | 383 |
| Median Property Value | $59,700 | $109,800 |
| Median Household Income | $37,955 | $59 |
| Monthly Housing Costs | $317 | $12 |
| Real Estate Taxes | $428 | $107 |
Property Value by Mortgage Status in Warren
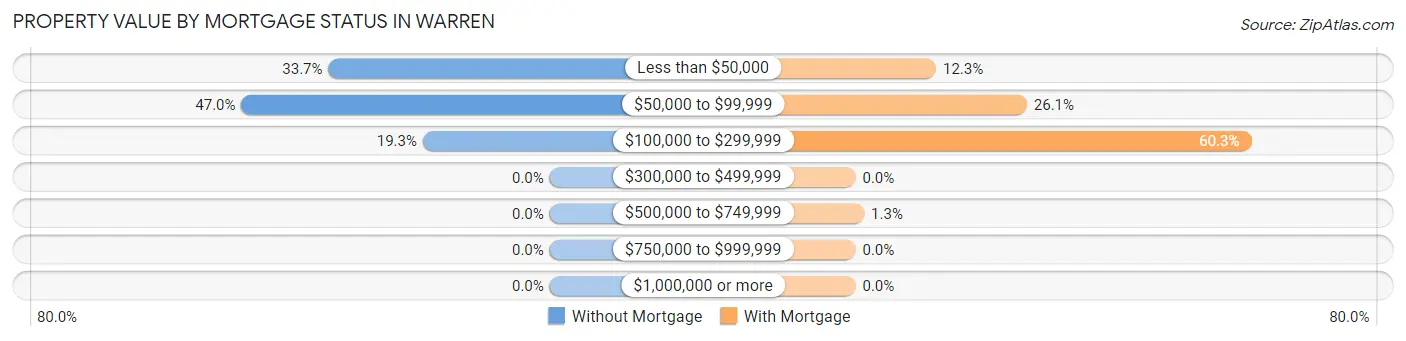
| Property Value | Without Mortgage | With Mortgage |
| Less than $50,000 | 178 (33.7%) | 47 (12.3%) |
| $50,000 to $99,999 | 248 (47.0%) | 100 (26.1%) |
| $100,000 to $299,999 | 102 (19.3%) | 231 (60.3%) |
| $300,000 to $499,999 | 0 (0.0%) | 0 (0.0%) |
| $500,000 to $749,999 | 0 (0.0%) | 5 (1.3%) |
| $750,000 to $999,999 | 0 (0.0%) | 0 (0.0%) |
| $1,000,000 or more | 0 (0.0%) | 0 (0.0%) |
| Total | 528 (100.0%) | 383 (100.0%) |
Household Income by Mortgage Status in Warren
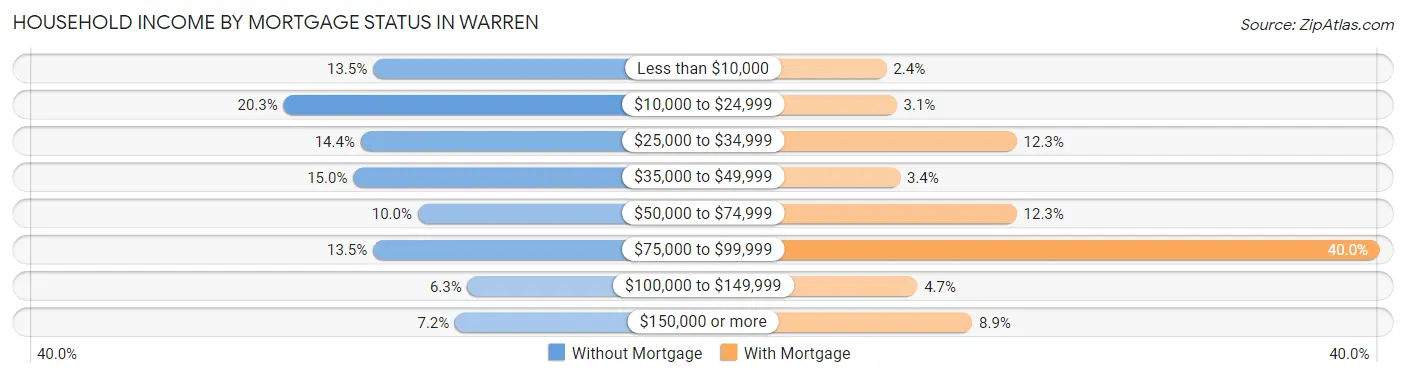
| Household Income | Without Mortgage | With Mortgage |
| Less than $10,000 | 71 (13.5%) | 9 (2.4%) |
| $10,000 to $24,999 | 107 (20.3%) | 12 (3.1%) |
| $25,000 to $34,999 | 76 (14.4%) | 47 (12.3%) |
| $35,000 to $49,999 | 79 (15.0%) | 13 (3.4%) |
| $50,000 to $74,999 | 53 (10.0%) | 47 (12.3%) |
| $75,000 to $99,999 | 71 (13.5%) | 153 (40.0%) |
| $100,000 to $149,999 | 33 (6.2%) | 18 (4.7%) |
| $150,000 or more | 38 (7.2%) | 34 (8.9%) |
| Total | 528 (100.0%) | 383 (100.0%) |
Property Value to Household Income Ratio in Warren
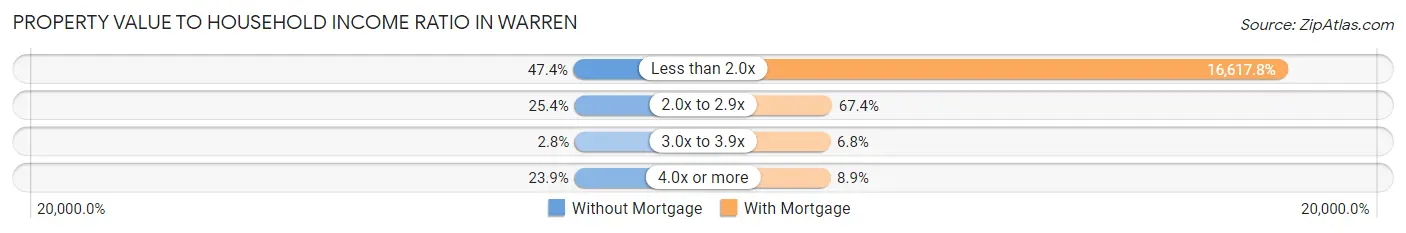
| Value-to-Income Ratio | Without Mortgage | With Mortgage |
| Less than 2.0x | 250 (47.3%) | 63,646 (16,617.8%) |
| 2.0x to 2.9x | 134 (25.4%) | 258 (67.4%) |
| 3.0x to 3.9x | 15 (2.8%) | 26 (6.8%) |
| 4.0x or more | 126 (23.9%) | 34 (8.9%) |
| Total | 528 (100.0%) | 383 (100.0%) |
Real Estate Taxes by Mortgage Status in Warren
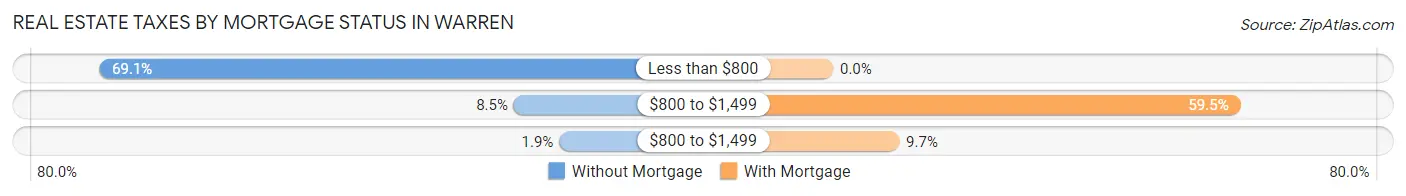
| Property Taxes | Without Mortgage | With Mortgage |
| Less than $800 | 365 (69.1%) | 0 (0.0%) |
| $800 to $1,499 | 45 (8.5%) | 228 (59.5%) |
| $800 to $1,499 | 10 (1.9%) | 37 (9.7%) |
| Total | 528 (100.0%) | 383 (100.0%) |
Health & Disability in Warren
Health Insurance Coverage by Age in Warren
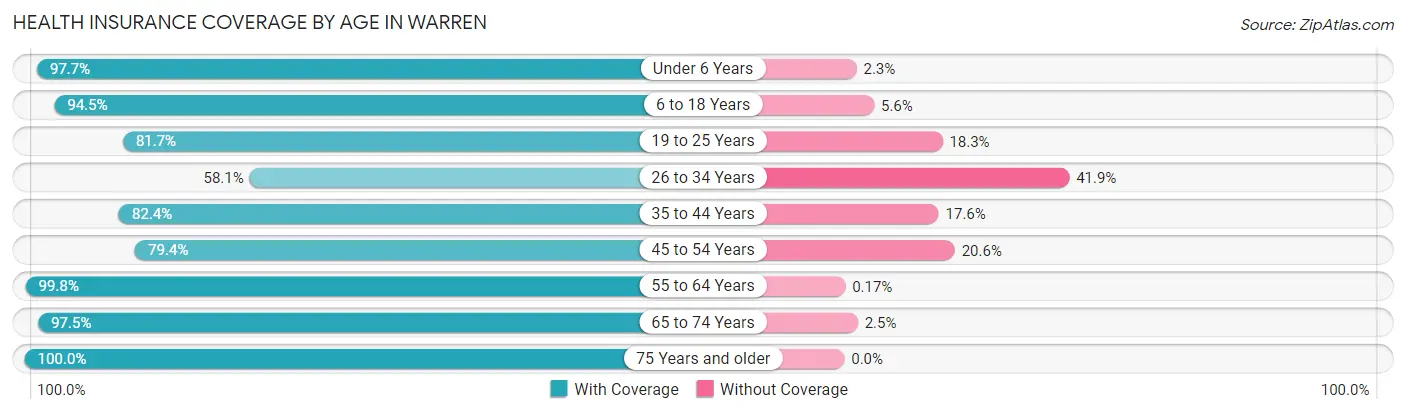
| Age Bracket | With Coverage | Without Coverage |
| Under 6 Years | 471 (97.7%) | 11 (2.3%) |
| 6 to 18 Years | 1,039 (94.5%) | 61 (5.6%) |
| 19 to 25 Years | 308 (81.7%) | 69 (18.3%) |
| 26 to 34 Years | 317 (58.1%) | 229 (41.9%) |
| 35 to 44 Years | 731 (82.4%) | 156 (17.6%) |
| 45 to 54 Years | 528 (79.4%) | 137 (20.6%) |
| 55 to 64 Years | 585 (99.8%) | 1 (0.2%) |
| 65 to 74 Years | 468 (97.5%) | 12 (2.5%) |
| 75 Years and older | 286 (100.0%) | 0 (0.0%) |
| Total | 4,733 (87.5%) | 676 (12.5%) |
Health Insurance Coverage by Citizenship Status in Warren
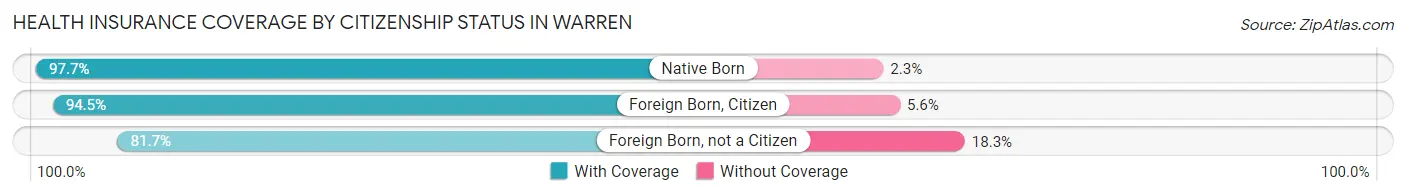
| Citizenship Status | With Coverage | Without Coverage |
| Native Born | 471 (97.7%) | 11 (2.3%) |
| Foreign Born, Citizen | 1,039 (94.5%) | 61 (5.6%) |
| Foreign Born, not a Citizen | 308 (81.7%) | 69 (18.3%) |
Health Insurance Coverage by Household Income in Warren
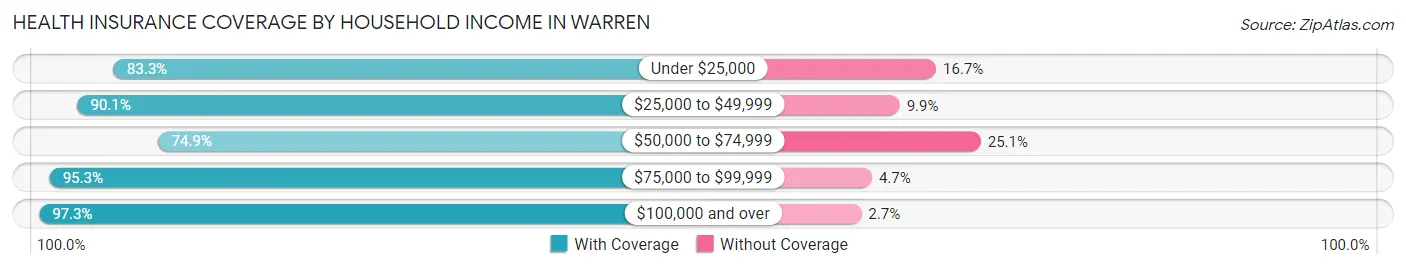
| Household Income | With Coverage | Without Coverage |
| Under $25,000 | 1,189 (83.3%) | 239 (16.7%) |
| $25,000 to $49,999 | 1,200 (90.1%) | 132 (9.9%) |
| $50,000 to $74,999 | 758 (74.9%) | 254 (25.1%) |
| $75,000 to $99,999 | 424 (95.3%) | 21 (4.7%) |
| $100,000 and over | 1,065 (97.3%) | 30 (2.7%) |
Public vs Private Health Insurance Coverage by Age in Warren
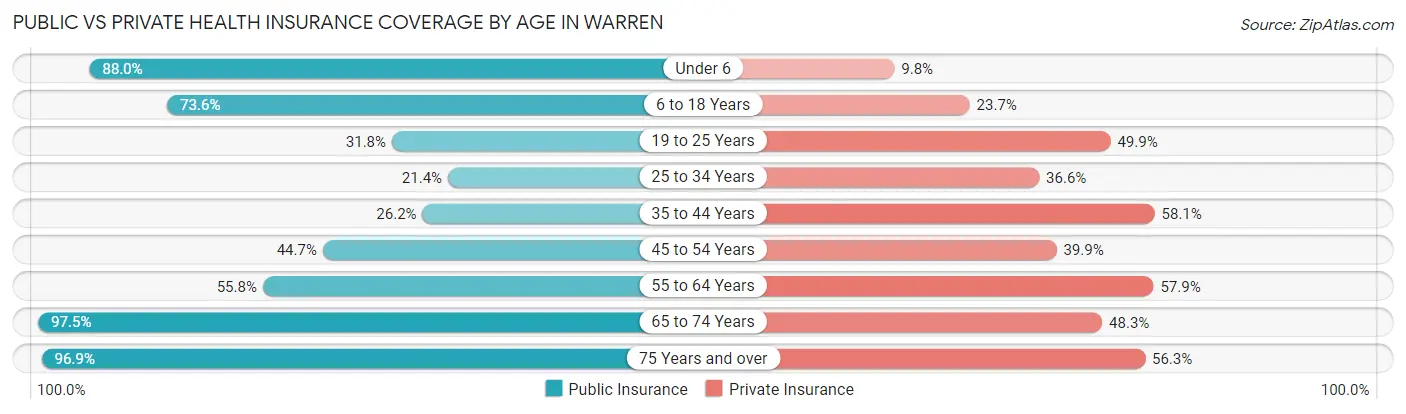
| Age Bracket | Public Insurance | Private Insurance |
| Under 6 | 424 (88.0%) | 47 (9.8%) |
| 6 to 18 Years | 809 (73.6%) | 261 (23.7%) |
| 19 to 25 Years | 120 (31.8%) | 188 (49.9%) |
| 25 to 34 Years | 117 (21.4%) | 200 (36.6%) |
| 35 to 44 Years | 232 (26.2%) | 515 (58.1%) |
| 45 to 54 Years | 297 (44.7%) | 265 (39.9%) |
| 55 to 64 Years | 327 (55.8%) | 339 (57.9%) |
| 65 to 74 Years | 468 (97.5%) | 232 (48.3%) |
| 75 Years and over | 277 (96.9%) | 161 (56.3%) |
| Total | 3,071 (56.8%) | 2,208 (40.8%) |
Disability Status by Sex by Age in Warren
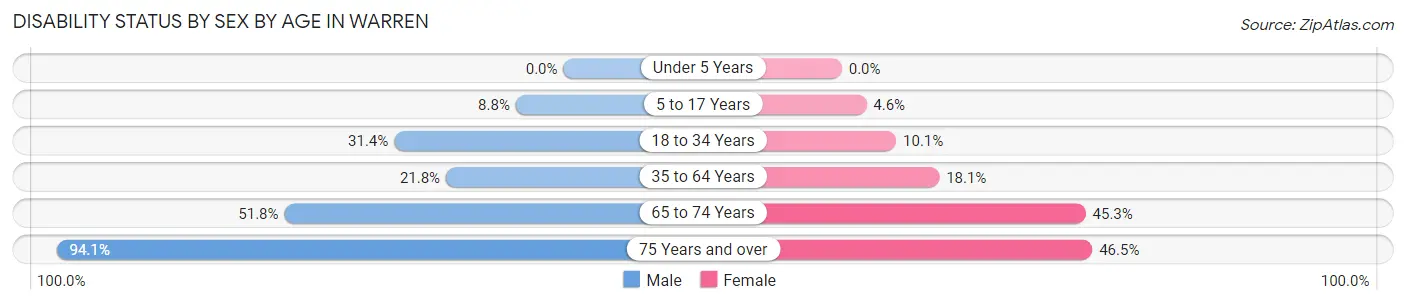
| Age Bracket | Male | Female |
| Under 5 Years | 0 (0.0%) | 0 (0.0%) |
| 5 to 17 Years | 57 (8.8%) | 17 (4.6%) |
| 18 to 34 Years | 180 (31.4%) | 50 (10.1%) |
| 35 to 64 Years | 202 (21.8%) | 219 (18.1%) |
| 65 to 74 Years | 101 (51.8%) | 129 (45.3%) |
| 75 Years and over | 95 (94.1%) | 86 (46.5%) |
Disability Class by Sex by Age in Warren
Disability Class: Hearing Difficulty
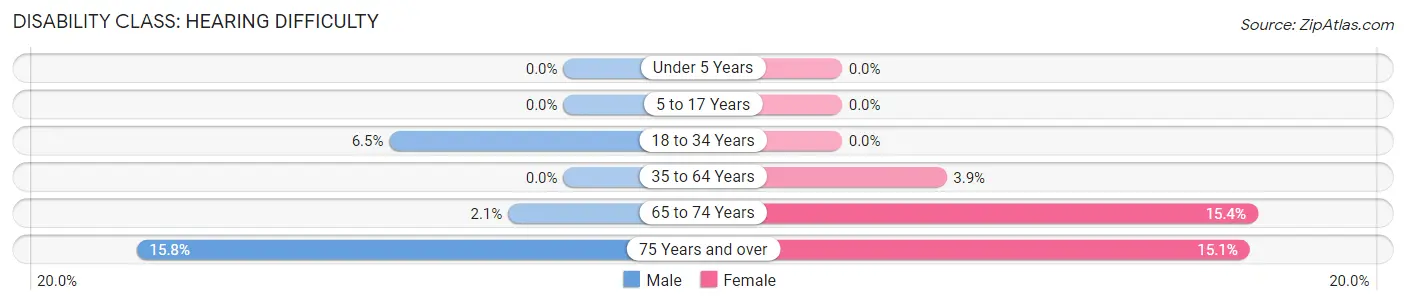
| Age Bracket | Male | Female |
| Under 5 Years | 0 (0.0%) | 0 (0.0%) |
| 5 to 17 Years | 0 (0.0%) | 0 (0.0%) |
| 18 to 34 Years | 37 (6.5%) | 0 (0.0%) |
| 35 to 64 Years | 0 (0.0%) | 47 (3.9%) |
| 65 to 74 Years | 4 (2.1%) | 44 (15.4%) |
| 75 Years and over | 16 (15.8%) | 28 (15.1%) |
Disability Class: Vision Difficulty
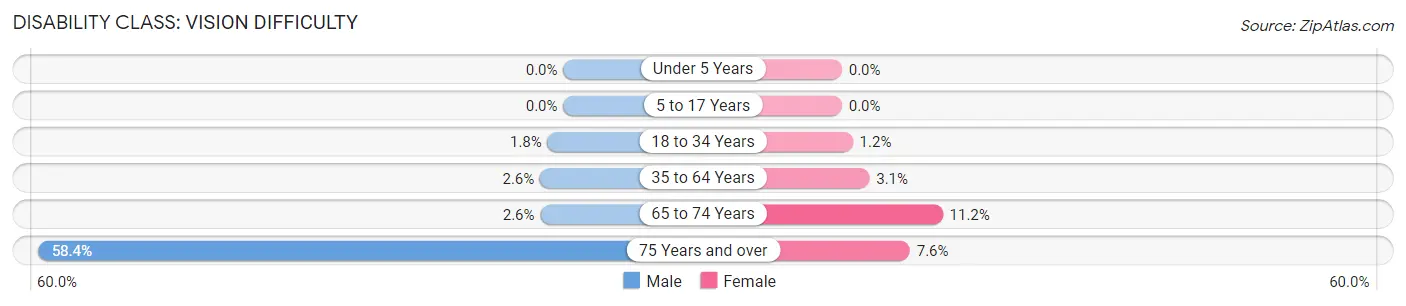
| Age Bracket | Male | Female |
| Under 5 Years | 0 (0.0%) | 0 (0.0%) |
| 5 to 17 Years | 0 (0.0%) | 0 (0.0%) |
| 18 to 34 Years | 10 (1.8%) | 6 (1.2%) |
| 35 to 64 Years | 24 (2.6%) | 37 (3.1%) |
| 65 to 74 Years | 5 (2.6%) | 32 (11.2%) |
| 75 Years and over | 59 (58.4%) | 14 (7.6%) |
Disability Class: Cognitive Difficulty
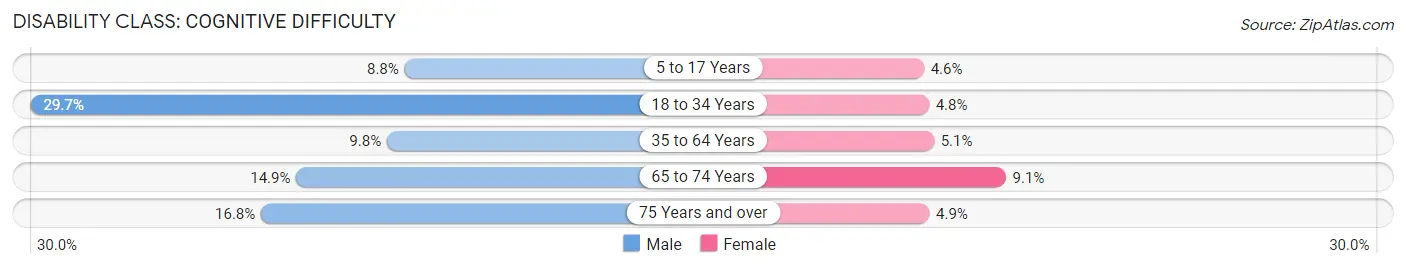
| Age Bracket | Male | Female |
| 5 to 17 Years | 57 (8.8%) | 17 (4.6%) |
| 18 to 34 Years | 170 (29.7%) | 24 (4.8%) |
| 35 to 64 Years | 91 (9.8%) | 62 (5.1%) |
| 65 to 74 Years | 29 (14.9%) | 26 (9.1%) |
| 75 Years and over | 17 (16.8%) | 9 (4.9%) |
Disability Class: Ambulatory Difficulty
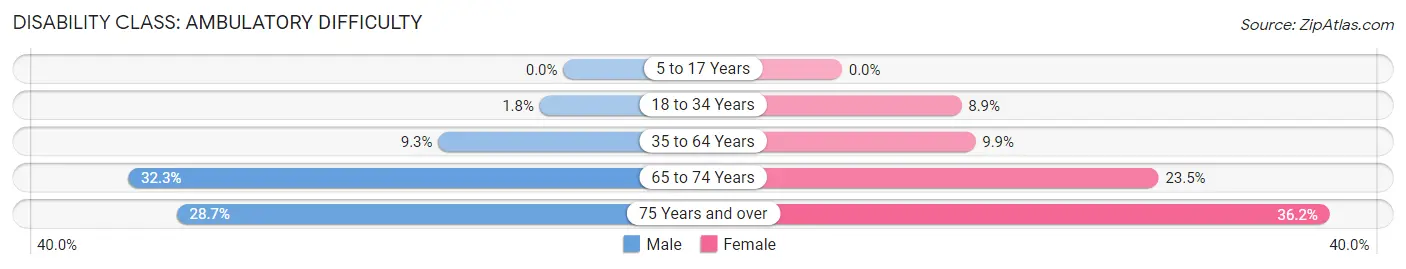
| Age Bracket | Male | Female |
| 5 to 17 Years | 0 (0.0%) | 0 (0.0%) |
| 18 to 34 Years | 10 (1.8%) | 44 (8.9%) |
| 35 to 64 Years | 86 (9.3%) | 120 (9.9%) |
| 65 to 74 Years | 63 (32.3%) | 67 (23.5%) |
| 75 Years and over | 29 (28.7%) | 67 (36.2%) |
Disability Class: Self-Care Difficulty
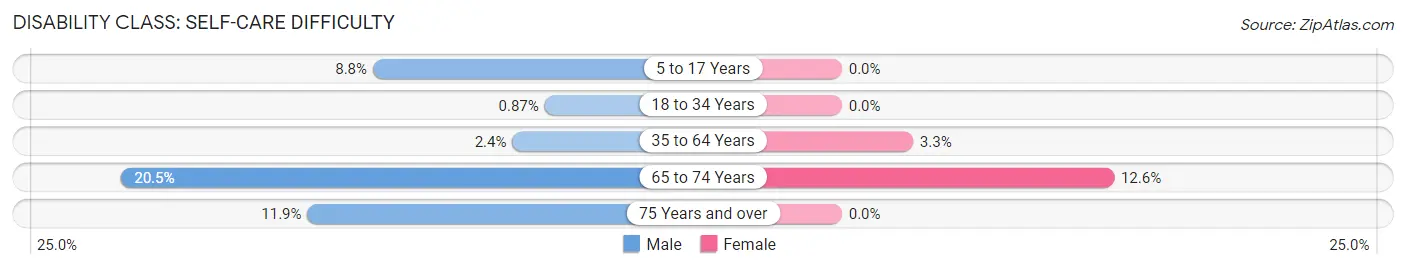
| Age Bracket | Male | Female |
| 5 to 17 Years | 57 (8.8%) | 0 (0.0%) |
| 18 to 34 Years | 5 (0.9%) | 0 (0.0%) |
| 35 to 64 Years | 22 (2.4%) | 40 (3.3%) |
| 65 to 74 Years | 40 (20.5%) | 36 (12.6%) |
| 75 Years and over | 12 (11.9%) | 0 (0.0%) |
Technology Access in Warren
Computing Device Access in Warren
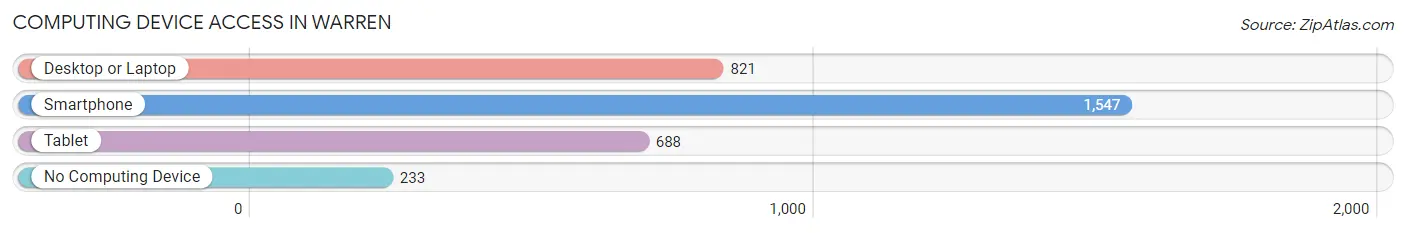
| Device Type | # Households | % Households |
| Desktop or Laptop | 821 | 44.1% |
| Smartphone | 1,547 | 83.1% |
| Tablet | 688 | 36.9% |
| No Computing Device | 233 | 12.5% |
| Total | 1,862 | 100.0% |
Internet Access in Warren
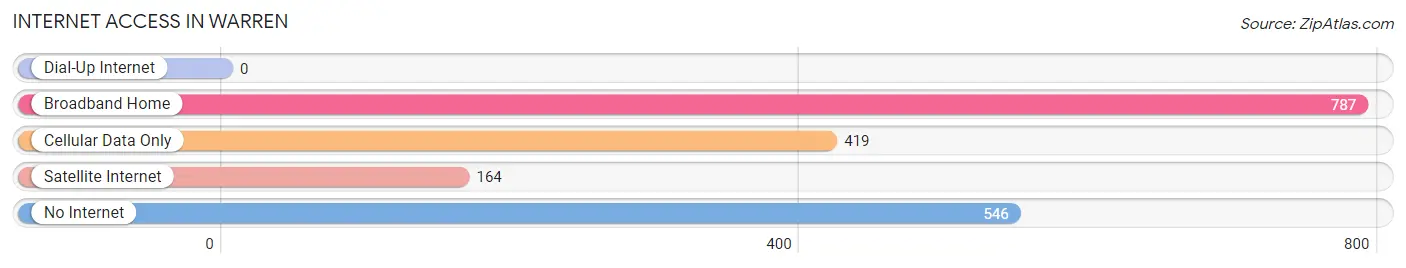
| Internet Type | # Households | % Households |
| Dial-Up Internet | 0 | 0.0% |
| Broadband Home | 787 | 42.3% |
| Cellular Data Only | 419 | 22.5% |
| Satellite Internet | 164 | 8.8% |
| No Internet | 546 | 29.3% |
| Total | 1,862 | 100.0% |
Warren Summary
Warren, Arkansas is a small city located in Bradley County in the southeastern corner of the state. It is the county seat and the largest city in the county. The city is situated on the banks of the Saline River and is surrounded by the Ouachita National Forest. The city has a population of approximately 5,000 people and is part of the Pine Bluff Metropolitan Statistical Area.
History
The area that is now Warren was first settled in the early 1800s by settlers from the nearby town of Monticello. The town was originally known as “Mudtown” due to the muddy conditions of the area. In 1837, the town was renamed Warren in honor of the first postmaster, William Warren.
In 1883, the St. Louis, Iron Mountain and Southern Railway built a line through Warren, connecting it to the larger cities of Little Rock and Memphis. This allowed the town to become a major shipping center for the region. The railroad also brought new businesses and industries to the area, including a sawmill, a cotton gin, and a brick factory.
In the early 1900s, Warren experienced a period of growth and prosperity. The town was incorporated in 1906 and the population grew to over 1,000 people. The town also became a center for education, with the establishment of the Warren Academy in 1908.
Geography
Warren is located in the southeastern corner of Arkansas, in Bradley County. The city is situated on the banks of the Saline River and is surrounded by the Ouachita National Forest. The city has a total area of 4.2 square miles, all of which is land.
The climate in Warren is humid subtropical, with hot, humid summers and mild winters. The average annual temperature is 64°F, with an average high of 87°F in the summer and an average low of 41°F in the winter. The average annual precipitation is 48 inches.
Economy
The economy of Warren is largely based on agriculture and forestry. The city is home to several large farms, as well as a number of timber companies. The city is also home to several manufacturing companies, including a furniture factory and a paper mill.
The city is also home to a number of retail stores, restaurants, and other businesses. The city is served by the Warren Municipal Airport, which provides air service to the surrounding area.
Demographics
As of the 2010 census, the population of Warren was 5,039. The racial makeup of the city was 73.3% White, 22.2% African American, 0.3% Native American, 0.5% Asian, 0.1% Pacific Islander, and 3.6% from other races. Hispanic or Latino of any race were 2.2% of the population.
The median household income in Warren was $30,938, and the median family income was $37,917. The per capita income was $17,845. About 17.3% of the population was below the poverty line.
Common Questions
What is the Total Population of Warren?
Total Population of Warren is 5,409.
What is the Total Male Population of Warren?
Total Male Population of Warren is 2,681.
What is the Total Female Population of Warren?
Total Female Population of Warren is 2,728.
What is the Ratio of Males per 100 Females in Warren?
There are 98.28 Males per 100 Females in Warren.
What is the Ratio of Females per 100 Males in Warren?
There are 101.75 Females per 100 Males in Warren.
What is the Median Population Age in Warren?
Median Population Age in Warren is 38.0 Years.
What is the Average Family Size in Warren
Average Family Size in Warren is 4.2 People.
What is the Average Household Size in Warren
Average Household Size in Warren is 2.9 People.
What is Per Capita Income in Warren?
Per Capita income in Warren is $21,120.
What is the Median Family Income in Warren?
Median Family Income in Warren is $48,125.
What is the Median Household income in Warren?
Median Household Income in Warren is $39,222.
What is Income or Wage Gap in Warren?
Income or Wage Gap in Warren is 38.4%.
Women in Warren earn 61.6 cents for every dollar earned by a man.
What is Family Income Deficit in Warren?
Family Income Deficit in Warren is $8,289.
Families that are below poverty line in Warren earn $8,289 less on average than the poverty threshold level.
What is Inequality or Gini Index in Warren?
Inequality or Gini Index in Warren is 0.47.
How Large is the Labor Force in Warren?
There are 2,087 People in the Labor Forcein in Warren.
What is the Percentage of People in the Labor Force in Warren?
51.3% of People are in the Labor Force in Warren.
What is the Unemployment Rate in Warren?
Unemployment Rate in Warren is 4.4%.