Zip Code 72386 Map & Demographics
Zip Code 72386 Map
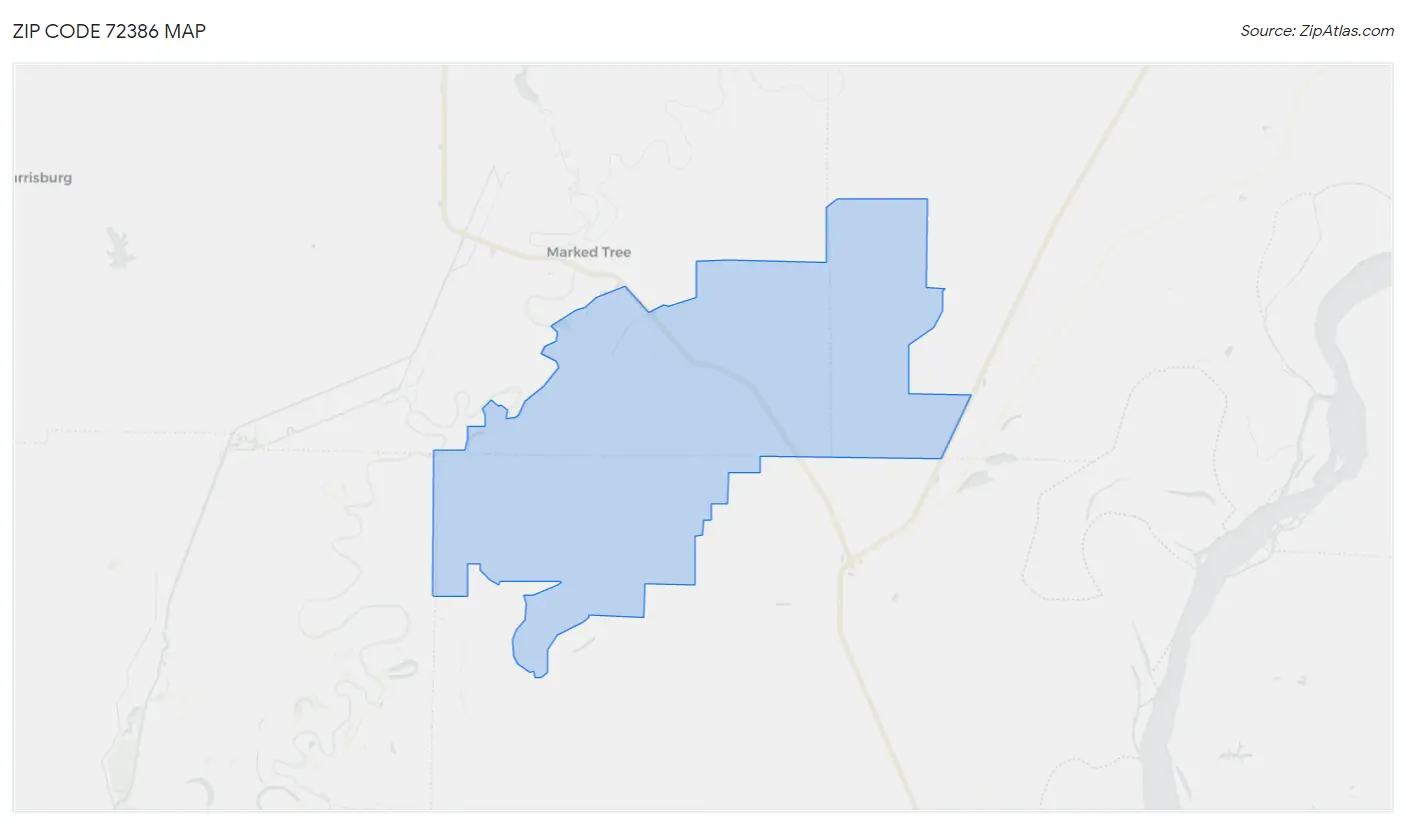
Zip Code 72386 Overview
$27,996
PER CAPITA INCOME
$79,063
AVG FAMILY INCOME
$50,096
AVG HOUSEHOLD INCOME
26.1%
WAGE / INCOME GAP [ % ]
73.9¢/ $1
WAGE / INCOME GAP [ $ ]
$11,534
FAMILY INCOME DEFICIT
0.43
INEQUALITY / GINI INDEX
1,551
TOTAL POPULATION
850
MALE POPULATION
701
FEMALE POPULATION
121.26
MALES / 100 FEMALES
82.47
FEMALES / 100 MALES
41.7
MEDIAN AGE
3.4
AVG FAMILY SIZE
2.7
AVG HOUSEHOLD SIZE
794
LABOR FORCE [ PEOPLE ]
64.9%
PERCENT IN LABOR FORCE
4.3%
UNEMPLOYMENT RATE
Zip Code 72386 Area Codes
Income in Zip Code 72386
Income Overview in Zip Code 72386
Per Capita Income in Zip Code 72386 is $27,996, while median incomes of families and households are $79,063 and $50,096 respectively.
| Characteristic | Number | Measure |
| Per Capita Income | 1,551 | $27,996 |
| Median Family Income | 408 | $79,063 |
| Mean Family Income | 408 | $87,863 |
| Median Household Income | 571 | $50,096 |
| Mean Household Income | 571 | $71,654 |
| Income Deficit | 408 | $11,534 |
| Wage / Income Gap (%) | 1,551 | 26.14% |
| Wage / Income Gap ($) | 1,551 | 73.86¢ per $1 |
| Gini / Inequality Index | 1,551 | 0.43 |
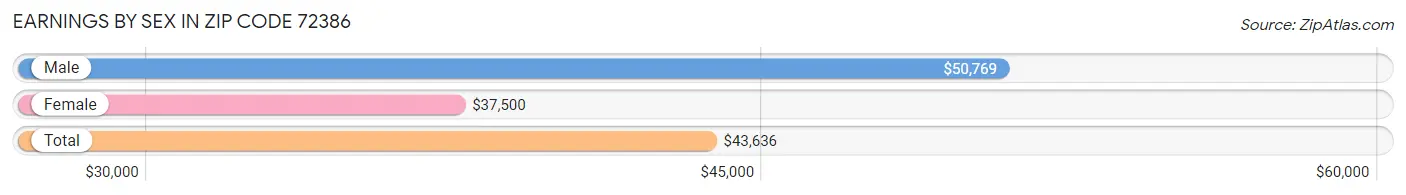
Earnings by Sex in Zip Code 72386
Average Earnings in Zip Code 72386 are $43,636, $50,769 for men and $37,500 for women, a difference of 26.1%.
| Sex | Number | Average Earnings |
| Male | 442 (53.9%) | $50,769 |
| Female | 378 (46.1%) | $37,500 |
| Total | 820 (100.0%) | $43,636 |
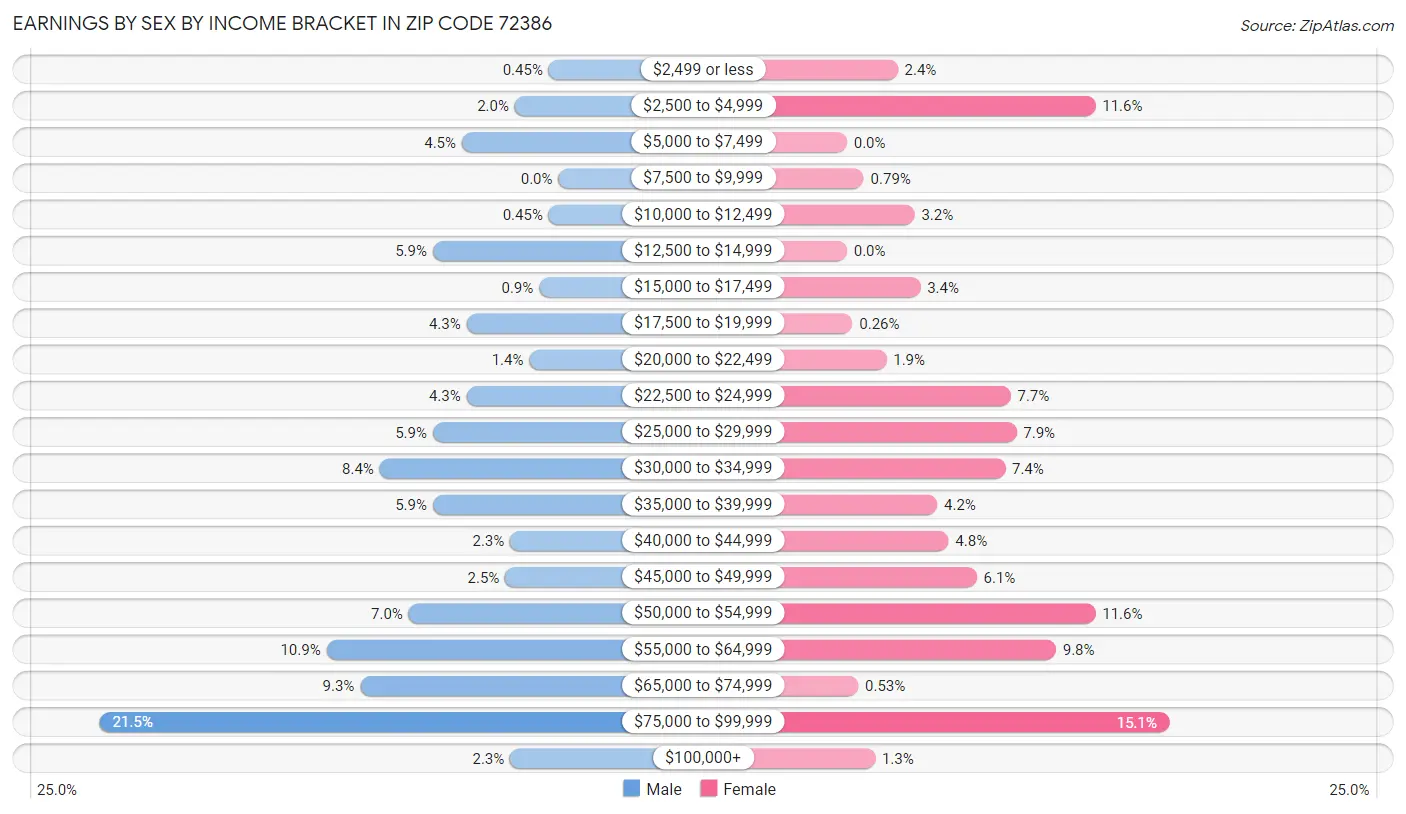
Earnings by Sex by Income Bracket in Zip Code 72386
The most common earnings brackets in Zip Code 72386 are $75,000 to $99,999 for men (95 | 21.5%) and $75,000 to $99,999 for women (57 | 15.1%).
| Income | Male | Female |
| $2,499 or less | 2 (0.4%) | 9 (2.4%) |
| $2,500 to $4,999 | 9 (2.0%) | 44 (11.6%) |
| $5,000 to $7,499 | 20 (4.5%) | 0 (0.0%) |
| $7,500 to $9,999 | 0 (0.0%) | 3 (0.8%) |
| $10,000 to $12,499 | 2 (0.4%) | 12 (3.2%) |
| $12,500 to $14,999 | 26 (5.9%) | 0 (0.0%) |
| $15,000 to $17,499 | 4 (0.9%) | 13 (3.4%) |
| $17,500 to $19,999 | 19 (4.3%) | 1 (0.3%) |
| $20,000 to $22,499 | 6 (1.4%) | 7 (1.8%) |
| $22,500 to $24,999 | 19 (4.3%) | 29 (7.7%) |
| $25,000 to $29,999 | 26 (5.9%) | 30 (7.9%) |
| $30,000 to $34,999 | 37 (8.4%) | 28 (7.4%) |
| $35,000 to $39,999 | 26 (5.9%) | 16 (4.2%) |
| $40,000 to $44,999 | 10 (2.3%) | 18 (4.8%) |
| $45,000 to $49,999 | 11 (2.5%) | 23 (6.1%) |
| $50,000 to $54,999 | 31 (7.0%) | 44 (11.6%) |
| $55,000 to $64,999 | 48 (10.9%) | 37 (9.8%) |
| $65,000 to $74,999 | 41 (9.3%) | 2 (0.5%) |
| $75,000 to $99,999 | 95 (21.5%) | 57 (15.1%) |
| $100,000+ | 10 (2.3%) | 5 (1.3%) |
| Total | 442 (100.0%) | 378 (100.0%) |
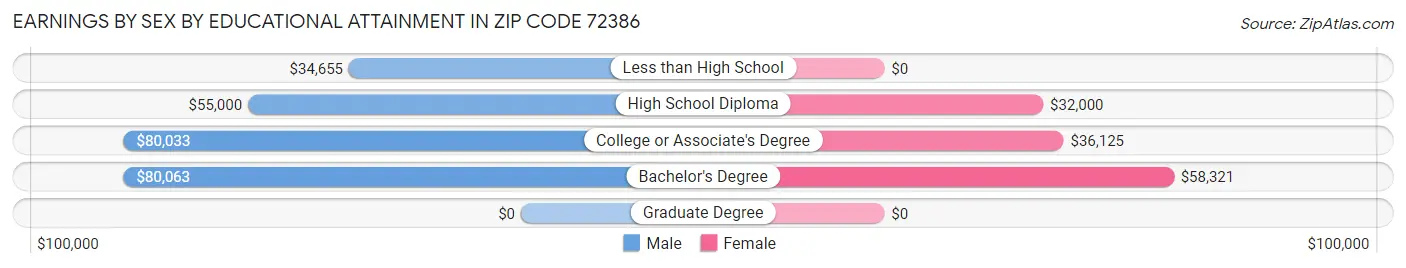
Earnings by Sex by Educational Attainment in Zip Code 72386
Average earnings in Zip Code 72386 are $53,611 for men and $40,083 for women, a difference of 25.2%. Men with an educational attainment of bachelor's degree enjoy the highest average annual earnings of $80,063, while those with less than high school education earn the least with $34,655. Women with an educational attainment of bachelor's degree earn the most with the average annual earnings of $58,321, while those with high school diploma education have the smallest earnings of $32,000.
| Educational Attainment | Male Income | Female Income |
| Less than High School | $34,655 | $0 |
| High School Diploma | $55,000 | $32,000 |
| College or Associate's Degree | $80,033 | $36,125 |
| Bachelor's Degree | $80,063 | $58,321 |
| Graduate Degree | - | - |
| Total | $53,611 | $40,083 |
Family Income in Zip Code 72386
Family Income Brackets in Zip Code 72386
According to the Zip Code 72386 family income data, there are 87 families falling into the $150,000 to $199,999 income range, which is the most common income bracket and makes up 21.3% of all families. Conversely, the less than $10,000 income bracket is the least frequent group with only 1 families (0.3%) belonging to this category.
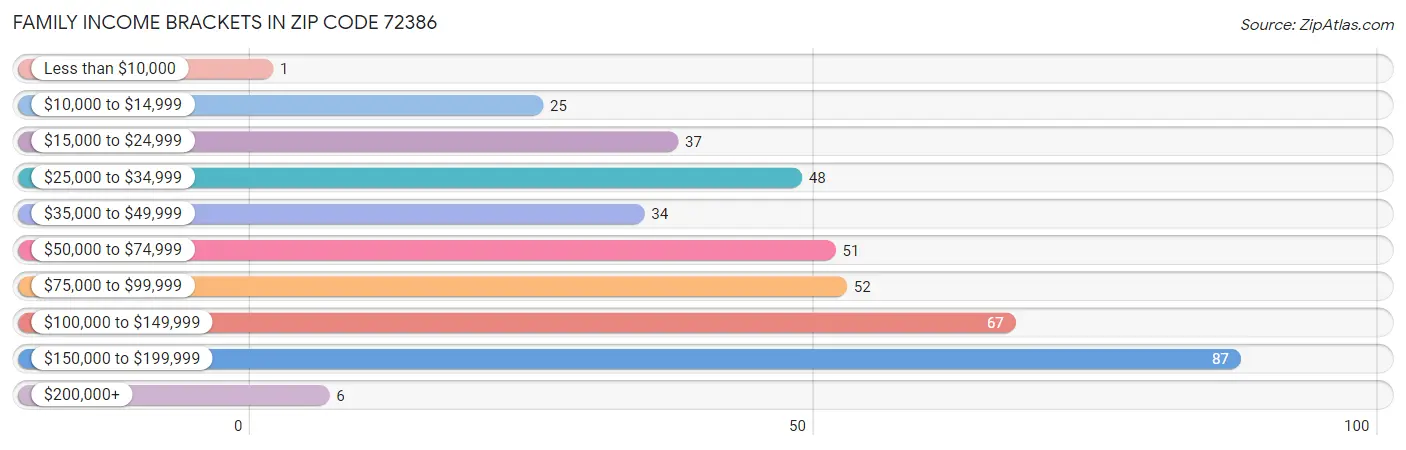
| Income Bracket | # Families | % Families |
| Less than $10,000 | 1 | 0.2% |
| $10,000 to $14,999 | 25 | 6.1% |
| $15,000 to $24,999 | 37 | 9.1% |
| $25,000 to $34,999 | 48 | 11.8% |
| $35,000 to $49,999 | 34 | 8.3% |
| $50,000 to $74,999 | 51 | 12.5% |
| $75,000 to $99,999 | 52 | 12.7% |
| $100,000 to $149,999 | 67 | 16.4% |
| $150,000 to $199,999 | 87 | 21.3% |
| $200,000+ | 6 | 1.5% |
Family Income by Famaliy Size in Zip Code 72386
4-person families (113 | 27.7%) account for the highest median family income in Zip Code 72386 with $165,046 per family, while 4-person families (113 | 27.7%) have the highest median income of $41,262 per family member.
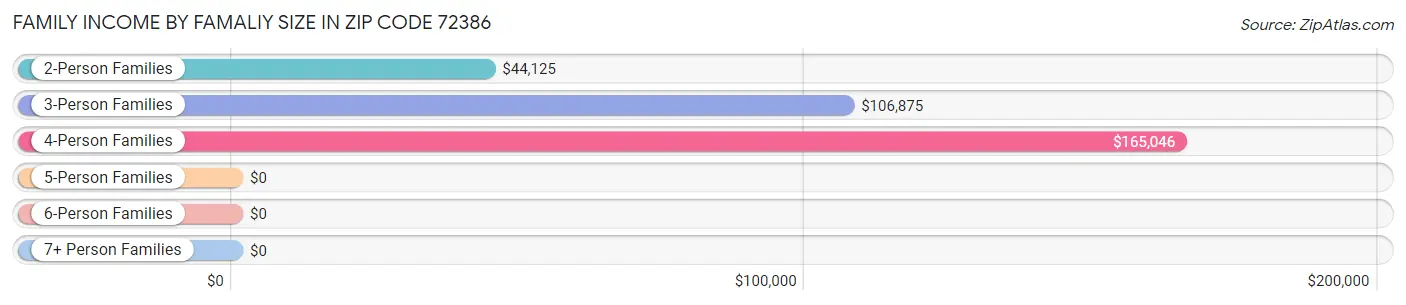
| Income Bracket | # Families | Median Income |
| 2-Person Families | 155 (38.0%) | $44,125 |
| 3-Person Families | 109 (26.7%) | $106,875 |
| 4-Person Families | 113 (27.7%) | $165,046 |
| 5-Person Families | 25 (6.1%) | $0 |
| 6-Person Families | 0 (0.0%) | $0 |
| 7+ Person Families | 6 (1.5%) | $0 |
| Total | 408 (100.0%) | $79,063 |
Family Income by Number of Earners in Zip Code 72386
The median family income in Zip Code 72386 is $79,063, with families comprising 3+ earners (54) having the highest median family income of $153,750, while families with no earners (53) have the lowest median family income of $29,750, accounting for 13.2% and 13.0% of families, respectively.
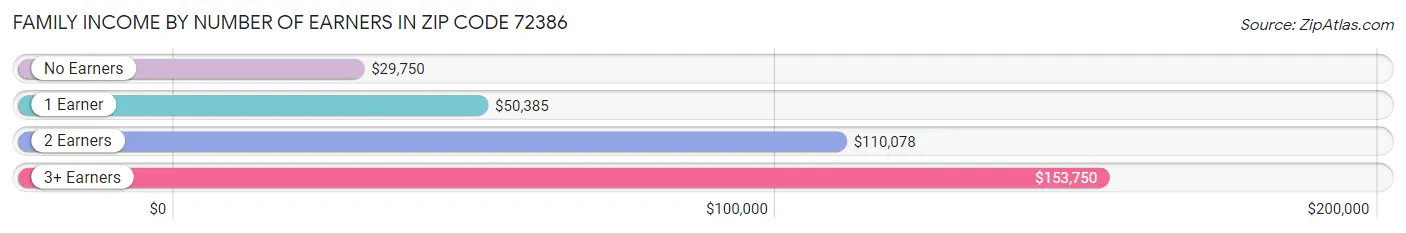
| Number of Earners | # Families | Median Income |
| No Earners | 53 (13.0%) | $29,750 |
| 1 Earner | 116 (28.4%) | $50,385 |
| 2 Earners | 185 (45.3%) | $110,078 |
| 3+ Earners | 54 (13.2%) | $153,750 |
| Total | 408 (100.0%) | $79,063 |
Household Income in Zip Code 72386
Household Income Brackets in Zip Code 72386
With 88 households falling in the category, the $25,000 to $34,999 income range is the most frequent in Zip Code 72386, accounting for 15.4% of all households. In contrast, only 6 households (1.1%) fall into the $200,000+ income bracket, making it the least populous group.
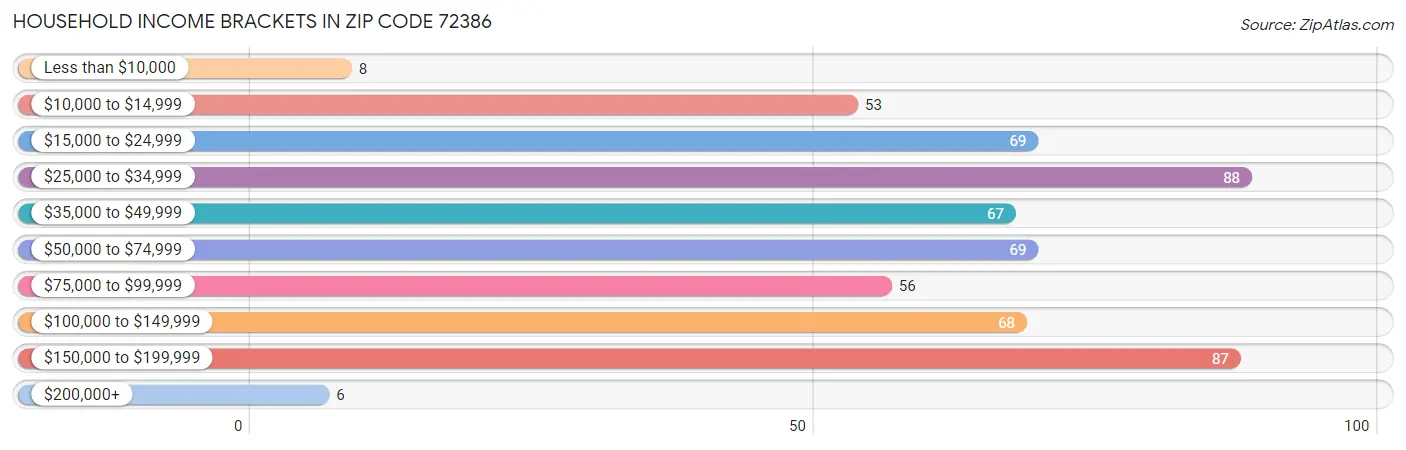
| Income Bracket | # Households | % Households |
| Less than $10,000 | 8 | 1.4% |
| $10,000 to $14,999 | 53 | 9.3% |
| $15,000 to $24,999 | 69 | 12.1% |
| $25,000 to $34,999 | 88 | 15.4% |
| $35,000 to $49,999 | 67 | 11.7% |
| $50,000 to $74,999 | 69 | 12.1% |
| $75,000 to $99,999 | 56 | 9.8% |
| $100,000 to $149,999 | 68 | 11.9% |
| $150,000 to $199,999 | 87 | 15.2% |
| $200,000+ | 6 | 1.1% |
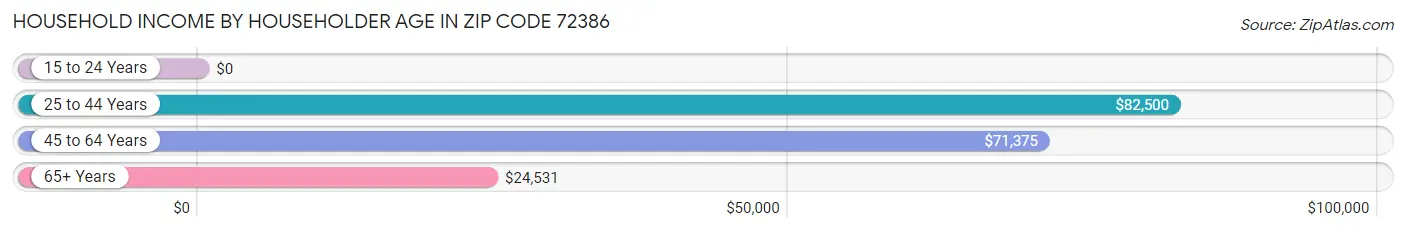
Household Income by Householder Age in Zip Code 72386
The median household income in Zip Code 72386 is $50,096, with the highest median household income of $82,500 found in the 25 to 44 years age bracket for the primary householder. A total of 148 households (25.9%) fall into this category. Meanwhile, the 15 to 24 years age bracket for the primary householder has the lowest median household income of $0, with 11 households (1.9%) in this group.
| Income Bracket | # Households | Median Income |
| 15 to 24 Years | 11 (1.9%) | $0 |
| 25 to 44 Years | 148 (25.9%) | $82,500 |
| 45 to 64 Years | 267 (46.8%) | $71,375 |
| 65+ Years | 145 (25.4%) | $24,531 |
| Total | 571 (100.0%) | $50,096 |
Poverty in Zip Code 72386
Income Below Poverty by Sex and Age in Zip Code 72386
With 21.8% poverty level for males and 16.3% for females among the residents of Zip Code 72386, 15 year old males and 25 to 34 year old females are the most vulnerable to poverty, with 10 males (100.0%) and 33 females (50.0%) in their respective age groups living below the poverty level.
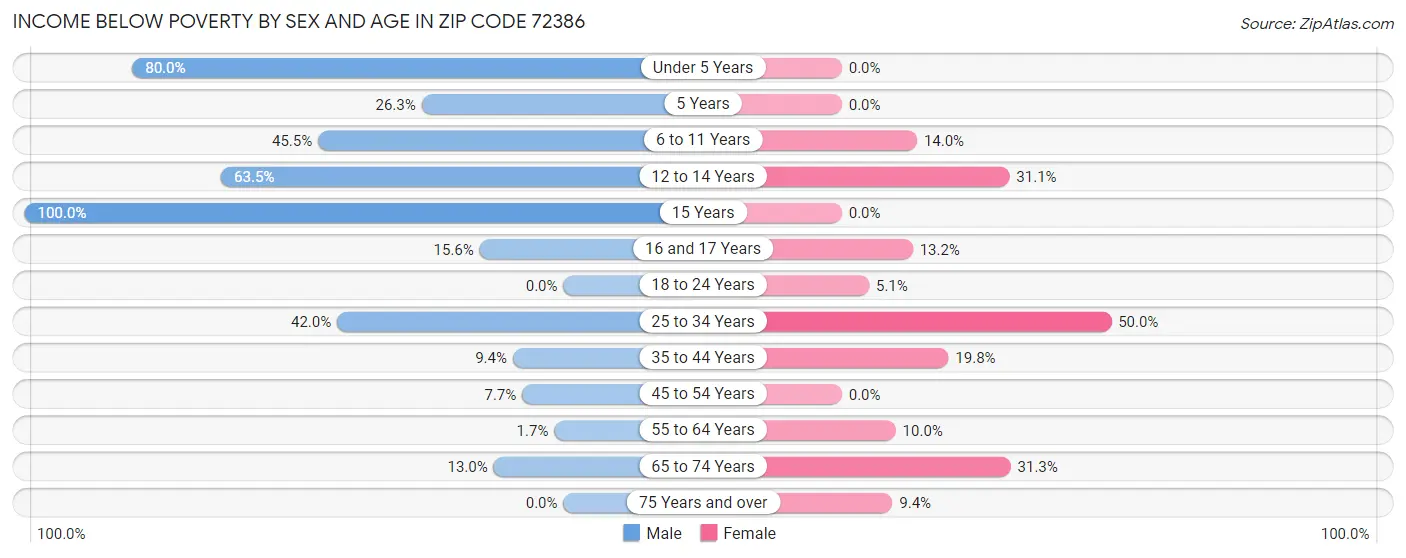
| Age Bracket | Male | Female |
| Under 5 Years | 12 (80.0%) | 0 (0.0%) |
| 5 Years | 5 (26.3%) | 0 (0.0%) |
| 6 to 11 Years | 51 (45.5%) | 6 (14.0%) |
| 12 to 14 Years | 47 (63.5%) | 14 (31.1%) |
| 15 Years | 10 (100.0%) | 0 (0.0%) |
| 16 and 17 Years | 7 (15.6%) | 5 (13.2%) |
| 18 to 24 Years | 0 (0.0%) | 4 (5.1%) |
| 25 to 34 Years | 21 (42.0%) | 33 (50.0%) |
| 35 to 44 Years | 9 (9.4%) | 19 (19.8%) |
| 45 to 54 Years | 14 (7.6%) | 0 (0.0%) |
| 55 to 64 Years | 2 (1.7%) | 6 (10.0%) |
| 65 to 74 Years | 7 (13.0%) | 21 (31.3%) |
| 75 Years and over | 0 (0.0%) | 6 (9.4%) |
| Total | 185 (21.8%) | 114 (16.3%) |
Income Above Poverty by Sex and Age in Zip Code 72386
According to the poverty statistics in Zip Code 72386, males aged 18 to 24 years and females aged under 5 years are the age groups that are most secure financially, with 100.0% of males and 100.0% of females in these age groups living above the poverty line.
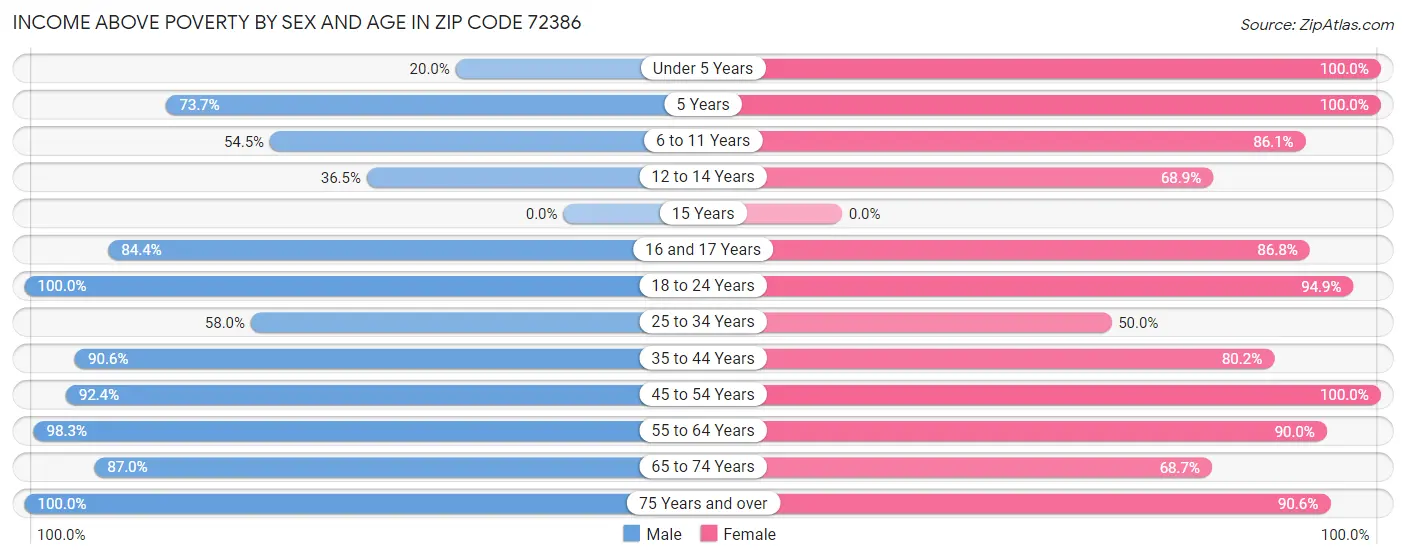
| Age Bracket | Male | Female |
| Under 5 Years | 3 (20.0%) | 6 (100.0%) |
| 5 Years | 14 (73.7%) | 3 (100.0%) |
| 6 to 11 Years | 61 (54.5%) | 37 (86.1%) |
| 12 to 14 Years | 27 (36.5%) | 31 (68.9%) |
| 15 Years | 0 (0.0%) | 0 (0.0%) |
| 16 and 17 Years | 38 (84.4%) | 33 (86.8%) |
| 18 to 24 Years | 59 (100.0%) | 75 (94.9%) |
| 25 to 34 Years | 29 (58.0%) | 33 (50.0%) |
| 35 to 44 Years | 87 (90.6%) | 77 (80.2%) |
| 45 to 54 Years | 169 (92.3%) | 134 (100.0%) |
| 55 to 64 Years | 116 (98.3%) | 54 (90.0%) |
| 65 to 74 Years | 47 (87.0%) | 46 (68.7%) |
| 75 Years and over | 15 (100.0%) | 58 (90.6%) |
| Total | 665 (78.2%) | 587 (83.7%) |
Income Below Poverty Among Married-Couple Families in Zip Code 72386
The poverty statistics for married-couple families in Zip Code 72386 show that 12.8% or 42 of the total 329 families live below the poverty line. Families with 3 or 4 children have the highest poverty rate of 100.0%, comprising of 15 families. On the other hand, families with no children have the lowest poverty rate of 1.5%, which includes 2 families.
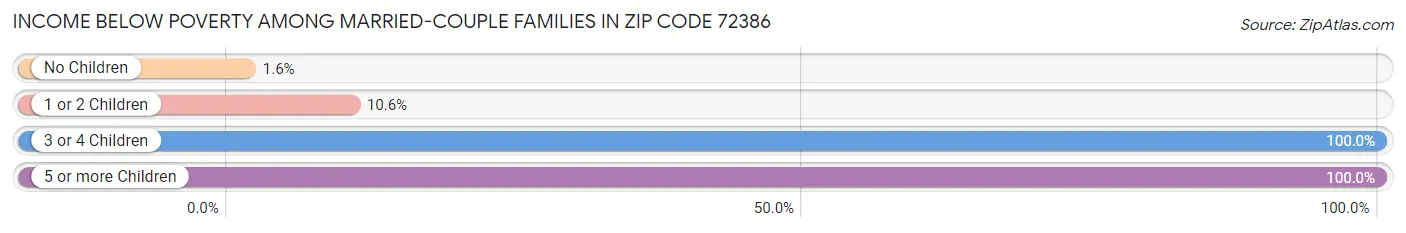
| Children | Above Poverty | Below Poverty |
| No Children | 127 (98.5%) | 2 (1.5%) |
| 1 or 2 Children | 160 (89.4%) | 19 (10.6%) |
| 3 or 4 Children | 0 (0.0%) | 15 (100.0%) |
| 5 or more Children | 0 (0.0%) | 6 (100.0%) |
| Total | 287 (87.2%) | 42 (12.8%) |
Income Below Poverty Among Single-Parent Households in Zip Code 72386
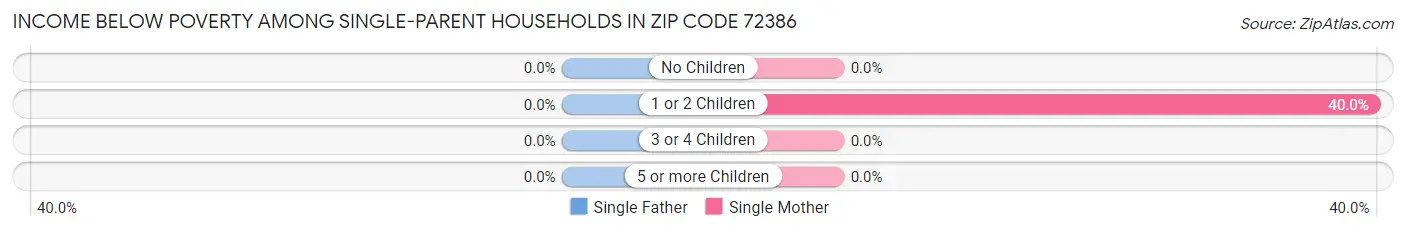
| Children | Single Father | Single Mother |
| No Children | 0 (0.0%) | 0 (0.0%) |
| 1 or 2 Children | 0 (0.0%) | 14 (40.0%) |
| 3 or 4 Children | 0 (0.0%) | 0 (0.0%) |
| 5 or more Children | 0 (0.0%) | 0 (0.0%) |
| Total | 0 (0.0%) | 14 (23.3%) |
Income Below Poverty Among Married-Couple vs Single-Parent Households in Zip Code 72386
The poverty data for Zip Code 72386 shows that 42 of the married-couple family households (12.8%) and 14 of the single-parent households (17.7%) are living below the poverty level. Within the married-couple family households, those with 3 or 4 children have the highest poverty rate, with 15 households (100.0%) falling below the poverty line. Among the single-parent households, those with 1 or 2 children have the highest poverty rate, with 14 household (30.4%) living below poverty.
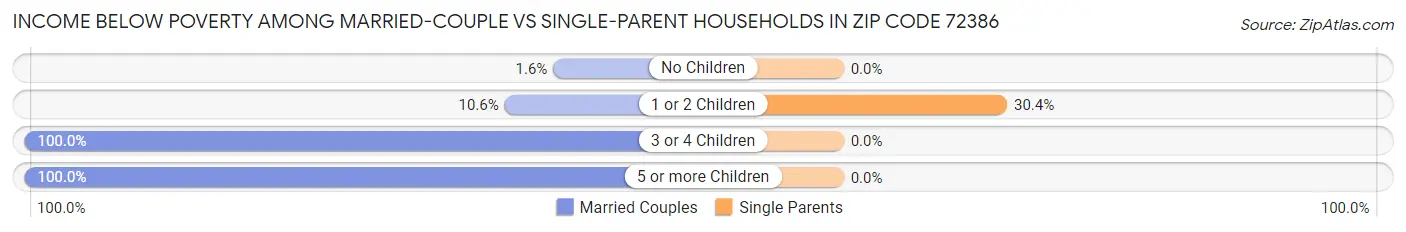
| Children | Married-Couple Families | Single-Parent Households |
| No Children | 2 (1.5%) | 0 (0.0%) |
| 1 or 2 Children | 19 (10.6%) | 14 (30.4%) |
| 3 or 4 Children | 15 (100.0%) | 0 (0.0%) |
| 5 or more Children | 6 (100.0%) | 0 (0.0%) |
| Total | 42 (12.8%) | 14 (17.7%) |
Race in Zip Code 72386
The most populous races in Zip Code 72386 are White / Caucasian (1,404 | 90.5%), Two or more Races (98 | 6.3%), and Black / African American (37 | 2.4%).
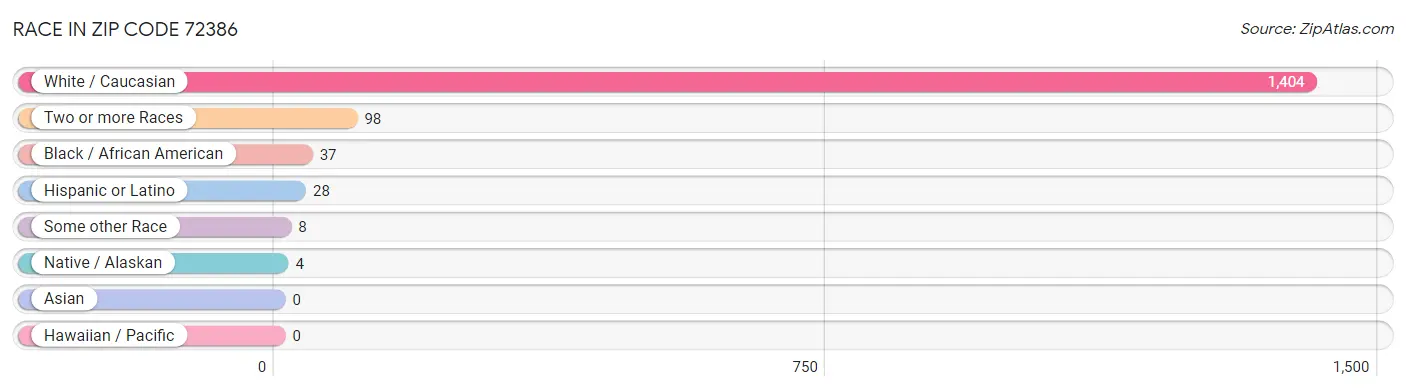
| Race | # Population | % Population |
| Asian | 0 | 0.0% |
| Black / African American | 37 | 2.4% |
| Hawaiian / Pacific | 0 | 0.0% |
| Hispanic or Latino | 28 | 1.8% |
| Native / Alaskan | 4 | 0.3% |
| White / Caucasian | 1,404 | 90.5% |
| Two or more Races | 98 | 6.3% |
| Some other Race | 8 | 0.5% |
| Total | 1,551 | 100.0% |
Ancestry in Zip Code 72386
The most populous ancestries reported in Zip Code 72386 are English (240 | 15.5%), American (224 | 14.4%), Irish (187 | 12.1%), British (73 | 4.7%), and German (51 | 3.3%), together accounting for 50.0% of all Zip Code 72386 residents.
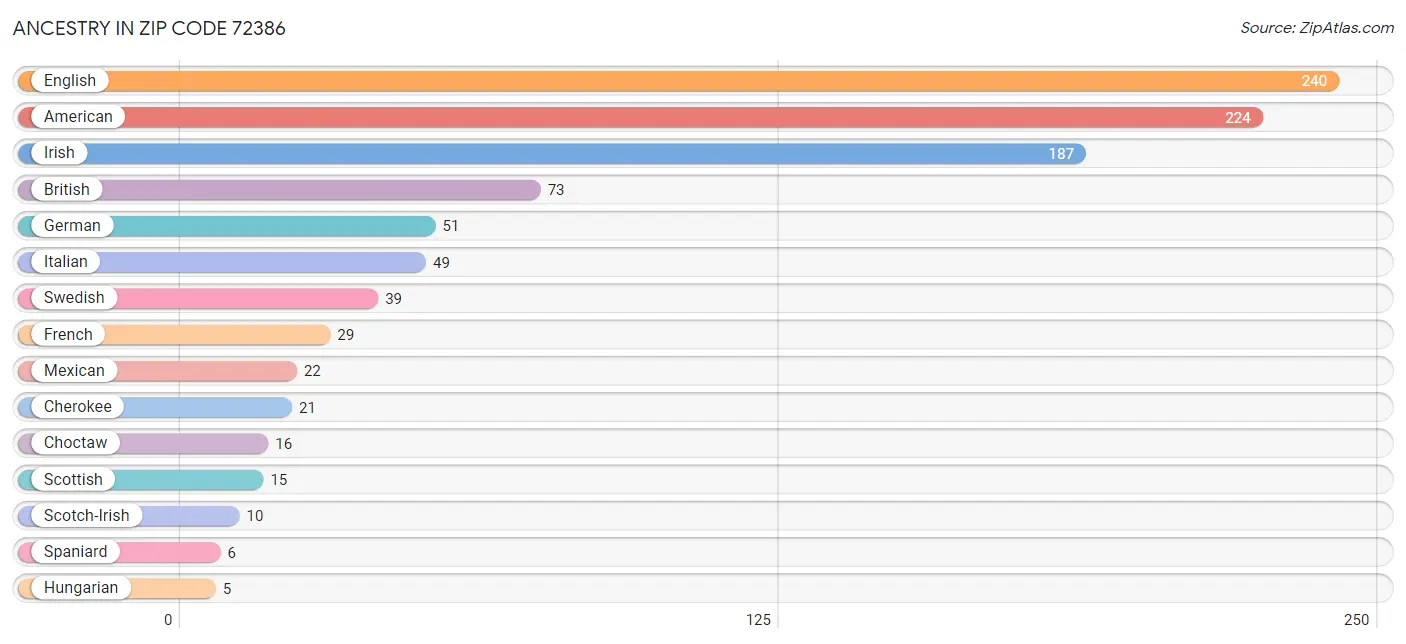
| Ancestry | # Population | % Population |
| American | 224 | 14.4% |
| British | 73 | 4.7% |
| Burmese | 2 | 0.1% |
| Cherokee | 21 | 1.3% |
| Choctaw | 16 | 1.0% |
| English | 240 | 15.5% |
| European | 4 | 0.3% |
| French | 29 | 1.9% |
| German | 51 | 3.3% |
| Hungarian | 5 | 0.3% |
| Irish | 187 | 12.1% |
| Italian | 49 | 3.2% |
| Mexican | 22 | 1.4% |
| Polish | 3 | 0.2% |
| Scotch-Irish | 10 | 0.6% |
| Scottish | 15 | 1.0% |
| Spaniard | 6 | 0.4% |
| Swedish | 39 | 2.5% | View All 18 Rows |
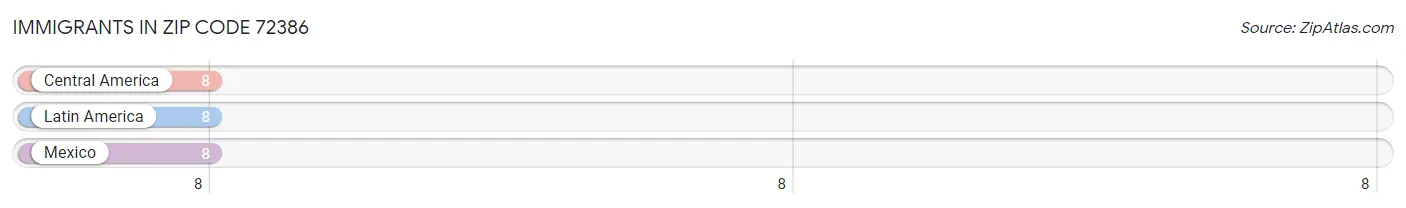
Immigrants in Zip Code 72386
The most numerous immigrant groups reported in Zip Code 72386 came from Central America (8 | 0.5%), Latin America (8 | 0.5%), and Mexico (8 | 0.5%), together accounting for 1.6% of all Zip Code 72386 residents.
| Immigration Origin | # Population | % Population |
| Central America | 8 | 0.5% |
| Latin America | 8 | 0.5% |
| Mexico | 8 | 0.5% | View All 3 Rows |
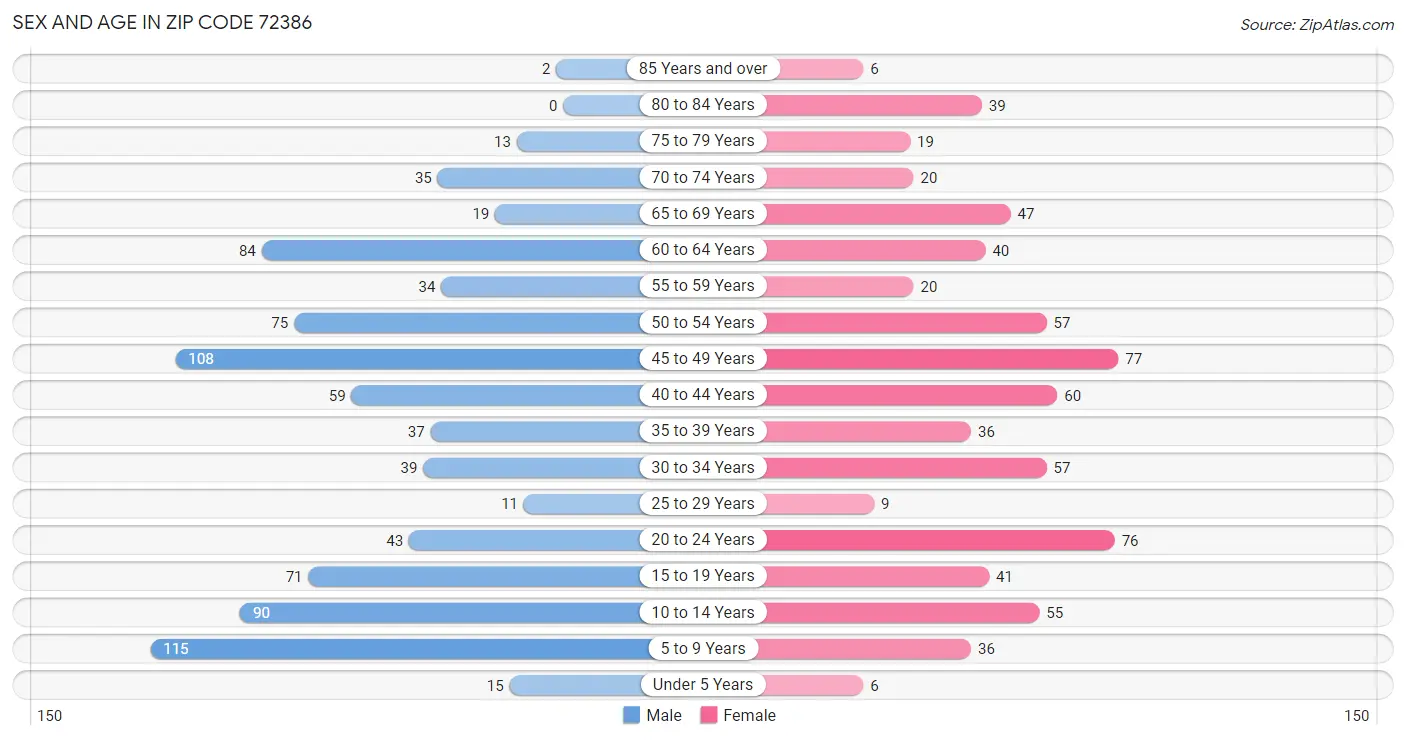
Sex and Age in Zip Code 72386
Sex and Age in Zip Code 72386
The most populous age groups in Zip Code 72386 are 5 to 9 Years (115 | 13.5%) for men and 45 to 49 Years (77 | 11.0%) for women.
| Age Bracket | Male | Female |
| Under 5 Years | 15 (1.8%) | 6 (0.9%) |
| 5 to 9 Years | 115 (13.5%) | 36 (5.1%) |
| 10 to 14 Years | 90 (10.6%) | 55 (7.9%) |
| 15 to 19 Years | 71 (8.4%) | 41 (5.9%) |
| 20 to 24 Years | 43 (5.1%) | 76 (10.8%) |
| 25 to 29 Years | 11 (1.3%) | 9 (1.3%) |
| 30 to 34 Years | 39 (4.6%) | 57 (8.1%) |
| 35 to 39 Years | 37 (4.3%) | 36 (5.1%) |
| 40 to 44 Years | 59 (6.9%) | 60 (8.6%) |
| 45 to 49 Years | 108 (12.7%) | 77 (11.0%) |
| 50 to 54 Years | 75 (8.8%) | 57 (8.1%) |
| 55 to 59 Years | 34 (4.0%) | 20 (2.9%) |
| 60 to 64 Years | 84 (9.9%) | 40 (5.7%) |
| 65 to 69 Years | 19 (2.2%) | 47 (6.7%) |
| 70 to 74 Years | 35 (4.1%) | 20 (2.9%) |
| 75 to 79 Years | 13 (1.5%) | 19 (2.7%) |
| 80 to 84 Years | 0 (0.0%) | 39 (5.6%) |
| 85 Years and over | 2 (0.2%) | 6 (0.9%) |
| Total | 850 (100.0%) | 701 (100.0%) |
Families and Households in Zip Code 72386
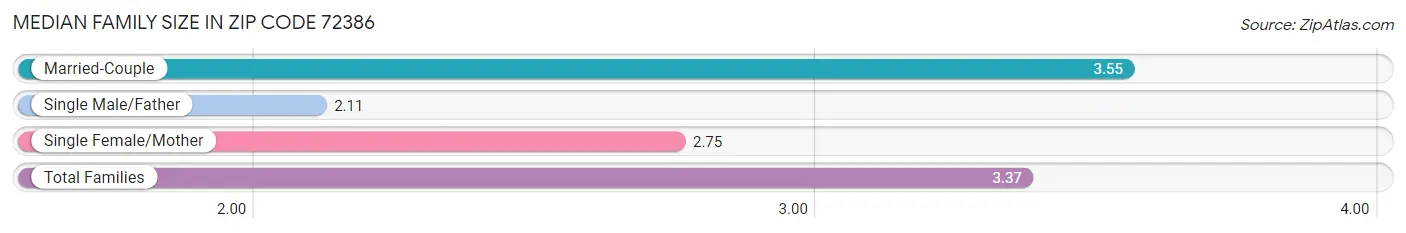
Median Family Size in Zip Code 72386
The median family size in Zip Code 72386 is 3.37 persons per family, with married-couple families (329 | 80.6%) accounting for the largest median family size of 3.55 persons per family. On the other hand, single male/father families (19 | 4.7%) represent the smallest median family size with 2.11 persons per family.
| Family Type | # Families | Family Size |
| Married-Couple | 329 (80.6%) | 3.55 |
| Single Male/Father | 19 (4.7%) | 2.11 |
| Single Female/Mother | 60 (14.7%) | 2.75 |
| Total Families | 408 (100.0%) | 3.37 |
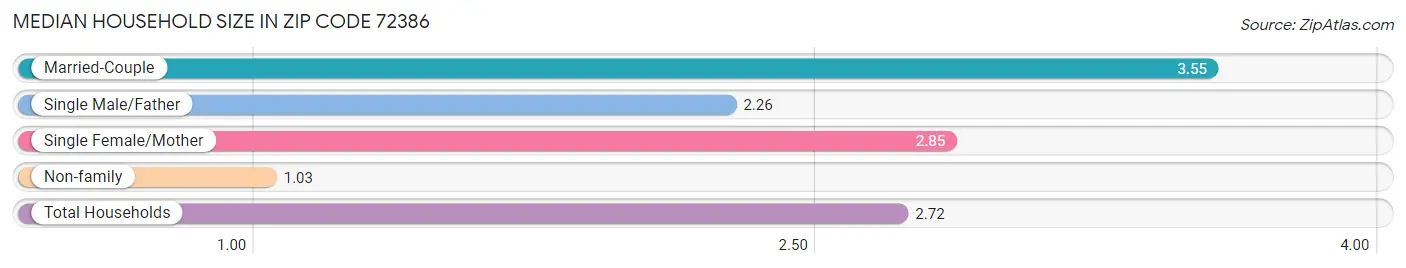
Median Household Size in Zip Code 72386
The median household size in Zip Code 72386 is 2.72 persons per household, with married-couple households (329 | 57.6%) accounting for the largest median household size of 3.55 persons per household. non-family households (163 | 28.5%) represent the smallest median household size with 1.03 persons per household.
| Household Type | # Households | Household Size |
| Married-Couple | 329 (57.6%) | 3.55 |
| Single Male/Father | 19 (3.3%) | 2.26 |
| Single Female/Mother | 60 (10.5%) | 2.85 |
| Non-family | 163 (28.5%) | 1.03 |
| Total Households | 571 (100.0%) | 2.72 |
Household Size by Marriage Status in Zip Code 72386
Out of a total of 571 households in Zip Code 72386, 408 (71.5%) are family households, while 163 (28.5%) are nonfamily households. The most numerous type of family households are 2-person households, comprising 152, and the most common type of nonfamily households are 1-person households, comprising 160.
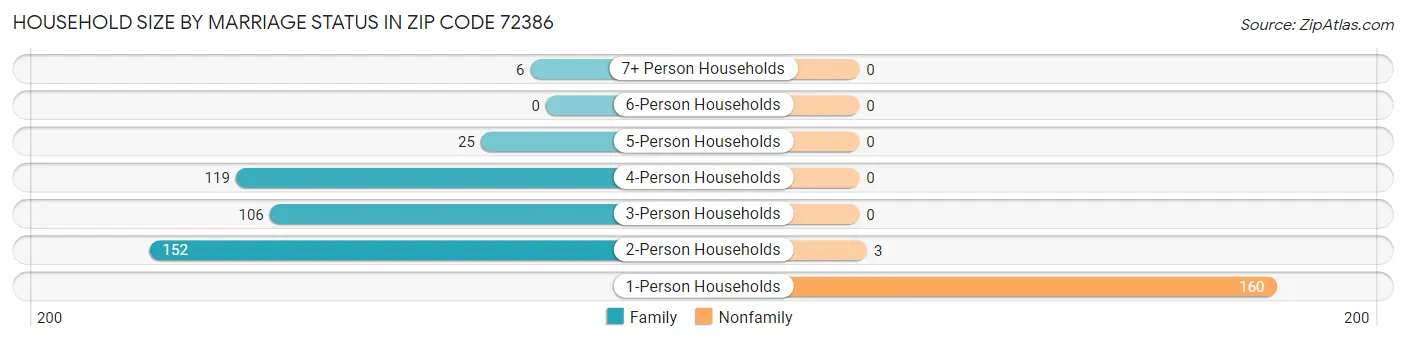
| Household Size | Family Households | Nonfamily Households |
| 1-Person Households | - | 160 (28.0%) |
| 2-Person Households | 152 (26.6%) | 3 (0.5%) |
| 3-Person Households | 106 (18.6%) | 0 (0.0%) |
| 4-Person Households | 119 (20.8%) | 0 (0.0%) |
| 5-Person Households | 25 (4.4%) | 0 (0.0%) |
| 6-Person Households | 0 (0.0%) | 0 (0.0%) |
| 7+ Person Households | 6 (1.1%) | 0 (0.0%) |
| Total | 408 (71.5%) | 163 (28.5%) |
Female Fertility in Zip Code 72386
Fertility by Age in Zip Code 72386
| Age Bracket | Women with Births | Births / 1,000 Women |
| 15 to 19 years | 0 (0.0%) | 0.0 |
| 20 to 34 years | 0 (0.0%) | 0.0 |
| 35 to 50 years | 0 (0.0%) | 0.0 |
| Total | 0 (0.0%) | 0.0 |
Fertility by Age by Marriage Status in Zip Code 72386
| Age Bracket | Married | Unmarried |
| 15 to 19 years | 0 (0.0%) | 0 (0.0%) |
| 20 to 34 years | 0 (0.0%) | 0 (0.0%) |
| 35 to 50 years | 0 (0.0%) | 0 (0.0%) |
| Total | 0 (0.0%) | 0 (0.0%) |
Fertility by Education in Zip Code 72386
| Educational Attainment | Women with Births | Births / 1,000 Women |
| Less than High School | 0 (0.0%) | 0.0 |
| High School Diploma | 0 (0.0%) | 0.0 |
| College or Associate's Degree | 0 (0.0%) | 0.0 |
| Bachelor's Degree | 0 (0.0%) | 0.0 |
| Graduate Degree | 0 (0.0%) | 0.0 |
| Total | 0 (0.0%) | 0.0 |
Fertility by Education by Marriage Status in Zip Code 72386
| Educational Attainment | Married | Unmarried |
| Less than High School | 0 (0.0%) | 0 (0.0%) |
| High School Diploma | 0 (0.0%) | 0 (0.0%) |
| College or Associate's Degree | 0 (0.0%) | 0 (0.0%) |
| Bachelor's Degree | 0 (0.0%) | 0 (0.0%) |
| Graduate Degree | 0 (0.0%) | 0 (0.0%) |
| Total | 0 (0.0%) | 0 (0.0%) |
Employment Characteristics in Zip Code 72386
Employment by Class of Employer in Zip Code 72386
Among the 735 employed individuals in Zip Code 72386, private company employees (567 | 77.1%), self-employed (incorporated) (40 | 5.4%), and not-for-profit organizations (40 | 5.4%) make up the most common classes of employment.
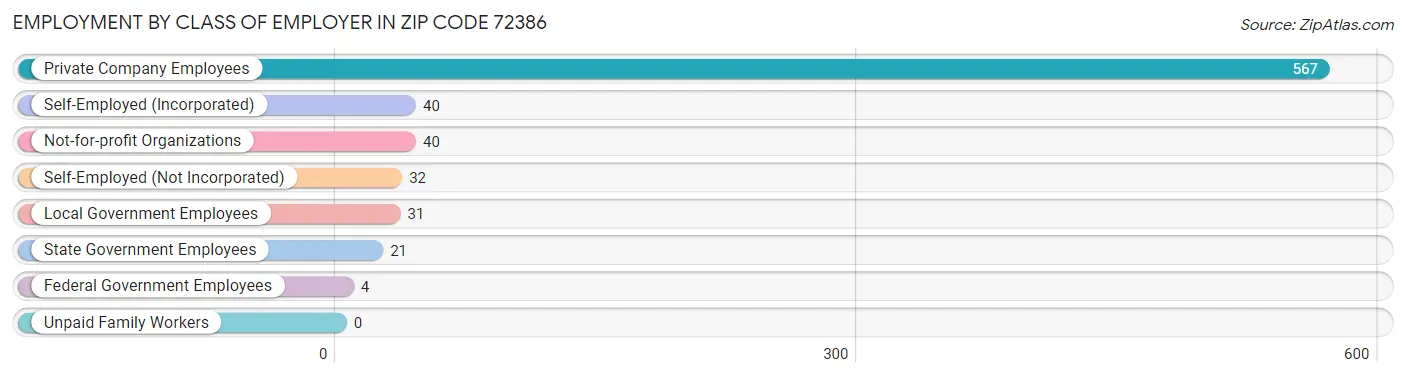
| Employer Class | # Employees | % Employees |
| Private Company Employees | 567 | 77.1% |
| Self-Employed (Incorporated) | 40 | 5.4% |
| Self-Employed (Not Incorporated) | 32 | 4.3% |
| Not-for-profit Organizations | 40 | 5.4% |
| Local Government Employees | 31 | 4.2% |
| State Government Employees | 21 | 2.9% |
| Federal Government Employees | 4 | 0.5% |
| Unpaid Family Workers | 0 | 0.0% |
| Total | 735 | 100.0% |
Employment Status by Age in Zip Code 72386
According to the labor force statistics for Zip Code 72386, out of the total population over 16 years of age (1,224), 64.9% or 794 individuals are in the labor force, with 4.3% or 34 of them unemployed. The age group with the highest labor force participation rate is 25 to 29 years, with 100.0% or 20 individuals in the labor force. Within the labor force, the 16 to 19 years age range has the highest percentage of unemployed individuals, with 16.7% or 2 of them being unemployed.
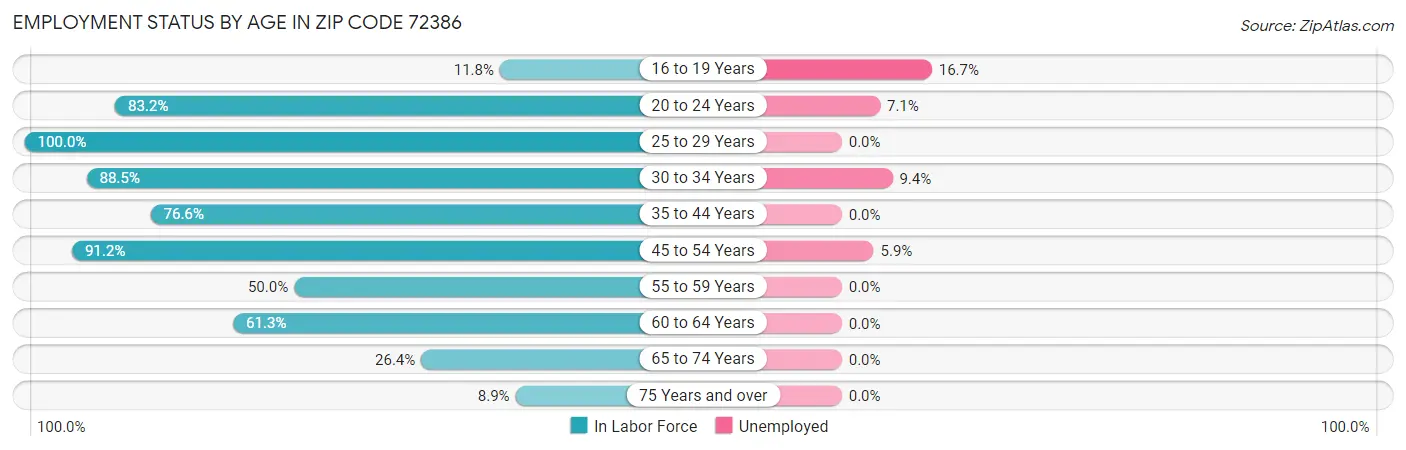
| Age Bracket | In Labor Force | Unemployed |
| 16 to 19 Years | 12 (11.8%) | 2 (16.7%) |
| 20 to 24 Years | 99 (83.2%) | 7 (7.1%) |
| 25 to 29 Years | 20 (100.0%) | 0 (0.0%) |
| 30 to 34 Years | 85 (88.5%) | 8 (9.4%) |
| 35 to 44 Years | 147 (76.6%) | 0 (0.0%) |
| 45 to 54 Years | 289 (91.2%) | 17 (5.9%) |
| 55 to 59 Years | 27 (50.0%) | 0 (0.0%) |
| 60 to 64 Years | 76 (61.3%) | 0 (0.0%) |
| 65 to 74 Years | 32 (26.4%) | 0 (0.0%) |
| 75 Years and over | 7 (8.9%) | 0 (0.0%) |
| Total | 794 (64.9%) | 34 (4.3%) |
Employment Status by Educational Attainment in Zip Code 72386
According to labor force statistics for Zip Code 72386, 80.2% of individuals (644) out of the total population between 25 and 64 years of age (803) are in the labor force, with 3.9% or 25 of them being unemployed. The group with the highest labor force participation rate are those with the educational attainment of bachelor's degree or higher, with 89.5% or 137 individuals in the labor force. Within the labor force, individuals with college / associate degree education have the highest percentage of unemployment, with 5.8% or 13 of them being unemployed.
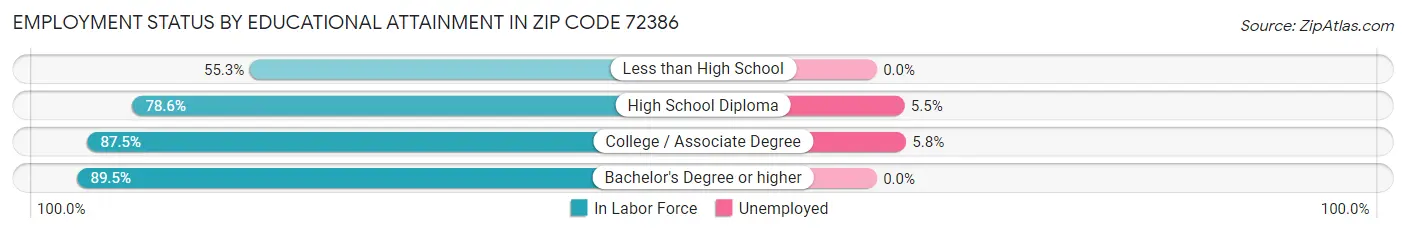
| Educational Attainment | In Labor Force | Unemployed |
| Less than High School | 63 (55.3%) | 0 (0.0%) |
| High School Diploma | 220 (78.6%) | 15 (5.5%) |
| College / Associate Degree | 224 (87.5%) | 15 (5.8%) |
| Bachelor's Degree or higher | 137 (89.5%) | 0 (0.0%) |
| Total | 644 (80.2%) | 31 (3.9%) |
Employment Occupations by Sex in Zip Code 72386
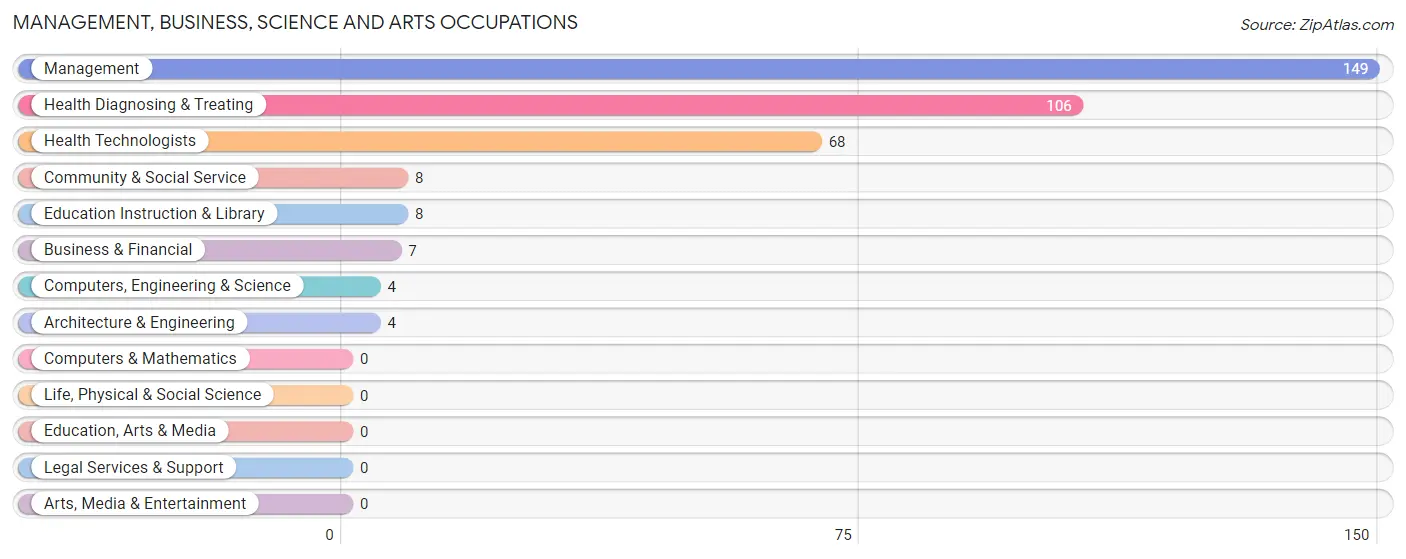
Management, Business, Science and Arts Occupations
The most common Management, Business, Science and Arts occupations in Zip Code 72386 are Management (149 | 19.6%), Health Diagnosing & Treating (106 | 14.0%), Health Technologists (68 | 8.9%), Community & Social Service (8 | 1.1%), and Education Instruction & Library (8 | 1.1%).
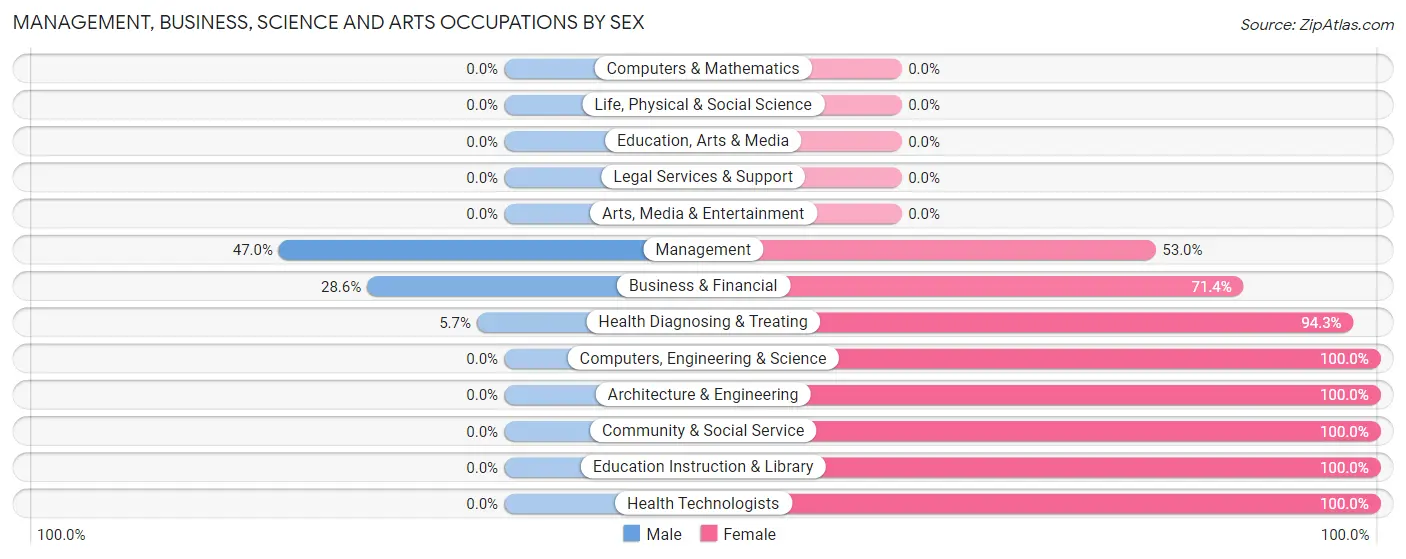
Management, Business, Science and Arts Occupations by Sex
Within the Management, Business, Science and Arts occupations in Zip Code 72386, the most male-oriented occupations are Management (47.0%), Business & Financial (28.6%), and Health Diagnosing & Treating (5.7%), while the most female-oriented occupations are Computers, Engineering & Science (100.0%), Architecture & Engineering (100.0%), and Community & Social Service (100.0%).
| Occupation | Male | Female |
| Management | 70 (47.0%) | 79 (53.0%) |
| Business & Financial | 2 (28.6%) | 5 (71.4%) |
| Computers, Engineering & Science | 0 (0.0%) | 4 (100.0%) |
| Computers & Mathematics | 0 (0.0%) | 0 (0.0%) |
| Architecture & Engineering | 0 (0.0%) | 4 (100.0%) |
| Life, Physical & Social Science | 0 (0.0%) | 0 (0.0%) |
| Community & Social Service | 0 (0.0%) | 8 (100.0%) |
| Education, Arts & Media | 0 (0.0%) | 0 (0.0%) |
| Legal Services & Support | 0 (0.0%) | 0 (0.0%) |
| Education Instruction & Library | 0 (0.0%) | 8 (100.0%) |
| Arts, Media & Entertainment | 0 (0.0%) | 0 (0.0%) |
| Health Diagnosing & Treating | 6 (5.7%) | 100 (94.3%) |
| Health Technologists | 0 (0.0%) | 68 (100.0%) |
| Total (Category) | 78 (28.5%) | 196 (71.5%) |
| Total (Overall) | 404 (53.2%) | 356 (46.8%) |
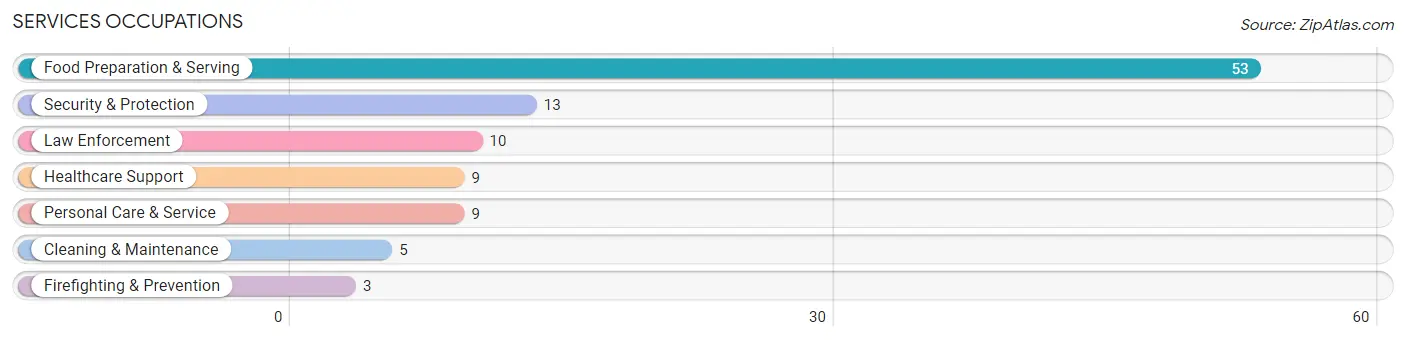
Services Occupations
The most common Services occupations in Zip Code 72386 are Food Preparation & Serving (53 | 7.0%), Security & Protection (13 | 1.7%), Law Enforcement (10 | 1.3%), Healthcare Support (9 | 1.2%), and Personal Care & Service (9 | 1.2%).
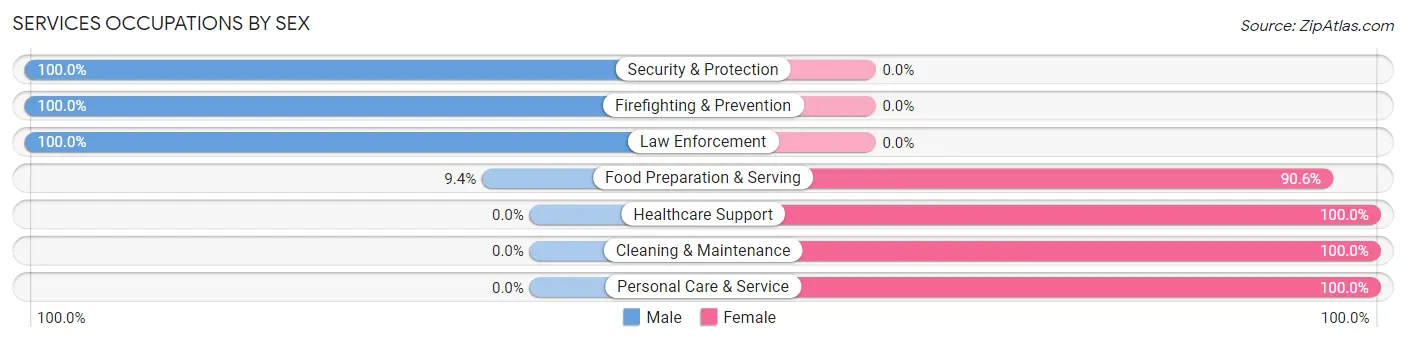
Services Occupations by Sex
Within the Services occupations in Zip Code 72386, the most male-oriented occupations are Security & Protection (100.0%), Firefighting & Prevention (100.0%), and Law Enforcement (100.0%), while the most female-oriented occupations are Healthcare Support (100.0%), Cleaning & Maintenance (100.0%), and Personal Care & Service (100.0%).
| Occupation | Male | Female |
| Healthcare Support | 0 (0.0%) | 9 (100.0%) |
| Security & Protection | 13 (100.0%) | 0 (0.0%) |
| Firefighting & Prevention | 3 (100.0%) | 0 (0.0%) |
| Law Enforcement | 10 (100.0%) | 0 (0.0%) |
| Food Preparation & Serving | 5 (9.4%) | 48 (90.6%) |
| Cleaning & Maintenance | 0 (0.0%) | 5 (100.0%) |
| Personal Care & Service | 0 (0.0%) | 9 (100.0%) |
| Total (Category) | 18 (20.2%) | 71 (79.8%) |
| Total (Overall) | 404 (53.2%) | 356 (46.8%) |
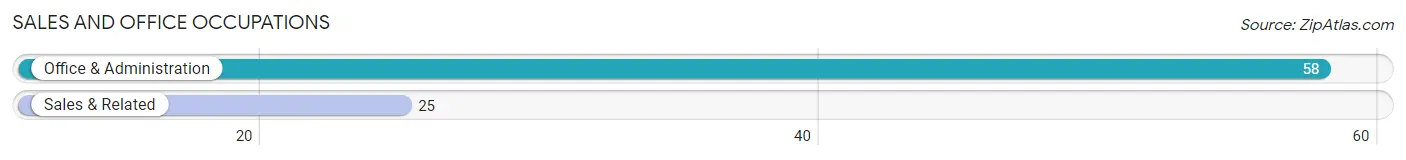
Sales and Office Occupations
The most common Sales and Office occupations in Zip Code 72386 are Office & Administration (58 | 7.6%), and Sales & Related (25 | 3.3%).
Sales and Office Occupations by Sex
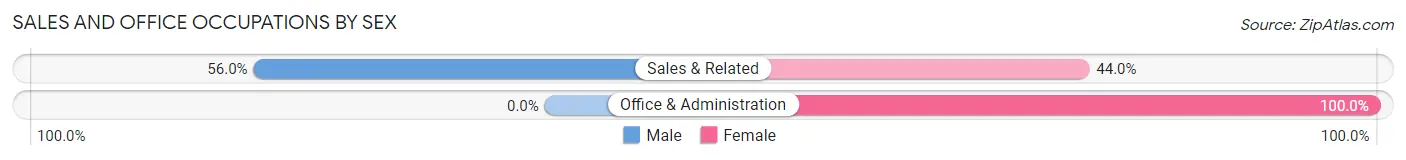
| Occupation | Male | Female |
| Sales & Related | 14 (56.0%) | 11 (44.0%) |
| Office & Administration | 0 (0.0%) | 58 (100.0%) |
| Total (Category) | 14 (16.9%) | 69 (83.1%) |
| Total (Overall) | 404 (53.2%) | 356 (46.8%) |
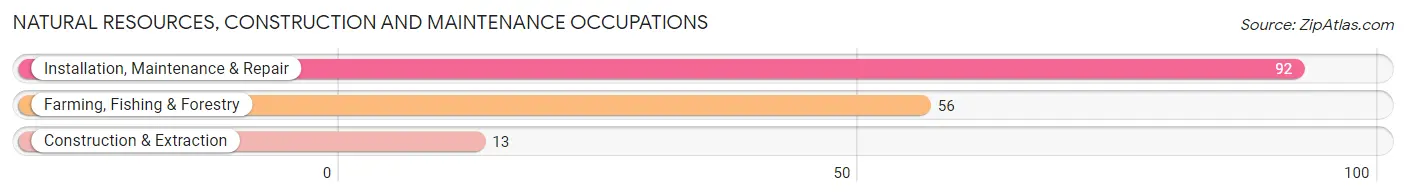
Natural Resources, Construction and Maintenance Occupations
The most common Natural Resources, Construction and Maintenance occupations in Zip Code 72386 are Installation, Maintenance & Repair (92 | 12.1%), Farming, Fishing & Forestry (56 | 7.4%), and Construction & Extraction (13 | 1.7%).
Natural Resources, Construction and Maintenance Occupations by Sex
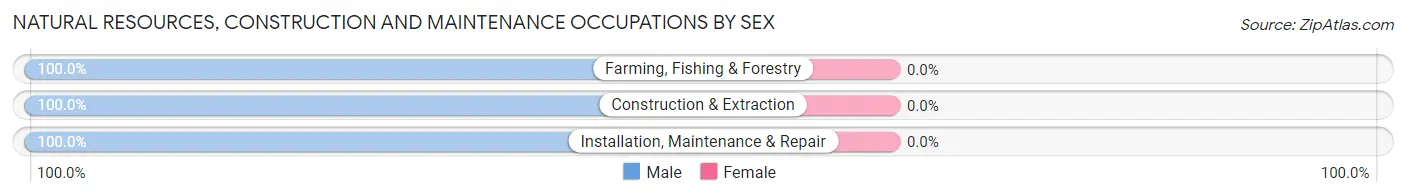
| Occupation | Male | Female |
| Farming, Fishing & Forestry | 56 (100.0%) | 0 (0.0%) |
| Construction & Extraction | 13 (100.0%) | 0 (0.0%) |
| Installation, Maintenance & Repair | 92 (100.0%) | 0 (0.0%) |
| Total (Category) | 161 (100.0%) | 0 (0.0%) |
| Total (Overall) | 404 (53.2%) | 356 (46.8%) |
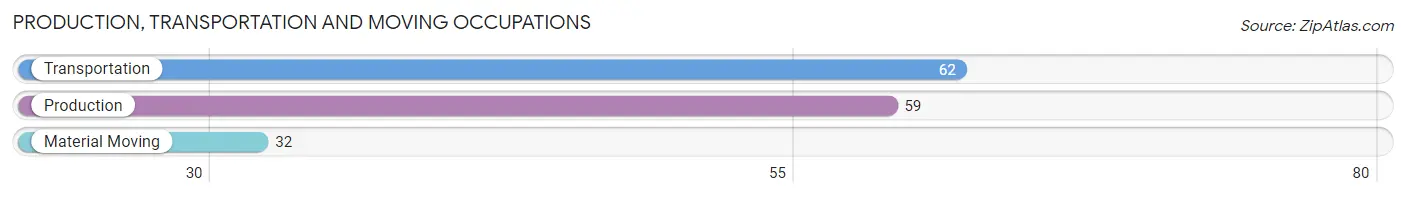
Production, Transportation and Moving Occupations
The most common Production, Transportation and Moving occupations in Zip Code 72386 are Transportation (62 | 8.2%), Production (59 | 7.8%), and Material Moving (32 | 4.2%).
Production, Transportation and Moving Occupations by Sex
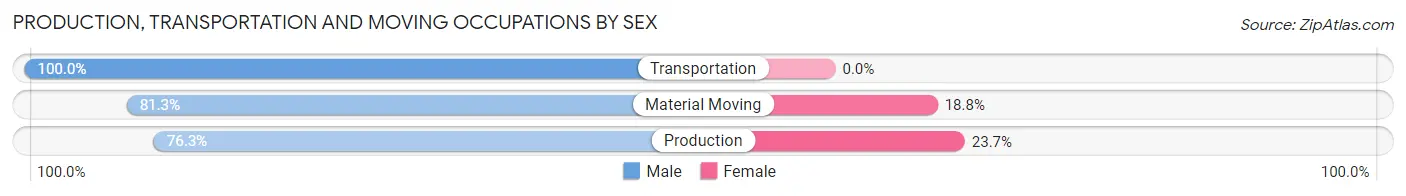
| Occupation | Male | Female |
| Production | 45 (76.3%) | 14 (23.7%) |
| Transportation | 62 (100.0%) | 0 (0.0%) |
| Material Moving | 26 (81.2%) | 6 (18.8%) |
| Total (Category) | 133 (86.9%) | 20 (13.1%) |
| Total (Overall) | 404 (53.2%) | 356 (46.8%) |
Employment Industries by Sex in Zip Code 72386
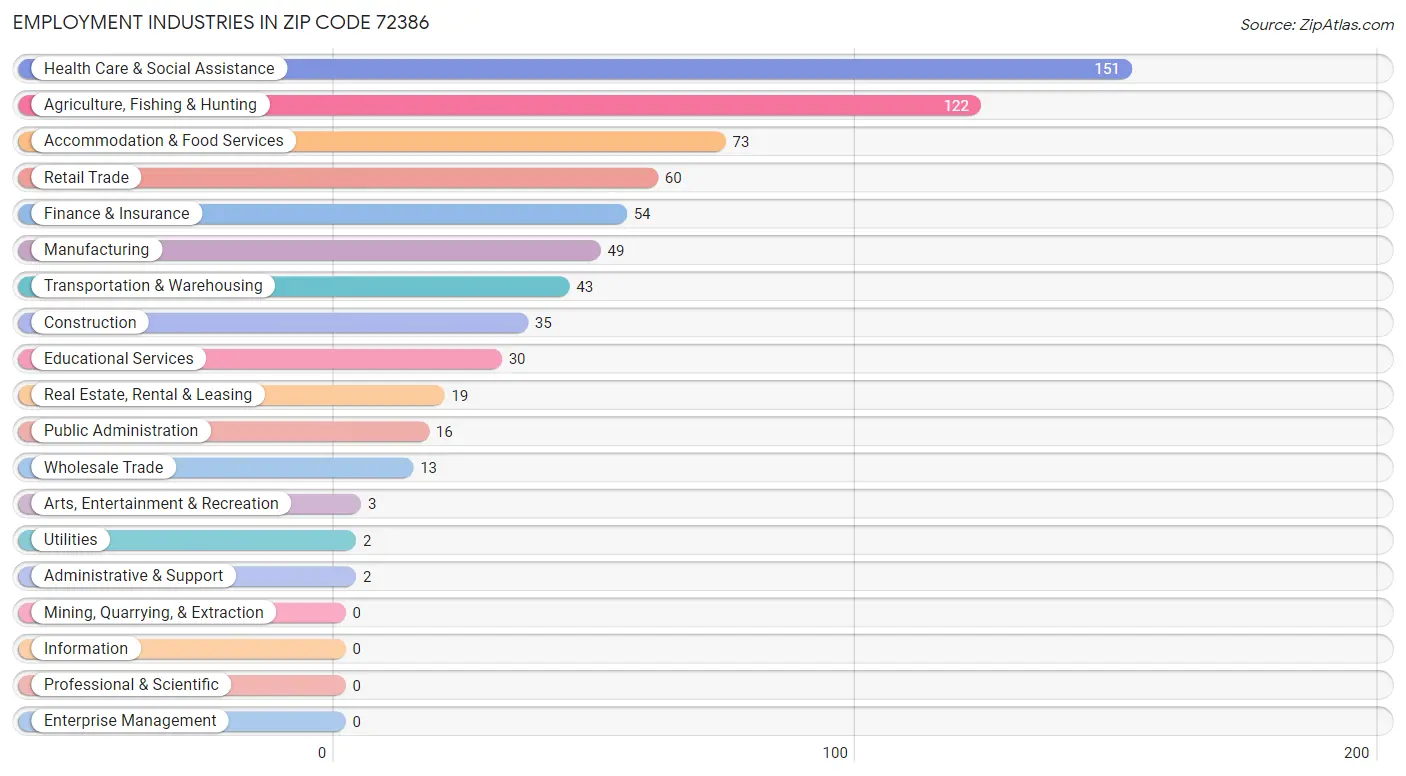
Employment Industries in Zip Code 72386
The major employment industries in Zip Code 72386 include Health Care & Social Assistance (151 | 19.9%), Agriculture, Fishing & Hunting (122 | 16.1%), Accommodation & Food Services (73 | 9.6%), Retail Trade (60 | 7.9%), and Finance & Insurance (54 | 7.1%).
Employment Industries by Sex in Zip Code 72386
The Zip Code 72386 industries that see more men than women are Agriculture, Fishing & Hunting (100.0%), Wholesale Trade (100.0%), and Construction (94.3%), whereas the industries that tend to have a higher number of women are Utilities (100.0%), Finance & Insurance (100.0%), and Real Estate, Rental & Leasing (100.0%).
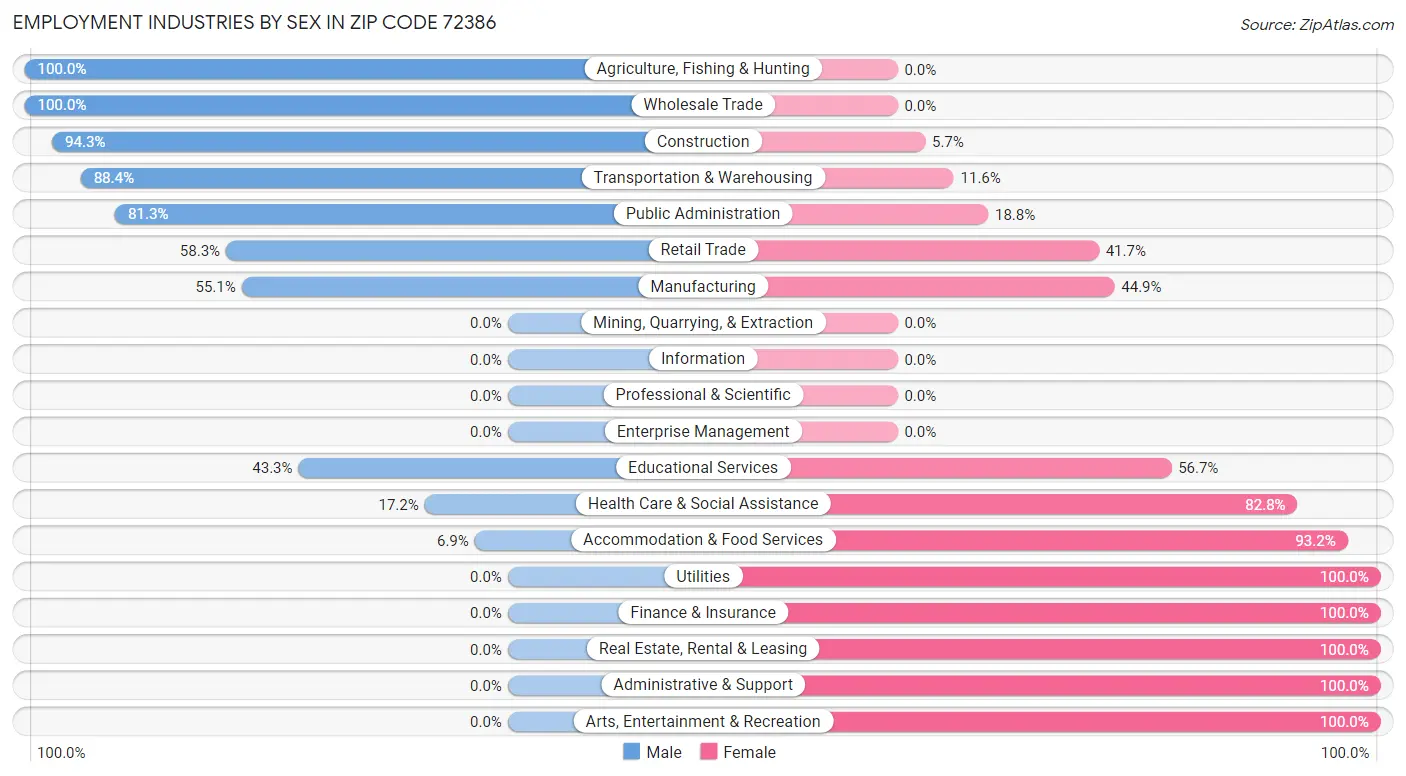
| Industry | Male | Female |
| Agriculture, Fishing & Hunting | 122 (100.0%) | 0 (0.0%) |
| Mining, Quarrying, & Extraction | 0 (0.0%) | 0 (0.0%) |
| Construction | 33 (94.3%) | 2 (5.7%) |
| Manufacturing | 27 (55.1%) | 22 (44.9%) |
| Wholesale Trade | 13 (100.0%) | 0 (0.0%) |
| Retail Trade | 35 (58.3%) | 25 (41.7%) |
| Transportation & Warehousing | 38 (88.4%) | 5 (11.6%) |
| Utilities | 0 (0.0%) | 2 (100.0%) |
| Information | 0 (0.0%) | 0 (0.0%) |
| Finance & Insurance | 0 (0.0%) | 54 (100.0%) |
| Real Estate, Rental & Leasing | 0 (0.0%) | 19 (100.0%) |
| Professional & Scientific | 0 (0.0%) | 0 (0.0%) |
| Enterprise Management | 0 (0.0%) | 0 (0.0%) |
| Administrative & Support | 0 (0.0%) | 2 (100.0%) |
| Educational Services | 13 (43.3%) | 17 (56.7%) |
| Health Care & Social Assistance | 26 (17.2%) | 125 (82.8%) |
| Arts, Entertainment & Recreation | 0 (0.0%) | 3 (100.0%) |
| Accommodation & Food Services | 5 (6.9%) | 68 (93.1%) |
| Public Administration | 13 (81.2%) | 3 (18.8%) |
| Total | 404 (53.2%) | 356 (46.8%) |
Education in Zip Code 72386
School Enrollment in Zip Code 72386
The most common levels of schooling among the 444 students in Zip Code 72386 are middle school (133 | 29.9%), elementary school (130 | 29.3%), and high school (99 | 22.3%).
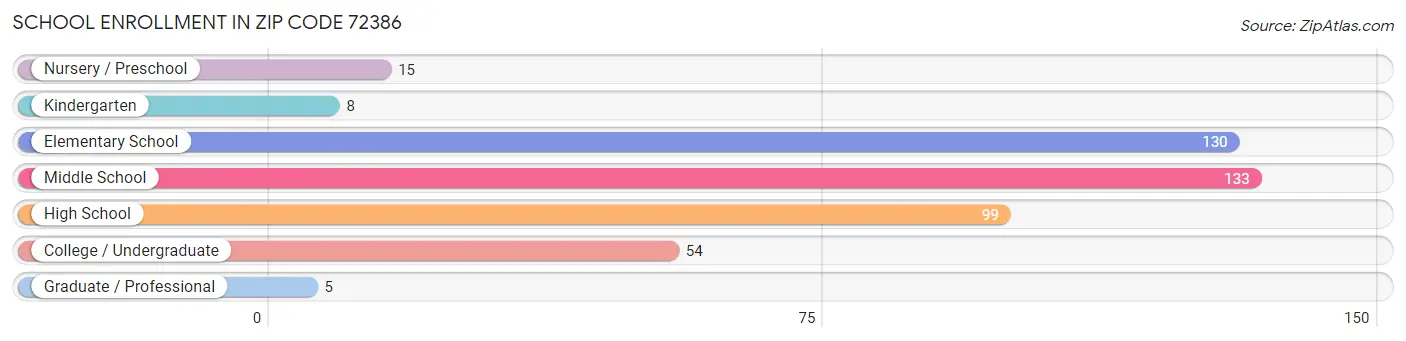
| School Level | # Students | % Students |
| Nursery / Preschool | 15 | 3.4% |
| Kindergarten | 8 | 1.8% |
| Elementary School | 130 | 29.3% |
| Middle School | 133 | 29.9% |
| High School | 99 | 22.3% |
| College / Undergraduate | 54 | 12.2% |
| Graduate / Professional | 5 | 1.1% |
| Total | 444 | 100.0% |
School Enrollment by Age by Funding Source in Zip Code 72386
Out of a total of 444 students who are enrolled in schools in Zip Code 72386, 58 (13.1%) attend a private institution, while the remaining 386 (86.9%) are enrolled in public schools. The age group of 5 to 9 year old has the highest likelihood of being enrolled in private schools, with 53 (38.7% in the age bracket) enrolled. Conversely, the age group of 3 to 4 year olds has the lowest likelihood of being enrolled in a private school, with 12 (100.0% in the age bracket) attending a public institution.
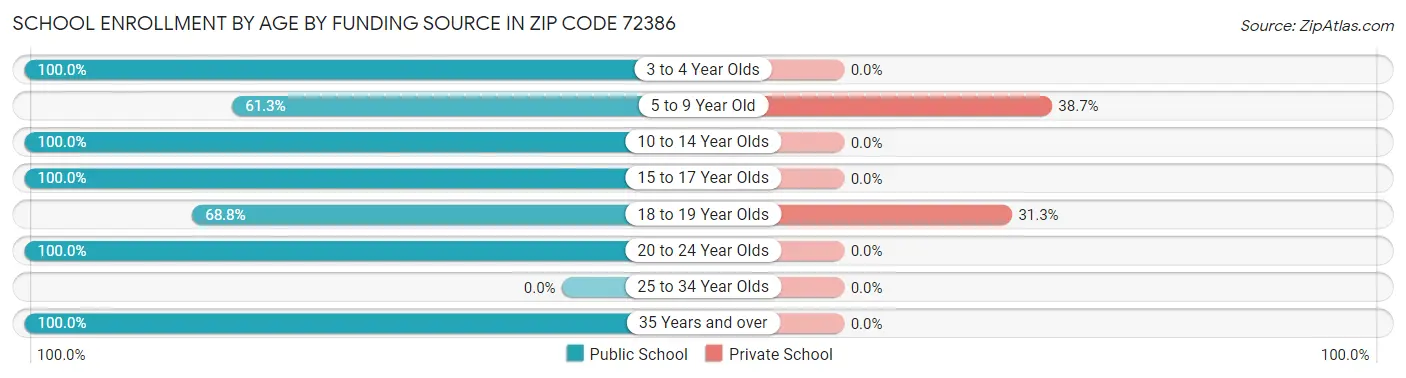
| Age Bracket | Public School | Private School |
| 3 to 4 Year Olds | 12 (100.0%) | 0 (0.0%) |
| 5 to 9 Year Old | 84 (61.3%) | 53 (38.7%) |
| 10 to 14 Year Olds | 145 (100.0%) | 0 (0.0%) |
| 15 to 17 Year Olds | 93 (100.0%) | 0 (0.0%) |
| 18 to 19 Year Olds | 11 (68.8%) | 5 (31.2%) |
| 20 to 24 Year Olds | 36 (100.0%) | 0 (0.0%) |
| 25 to 34 Year Olds | 0 (0.0%) | 0 (0.0%) |
| 35 Years and over | 5 (100.0%) | 0 (0.0%) |
| Total | 386 (86.9%) | 58 (13.1%) |
Educational Attainment by Field of Study in Zip Code 72386
Science & technology (74 | 41.1%), education (60 | 33.3%), bio, nature & agricultural (25 | 13.9%), business (12 | 6.7%), and communications (6 | 3.3%) are the most common fields of study among 180 individuals in Zip Code 72386 who have obtained a bachelor's degree or higher.
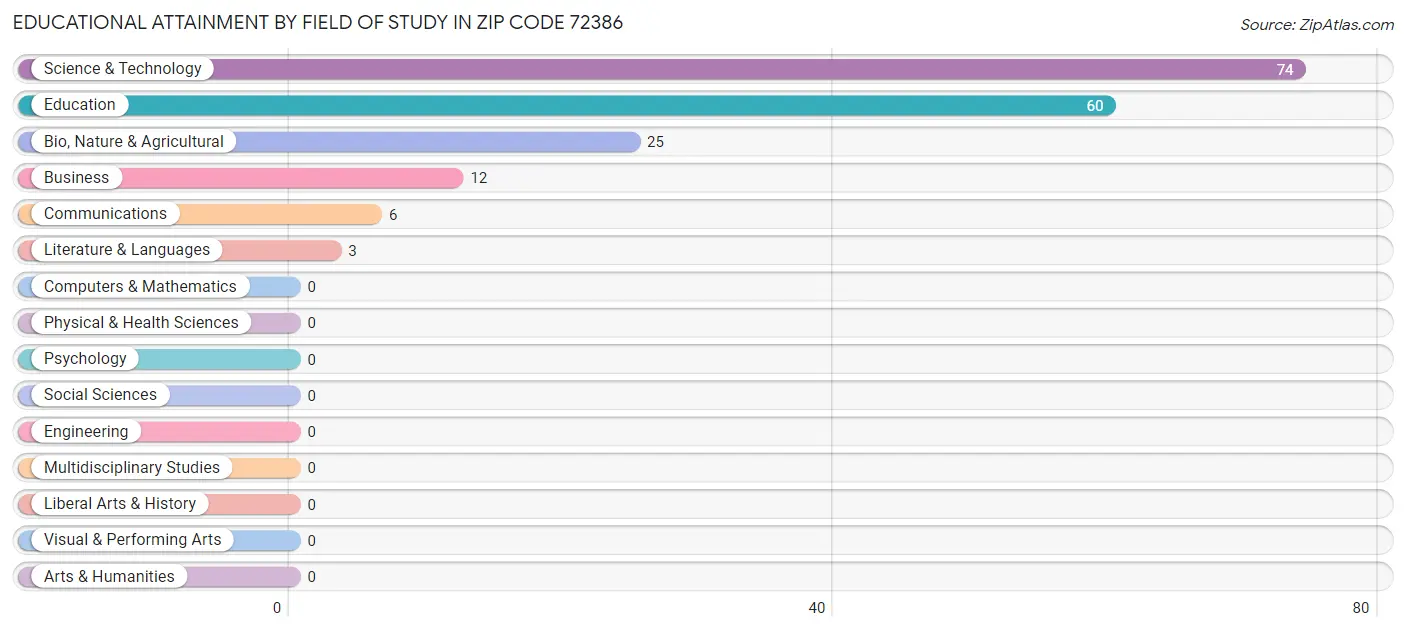
| Field of Study | # Graduates | % Graduates |
| Computers & Mathematics | 0 | 0.0% |
| Bio, Nature & Agricultural | 25 | 13.9% |
| Physical & Health Sciences | 0 | 0.0% |
| Psychology | 0 | 0.0% |
| Social Sciences | 0 | 0.0% |
| Engineering | 0 | 0.0% |
| Multidisciplinary Studies | 0 | 0.0% |
| Science & Technology | 74 | 41.1% |
| Business | 12 | 6.7% |
| Education | 60 | 33.3% |
| Literature & Languages | 3 | 1.7% |
| Liberal Arts & History | 0 | 0.0% |
| Visual & Performing Arts | 0 | 0.0% |
| Communications | 6 | 3.3% |
| Arts & Humanities | 0 | 0.0% |
| Total | 180 | 100.0% |
Transportation & Commute in Zip Code 72386
Vehicle Availability by Sex in Zip Code 72386
The most prevalent vehicle ownership categories in Zip Code 72386 are males with 2 vehicles (114, accounting for 29.8%) and females with 2 vehicles (104, making up 32.3%).
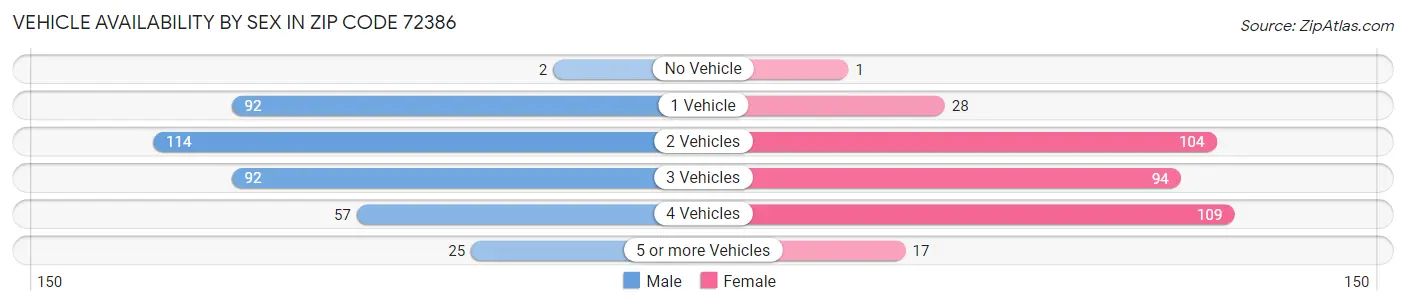
| Vehicles Available | Male | Female |
| No Vehicle | 2 (0.5%) | 1 (0.3%) |
| 1 Vehicle | 92 (24.1%) | 28 (7.9%) |
| 2 Vehicles | 114 (29.8%) | 104 (29.5%) |
| 3 Vehicles | 92 (24.1%) | 94 (26.6%) |
| 4 Vehicles | 57 (14.9%) | 109 (30.9%) |
| 5 or more Vehicles | 25 (6.5%) | 17 (4.8%) |
| Total | 382 (100.0%) | 353 (100.0%) |
Commute Time in Zip Code 72386
The most frequently occuring commute durations in Zip Code 72386 are 30 to 34 minutes (135 commuters, 19.0%), 45 to 59 minutes (123 commuters, 17.3%), and 40 to 44 minutes (111 commuters, 15.6%).
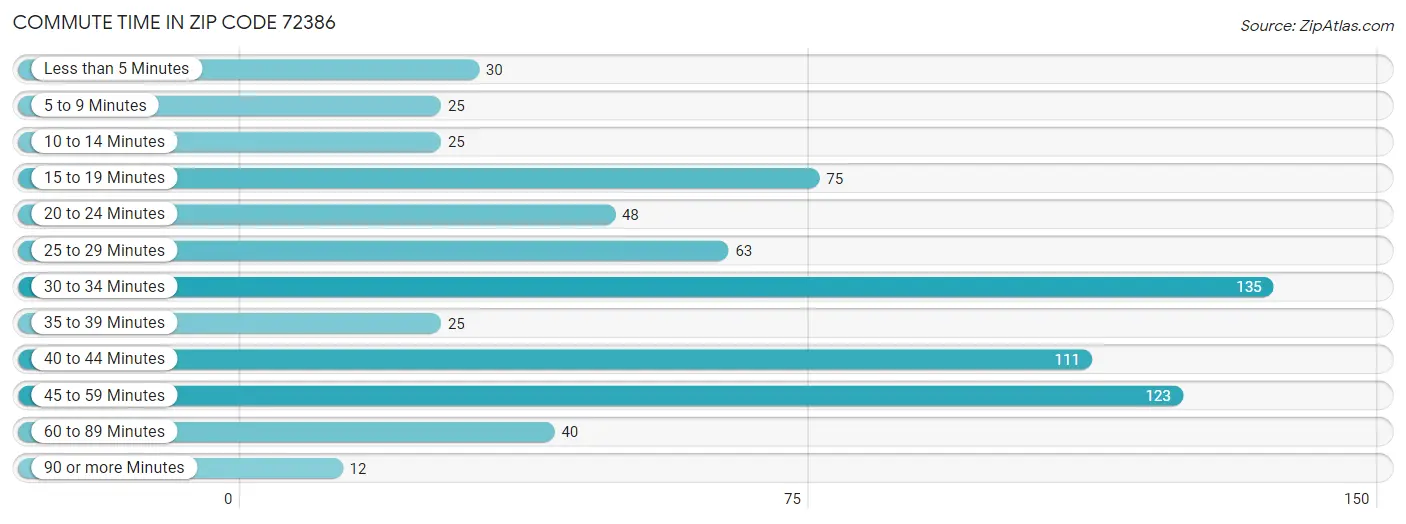
| Commute Time | # Commuters | % Commuters |
| Less than 5 Minutes | 30 | 4.2% |
| 5 to 9 Minutes | 25 | 3.5% |
| 10 to 14 Minutes | 25 | 3.5% |
| 15 to 19 Minutes | 75 | 10.5% |
| 20 to 24 Minutes | 48 | 6.7% |
| 25 to 29 Minutes | 63 | 8.8% |
| 30 to 34 Minutes | 135 | 19.0% |
| 35 to 39 Minutes | 25 | 3.5% |
| 40 to 44 Minutes | 111 | 15.6% |
| 45 to 59 Minutes | 123 | 17.3% |
| 60 to 89 Minutes | 40 | 5.6% |
| 90 or more Minutes | 12 | 1.7% |
Commute Time by Sex in Zip Code 72386
The most common commute times in Zip Code 72386 are 45 to 59 minutes (75 commuters, 20.9%) for males and 40 to 44 minutes (110 commuters, 31.2%) for females.
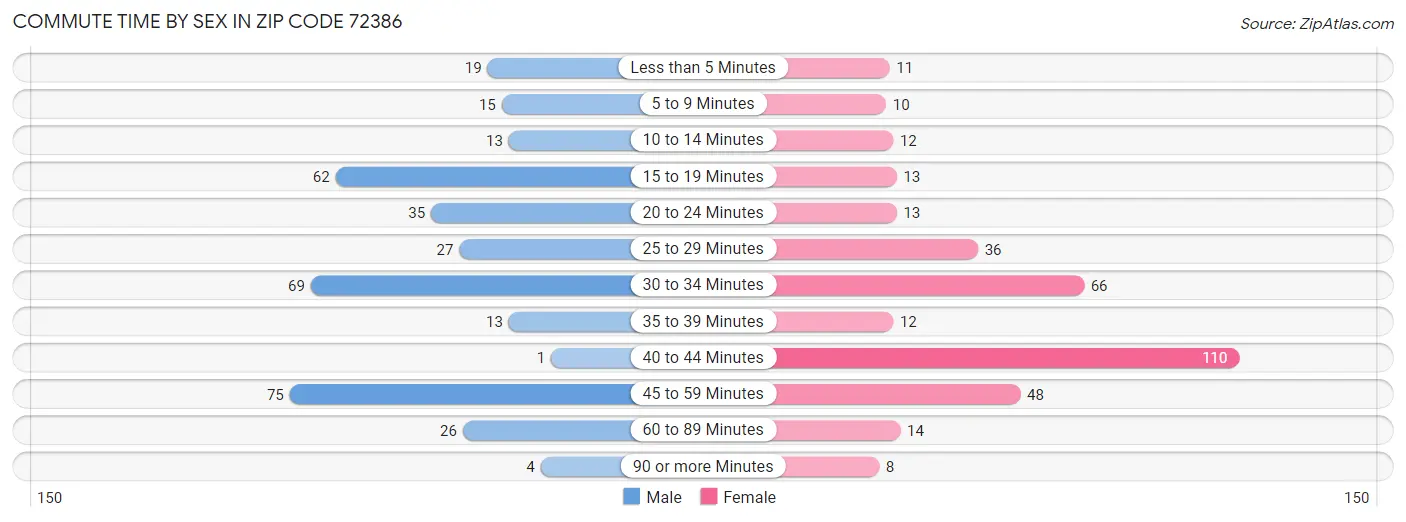
| Commute Time | Male | Female |
| Less than 5 Minutes | 19 (5.3%) | 11 (3.1%) |
| 5 to 9 Minutes | 15 (4.2%) | 10 (2.8%) |
| 10 to 14 Minutes | 13 (3.6%) | 12 (3.4%) |
| 15 to 19 Minutes | 62 (17.3%) | 13 (3.7%) |
| 20 to 24 Minutes | 35 (9.8%) | 13 (3.7%) |
| 25 to 29 Minutes | 27 (7.5%) | 36 (10.2%) |
| 30 to 34 Minutes | 69 (19.2%) | 66 (18.7%) |
| 35 to 39 Minutes | 13 (3.6%) | 12 (3.4%) |
| 40 to 44 Minutes | 1 (0.3%) | 110 (31.2%) |
| 45 to 59 Minutes | 75 (20.9%) | 48 (13.6%) |
| 60 to 89 Minutes | 26 (7.2%) | 14 (4.0%) |
| 90 or more Minutes | 4 (1.1%) | 8 (2.3%) |
Time of Departure to Work by Sex in Zip Code 72386
The most frequent times of departure to work in Zip Code 72386 are 6:30 AM to 6:59 AM (120, 33.4%) for males and 7:30 AM to 7:59 AM (68, 19.3%) for females.
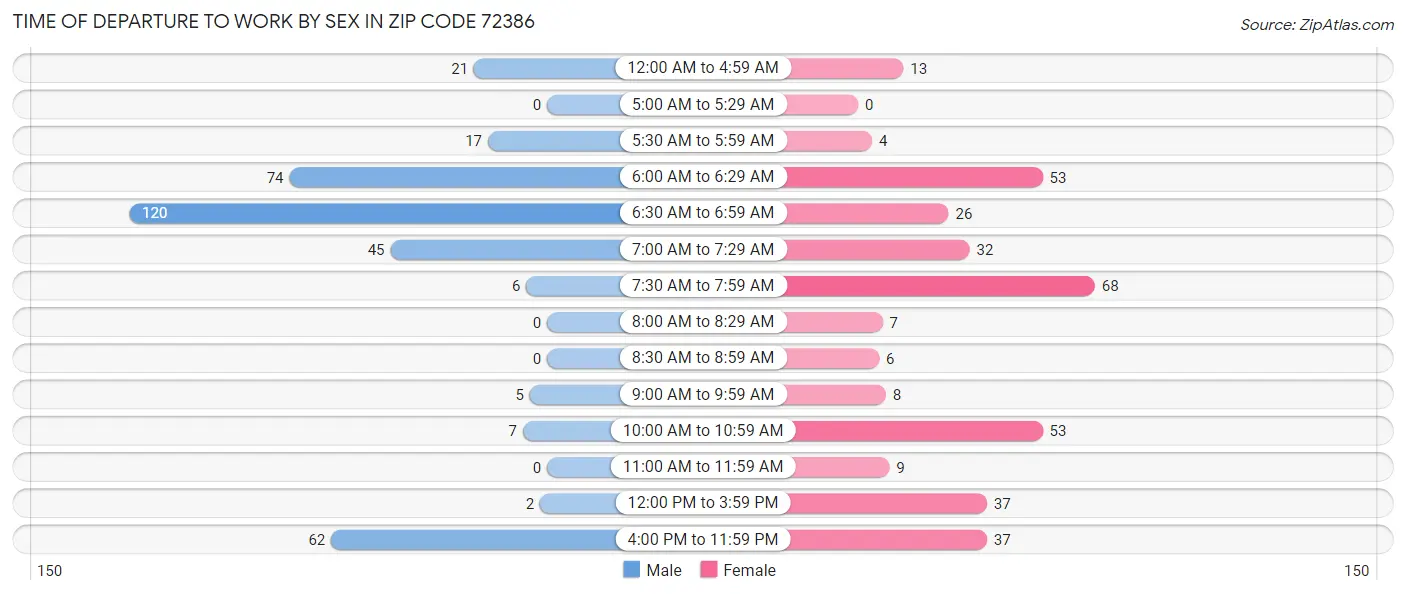
| Time of Departure | Male | Female |
| 12:00 AM to 4:59 AM | 21 (5.9%) | 13 (3.7%) |
| 5:00 AM to 5:29 AM | 0 (0.0%) | 0 (0.0%) |
| 5:30 AM to 5:59 AM | 17 (4.7%) | 4 (1.1%) |
| 6:00 AM to 6:29 AM | 74 (20.6%) | 53 (15.0%) |
| 6:30 AM to 6:59 AM | 120 (33.4%) | 26 (7.4%) |
| 7:00 AM to 7:29 AM | 45 (12.5%) | 32 (9.1%) |
| 7:30 AM to 7:59 AM | 6 (1.7%) | 68 (19.3%) |
| 8:00 AM to 8:29 AM | 0 (0.0%) | 7 (2.0%) |
| 8:30 AM to 8:59 AM | 0 (0.0%) | 6 (1.7%) |
| 9:00 AM to 9:59 AM | 5 (1.4%) | 8 (2.3%) |
| 10:00 AM to 10:59 AM | 7 (1.9%) | 53 (15.0%) |
| 11:00 AM to 11:59 AM | 0 (0.0%) | 9 (2.5%) |
| 12:00 PM to 3:59 PM | 2 (0.6%) | 37 (10.5%) |
| 4:00 PM to 11:59 PM | 62 (17.3%) | 37 (10.5%) |
| Total | 359 (100.0%) | 353 (100.0%) |
Housing Occupancy in Zip Code 72386
Occupancy by Ownership in Zip Code 72386
Of the total 571 dwellings in Zip Code 72386, owner-occupied units account for 409 (71.6%), while renter-occupied units make up 162 (28.4%).
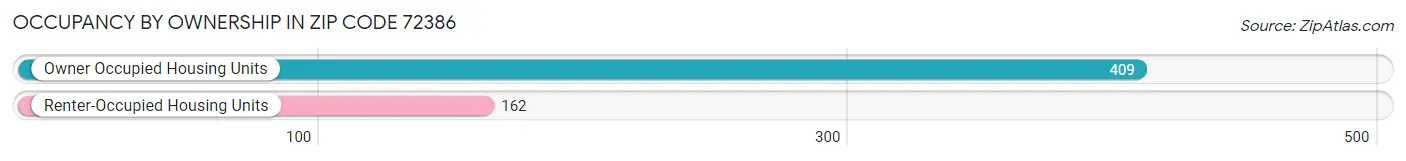
| Occupancy | # Housing Units | % Housing Units |
| Owner Occupied Housing Units | 409 | 71.6% |
| Renter-Occupied Housing Units | 162 | 28.4% |
| Total Occupied Housing Units | 571 | 100.0% |
Occupancy by Household Size in Zip Code 72386
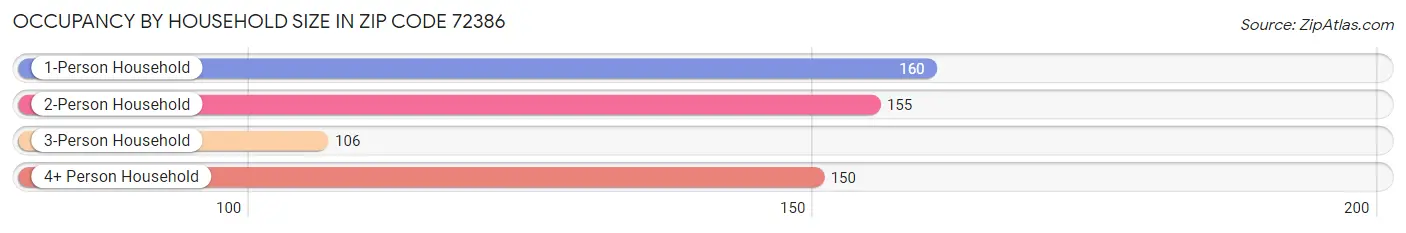
| Household Size | # Housing Units | % Housing Units |
| 1-Person Household | 160 | 28.0% |
| 2-Person Household | 155 | 27.2% |
| 3-Person Household | 106 | 18.6% |
| 4+ Person Household | 150 | 26.3% |
| Total Housing Units | 571 | 100.0% |
Occupancy by Ownership by Household Size in Zip Code 72386
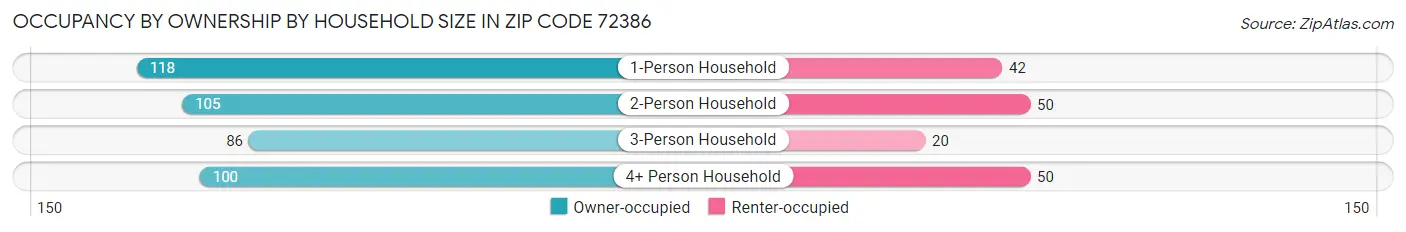
| Household Size | Owner-occupied | Renter-occupied |
| 1-Person Household | 118 (73.8%) | 42 (26.3%) |
| 2-Person Household | 105 (67.7%) | 50 (32.3%) |
| 3-Person Household | 86 (81.1%) | 20 (18.9%) |
| 4+ Person Household | 100 (66.7%) | 50 (33.3%) |
| Total Housing Units | 409 (71.6%) | 162 (28.4%) |
Occupancy by Educational Attainment in Zip Code 72386
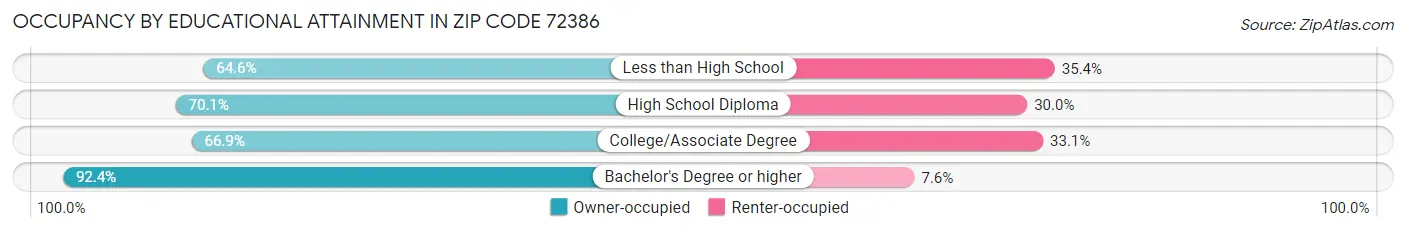
| Household Size | Owner-occupied | Renter-occupied |
| Less than High School | 82 (64.6%) | 45 (35.4%) |
| High School Diploma | 145 (70.1%) | 62 (29.9%) |
| College/Associate Degree | 97 (66.9%) | 48 (33.1%) |
| Bachelor's Degree or higher | 85 (92.4%) | 7 (7.6%) |
Occupancy by Age of Householder in Zip Code 72386
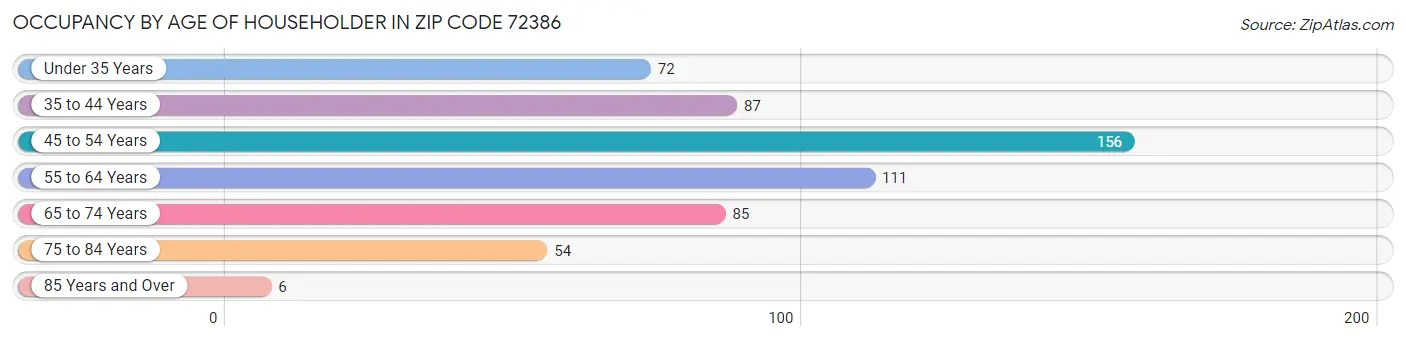
| Age Bracket | # Households | % Households |
| Under 35 Years | 72 | 12.6% |
| 35 to 44 Years | 87 | 15.2% |
| 45 to 54 Years | 156 | 27.3% |
| 55 to 64 Years | 111 | 19.4% |
| 65 to 74 Years | 85 | 14.9% |
| 75 to 84 Years | 54 | 9.5% |
| 85 Years and Over | 6 | 1.1% |
| Total | 571 | 100.0% |
Housing Finances in Zip Code 72386
Median Income by Occupancy in Zip Code 72386
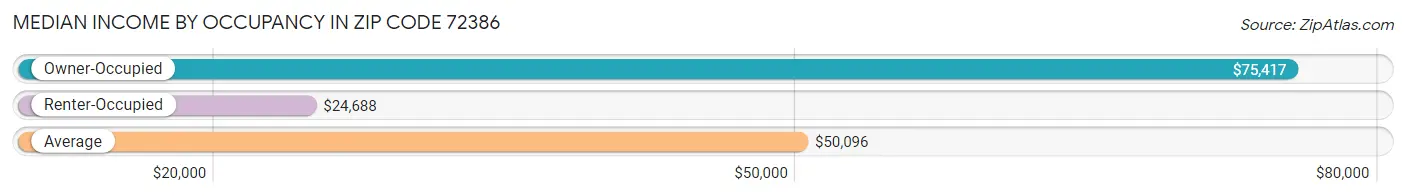
| Occupancy Type | # Households | Median Income |
| Owner-Occupied | 409 (71.6%) | $75,417 |
| Renter-Occupied | 162 (28.4%) | $24,688 |
| Average | 571 (100.0%) | $50,096 |
Occupancy by Householder Income Bracket in Zip Code 72386
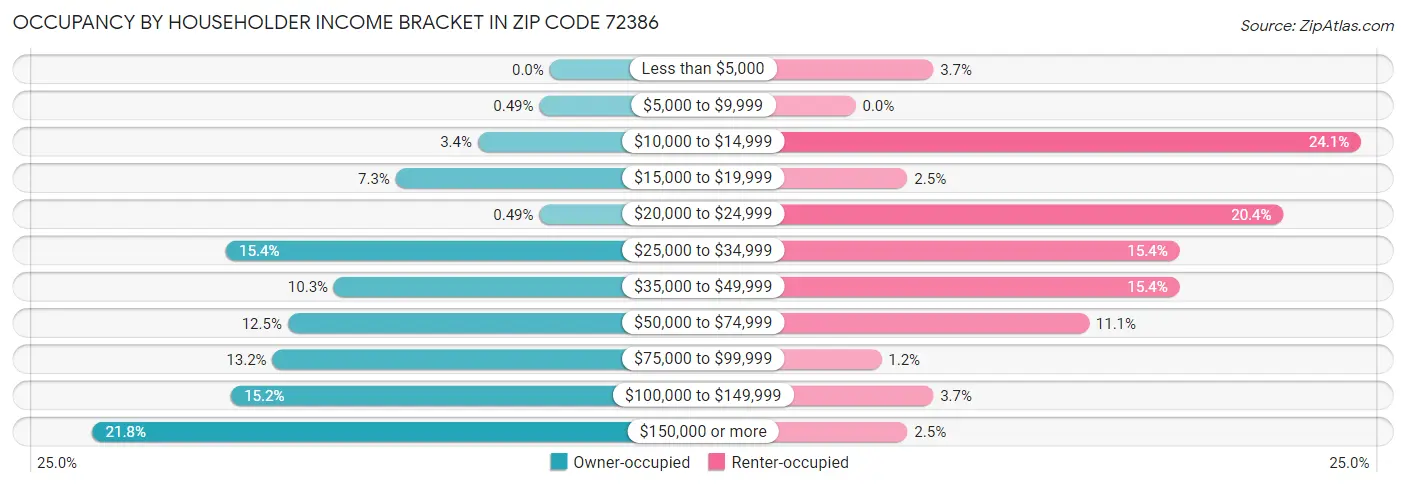
| Income Bracket | Owner-occupied | Renter-occupied |
| Less than $5,000 | 0 (0.0%) | 6 (3.7%) |
| $5,000 to $9,999 | 2 (0.5%) | 0 (0.0%) |
| $10,000 to $14,999 | 14 (3.4%) | 39 (24.1%) |
| $15,000 to $19,999 | 30 (7.3%) | 4 (2.5%) |
| $20,000 to $24,999 | 2 (0.5%) | 33 (20.4%) |
| $25,000 to $34,999 | 63 (15.4%) | 25 (15.4%) |
| $35,000 to $49,999 | 42 (10.3%) | 25 (15.4%) |
| $50,000 to $74,999 | 51 (12.5%) | 18 (11.1%) |
| $75,000 to $99,999 | 54 (13.2%) | 2 (1.2%) |
| $100,000 to $149,999 | 62 (15.2%) | 6 (3.7%) |
| $150,000 or more | 89 (21.8%) | 4 (2.5%) |
| Total | 409 (100.0%) | 162 (100.0%) |
Monthly Housing Cost Tiers in Zip Code 72386
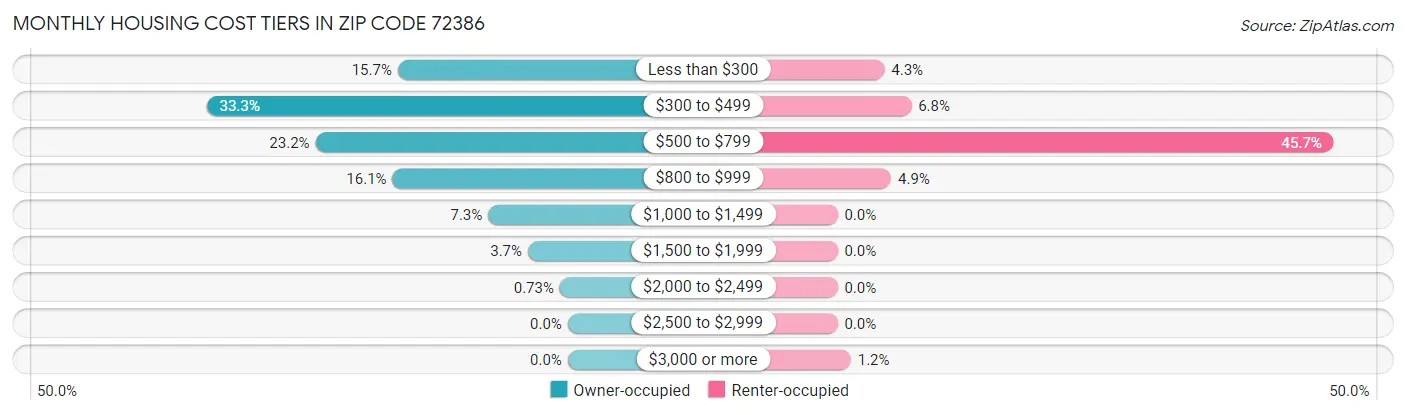
| Monthly Cost | Owner-occupied | Renter-occupied |
| Less than $300 | 64 (15.7%) | 7 (4.3%) |
| $300 to $499 | 136 (33.3%) | 11 (6.8%) |
| $500 to $799 | 95 (23.2%) | 74 (45.7%) |
| $800 to $999 | 66 (16.1%) | 8 (4.9%) |
| $1,000 to $1,499 | 30 (7.3%) | 0 (0.0%) |
| $1,500 to $1,999 | 15 (3.7%) | 0 (0.0%) |
| $2,000 to $2,499 | 3 (0.7%) | 0 (0.0%) |
| $2,500 to $2,999 | 0 (0.0%) | 0 (0.0%) |
| $3,000 or more | 0 (0.0%) | 2 (1.2%) |
| Total | 409 (100.0%) | 162 (100.0%) |
Physical Housing Characteristics in Zip Code 72386
Housing Structures in Zip Code 72386
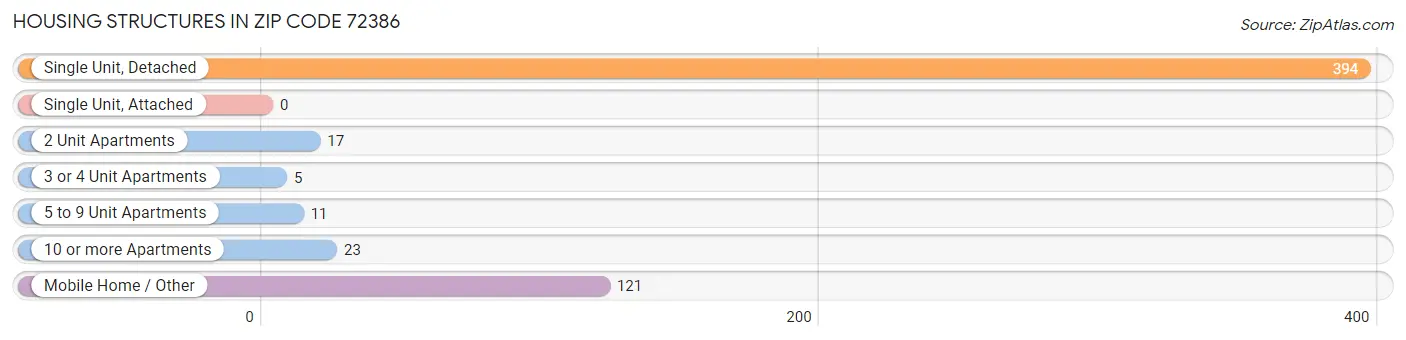
| Structure Type | # Housing Units | % Housing Units |
| Single Unit, Detached | 394 | 69.0% |
| Single Unit, Attached | 0 | 0.0% |
| 2 Unit Apartments | 17 | 3.0% |
| 3 or 4 Unit Apartments | 5 | 0.9% |
| 5 to 9 Unit Apartments | 11 | 1.9% |
| 10 or more Apartments | 23 | 4.0% |
| Mobile Home / Other | 121 | 21.2% |
| Total | 571 | 100.0% |
Housing Structures by Occupancy in Zip Code 72386
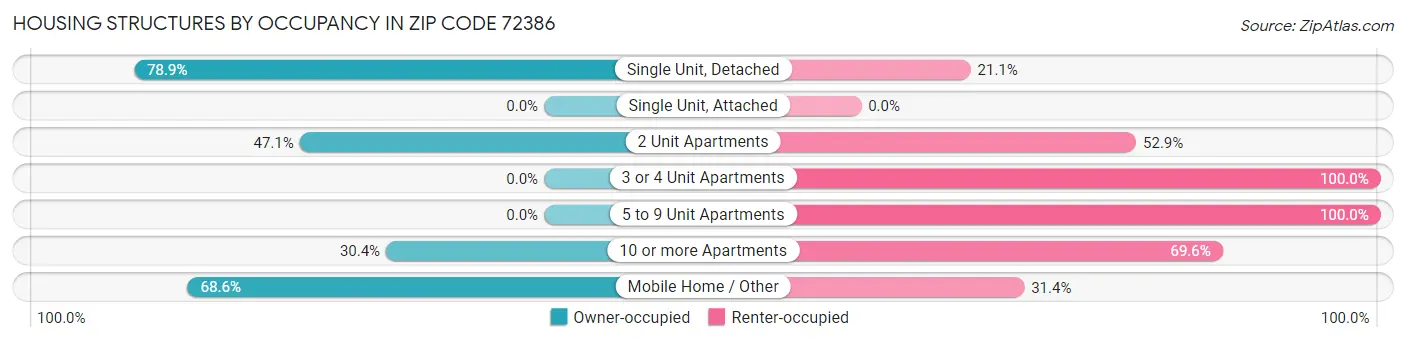
| Structure Type | Owner-occupied | Renter-occupied |
| Single Unit, Detached | 311 (78.9%) | 83 (21.1%) |
| Single Unit, Attached | 0 (0.0%) | 0 (0.0%) |
| 2 Unit Apartments | 8 (47.1%) | 9 (52.9%) |
| 3 or 4 Unit Apartments | 0 (0.0%) | 5 (100.0%) |
| 5 to 9 Unit Apartments | 0 (0.0%) | 11 (100.0%) |
| 10 or more Apartments | 7 (30.4%) | 16 (69.6%) |
| Mobile Home / Other | 83 (68.6%) | 38 (31.4%) |
| Total | 409 (71.6%) | 162 (28.4%) |
Housing Structures by Number of Rooms in Zip Code 72386
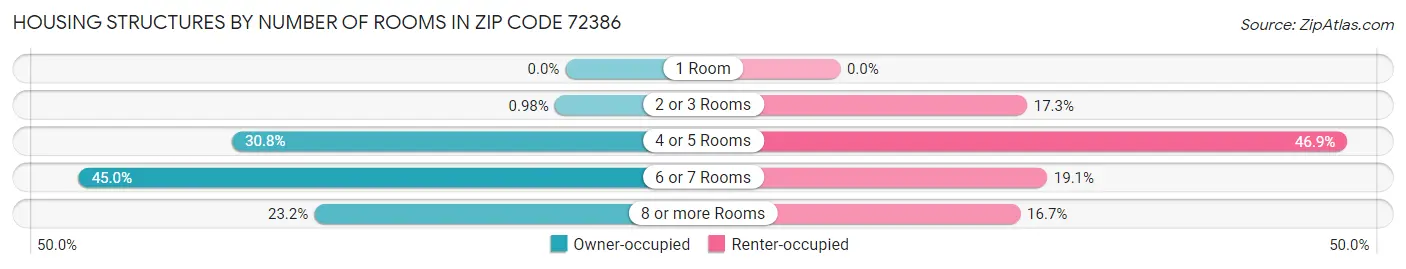
| Number of Rooms | Owner-occupied | Renter-occupied |
| 1 Room | 0 (0.0%) | 0 (0.0%) |
| 2 or 3 Rooms | 4 (1.0%) | 28 (17.3%) |
| 4 or 5 Rooms | 126 (30.8%) | 76 (46.9%) |
| 6 or 7 Rooms | 184 (45.0%) | 31 (19.1%) |
| 8 or more Rooms | 95 (23.2%) | 27 (16.7%) |
| Total | 409 (100.0%) | 162 (100.0%) |
Housing Structure by Heating Type in Zip Code 72386
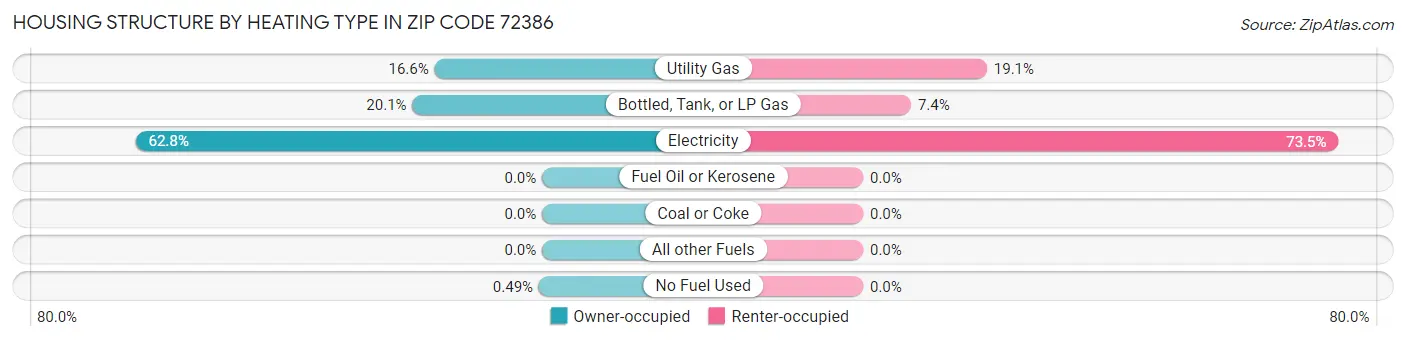
| Heating Type | Owner-occupied | Renter-occupied |
| Utility Gas | 68 (16.6%) | 31 (19.1%) |
| Bottled, Tank, or LP Gas | 82 (20.1%) | 12 (7.4%) |
| Electricity | 257 (62.8%) | 119 (73.5%) |
| Fuel Oil or Kerosene | 0 (0.0%) | 0 (0.0%) |
| Coal or Coke | 0 (0.0%) | 0 (0.0%) |
| All other Fuels | 0 (0.0%) | 0 (0.0%) |
| No Fuel Used | 2 (0.5%) | 0 (0.0%) |
| Total | 409 (100.0%) | 162 (100.0%) |
Household Vehicle Usage in Zip Code 72386
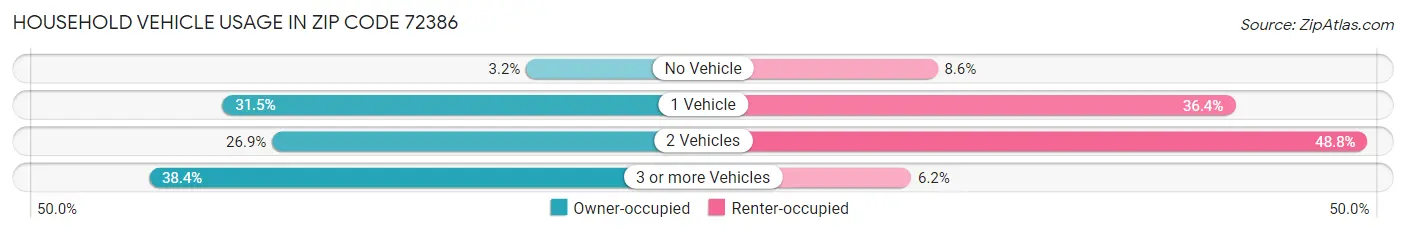
| Vehicles per Household | Owner-occupied | Renter-occupied |
| No Vehicle | 13 (3.2%) | 14 (8.6%) |
| 1 Vehicle | 129 (31.5%) | 59 (36.4%) |
| 2 Vehicles | 110 (26.9%) | 79 (48.8%) |
| 3 or more Vehicles | 157 (38.4%) | 10 (6.2%) |
| Total | 409 (100.0%) | 162 (100.0%) |
Real Estate & Mortgages in Zip Code 72386
Real Estate and Mortgage Overview in Zip Code 72386
| Characteristic | Without Mortgage | With Mortgage |
| Housing Units | 267 | 142 |
| Median Property Value | $69,800 | $80,500 |
| Median Household Income | $44,792 | $42 |
| Monthly Housing Costs | $375 | $0 |
| Real Estate Taxes | $372 | $0 |
Property Value by Mortgage Status in Zip Code 72386
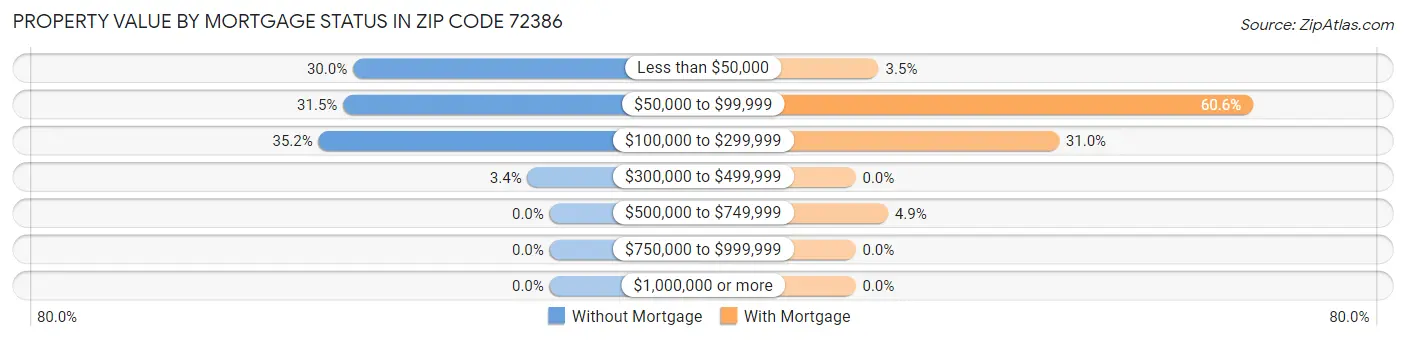
| Property Value | Without Mortgage | With Mortgage |
| Less than $50,000 | 80 (30.0%) | 5 (3.5%) |
| $50,000 to $99,999 | 84 (31.5%) | 86 (60.6%) |
| $100,000 to $299,999 | 94 (35.2%) | 44 (31.0%) |
| $300,000 to $499,999 | 9 (3.4%) | 0 (0.0%) |
| $500,000 to $749,999 | 0 (0.0%) | 7 (4.9%) |
| $750,000 to $999,999 | 0 (0.0%) | 0 (0.0%) |
| $1,000,000 or more | 0 (0.0%) | 0 (0.0%) |
| Total | 267 (100.0%) | 142 (100.0%) |
Household Income by Mortgage Status in Zip Code 72386
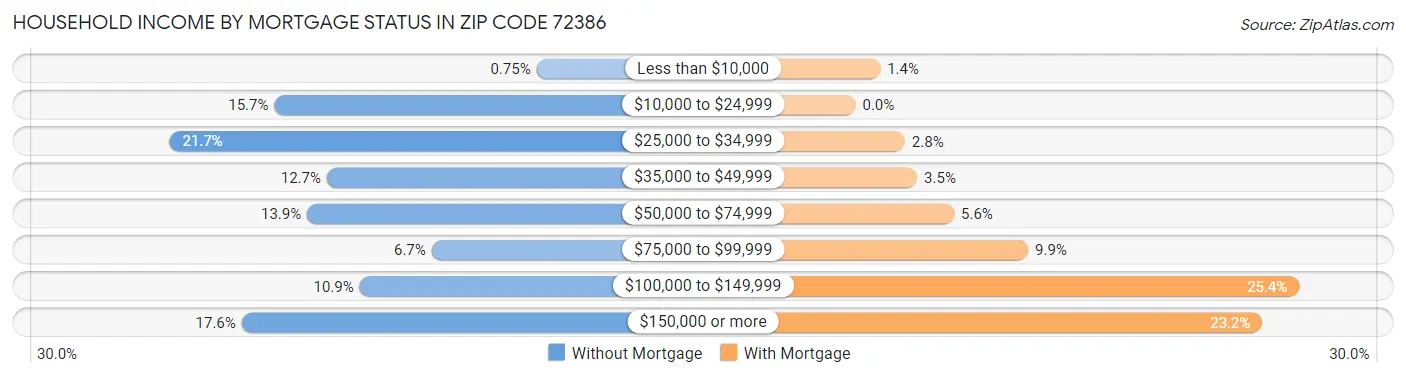
| Household Income | Without Mortgage | With Mortgage |
| Less than $10,000 | 2 (0.7%) | 2 (1.4%) |
| $10,000 to $24,999 | 42 (15.7%) | 0 (0.0%) |
| $25,000 to $34,999 | 58 (21.7%) | 4 (2.8%) |
| $35,000 to $49,999 | 34 (12.7%) | 5 (3.5%) |
| $50,000 to $74,999 | 37 (13.9%) | 8 (5.6%) |
| $75,000 to $99,999 | 18 (6.7%) | 14 (9.9%) |
| $100,000 to $149,999 | 29 (10.9%) | 36 (25.4%) |
| $150,000 or more | 47 (17.6%) | 33 (23.2%) |
| Total | 267 (100.0%) | 142 (100.0%) |
Property Value to Household Income Ratio in Zip Code 72386
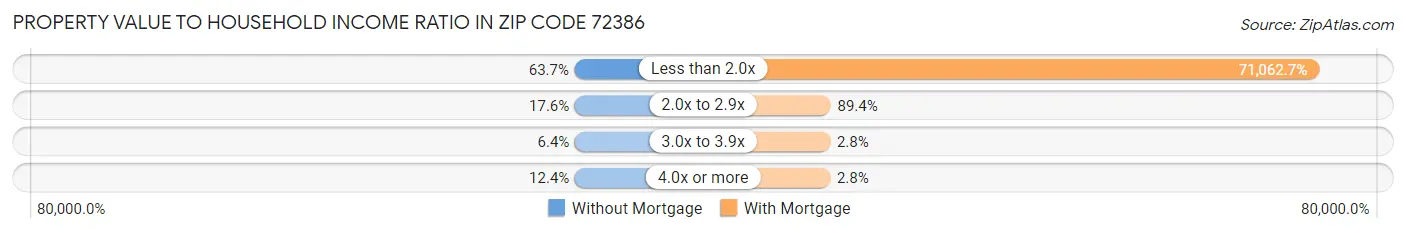
| Value-to-Income Ratio | Without Mortgage | With Mortgage |
| Less than 2.0x | 170 (63.7%) | 100,909 (71,062.7%) |
| 2.0x to 2.9x | 47 (17.6%) | 127 (89.4%) |
| 3.0x to 3.9x | 17 (6.4%) | 4 (2.8%) |
| 4.0x or more | 33 (12.4%) | 4 (2.8%) |
| Total | 267 (100.0%) | 142 (100.0%) |
Real Estate Taxes by Mortgage Status in Zip Code 72386
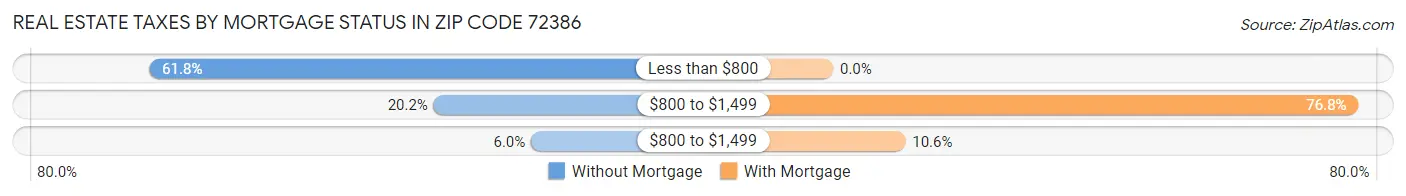
| Property Taxes | Without Mortgage | With Mortgage |
| Less than $800 | 165 (61.8%) | 0 (0.0%) |
| $800 to $1,499 | 54 (20.2%) | 109 (76.8%) |
| $800 to $1,499 | 16 (6.0%) | 15 (10.6%) |
| Total | 267 (100.0%) | 142 (100.0%) |
Health & Disability in Zip Code 72386
Health Insurance Coverage by Age in Zip Code 72386
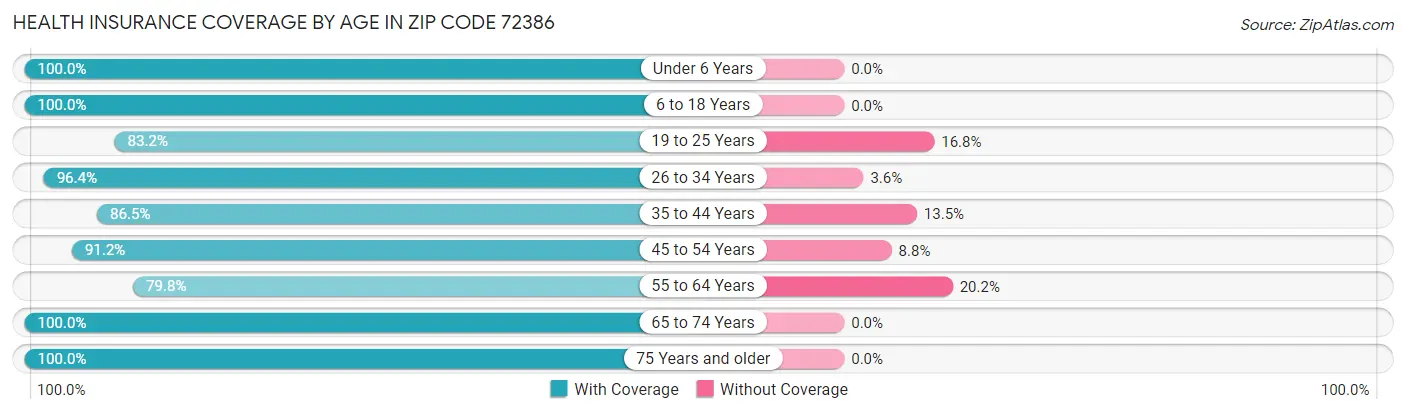
| Age Bracket | With Coverage | Without Coverage |
| Under 6 Years | 43 (100.0%) | 0 (0.0%) |
| 6 to 18 Years | 378 (100.0%) | 0 (0.0%) |
| 19 to 25 Years | 109 (83.2%) | 22 (16.8%) |
| 26 to 34 Years | 108 (96.4%) | 4 (3.6%) |
| 35 to 44 Years | 166 (86.5%) | 26 (13.5%) |
| 45 to 54 Years | 289 (91.2%) | 28 (8.8%) |
| 55 to 64 Years | 142 (79.8%) | 36 (20.2%) |
| 65 to 74 Years | 121 (100.0%) | 0 (0.0%) |
| 75 Years and older | 79 (100.0%) | 0 (0.0%) |
| Total | 1,435 (92.5%) | 116 (7.5%) |
Health Insurance Coverage by Citizenship Status in Zip Code 72386
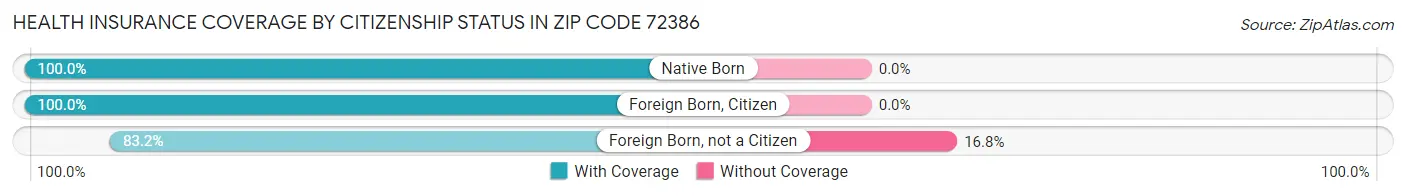
| Citizenship Status | With Coverage | Without Coverage |
| Native Born | 43 (100.0%) | 0 (0.0%) |
| Foreign Born, Citizen | 378 (100.0%) | 0 (0.0%) |
| Foreign Born, not a Citizen | 109 (83.2%) | 22 (16.8%) |
Health Insurance Coverage by Household Income in Zip Code 72386
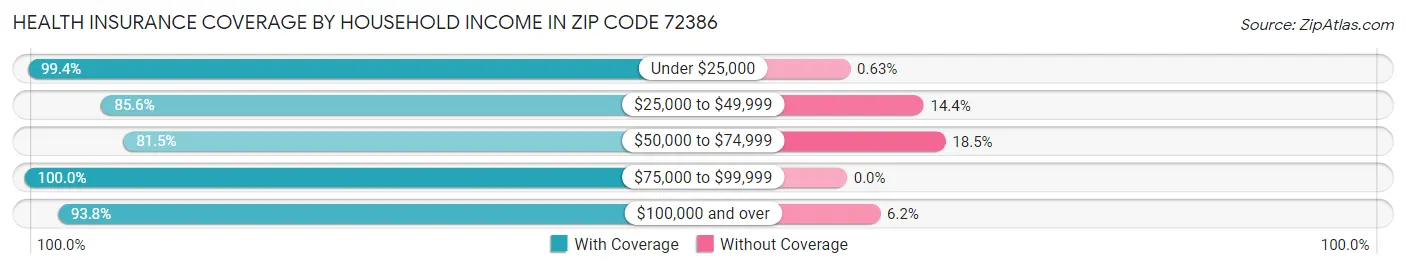
| Household Income | With Coverage | Without Coverage |
| Under $25,000 | 313 (99.4%) | 2 (0.6%) |
| $25,000 to $49,999 | 262 (85.6%) | 44 (14.4%) |
| $50,000 to $74,999 | 150 (81.5%) | 34 (18.5%) |
| $75,000 to $99,999 | 169 (100.0%) | 0 (0.0%) |
| $100,000 and over | 541 (93.8%) | 36 (6.2%) |
Public vs Private Health Insurance Coverage by Age in Zip Code 72386
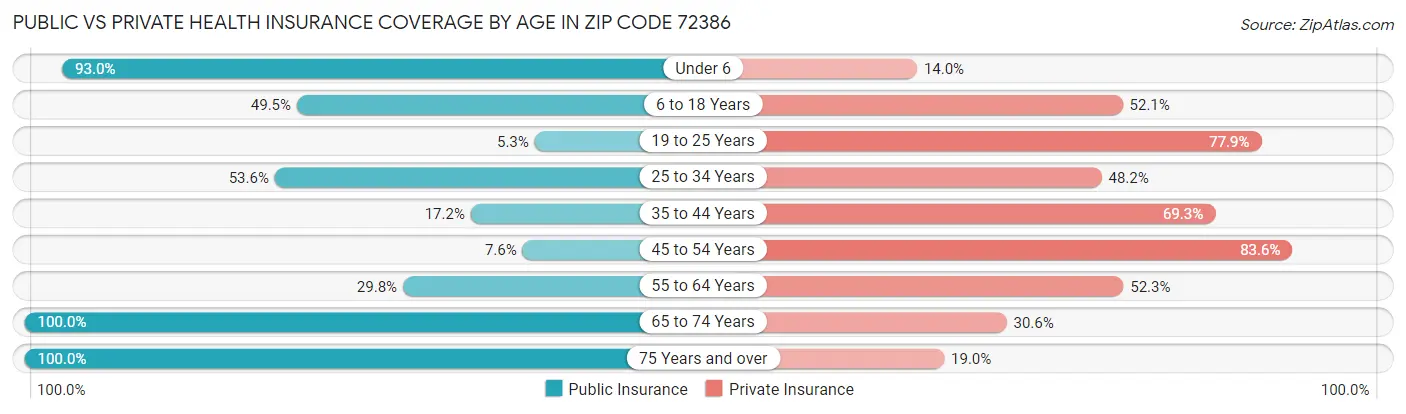
| Age Bracket | Public Insurance | Private Insurance |
| Under 6 | 40 (93.0%) | 6 (14.0%) |
| 6 to 18 Years | 187 (49.5%) | 197 (52.1%) |
| 19 to 25 Years | 7 (5.3%) | 102 (77.9%) |
| 25 to 34 Years | 60 (53.6%) | 54 (48.2%) |
| 35 to 44 Years | 33 (17.2%) | 133 (69.3%) |
| 45 to 54 Years | 24 (7.6%) | 265 (83.6%) |
| 55 to 64 Years | 53 (29.8%) | 93 (52.2%) |
| 65 to 74 Years | 121 (100.0%) | 37 (30.6%) |
| 75 Years and over | 79 (100.0%) | 15 (19.0%) |
| Total | 604 (38.9%) | 902 (58.2%) |
Disability Status by Sex by Age in Zip Code 72386
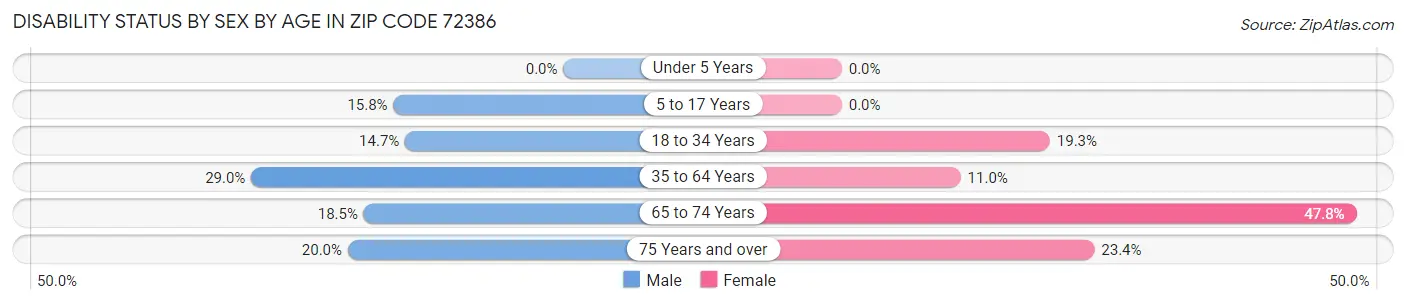
| Age Bracket | Male | Female |
| Under 5 Years | 0 (0.0%) | 0 (0.0%) |
| 5 to 17 Years | 41 (15.8%) | 0 (0.0%) |
| 18 to 34 Years | 16 (14.7%) | 28 (19.3%) |
| 35 to 64 Years | 115 (29.0%) | 32 (11.0%) |
| 65 to 74 Years | 10 (18.5%) | 32 (47.8%) |
| 75 Years and over | 3 (20.0%) | 15 (23.4%) |
Disability Class by Sex by Age in Zip Code 72386
Disability Class: Hearing Difficulty
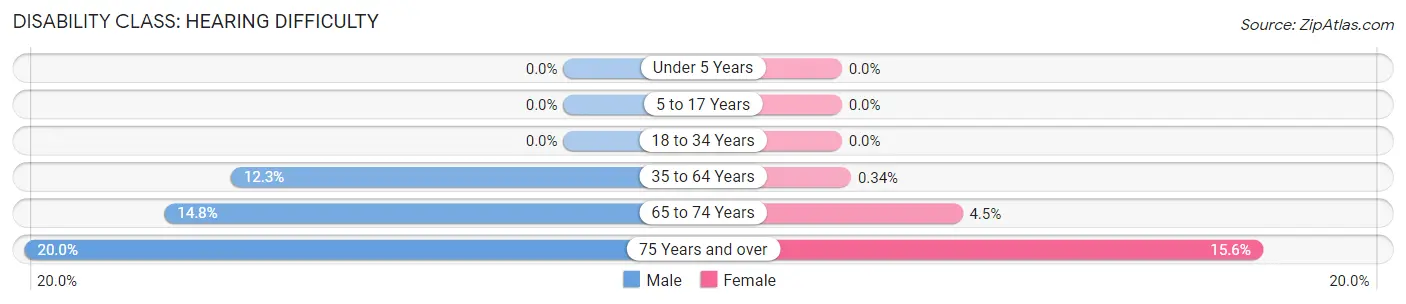
| Age Bracket | Male | Female |
| Under 5 Years | 0 (0.0%) | 0 (0.0%) |
| 5 to 17 Years | 0 (0.0%) | 0 (0.0%) |
| 18 to 34 Years | 0 (0.0%) | 0 (0.0%) |
| 35 to 64 Years | 49 (12.3%) | 1 (0.3%) |
| 65 to 74 Years | 8 (14.8%) | 3 (4.5%) |
| 75 Years and over | 3 (20.0%) | 10 (15.6%) |
Disability Class: Vision Difficulty
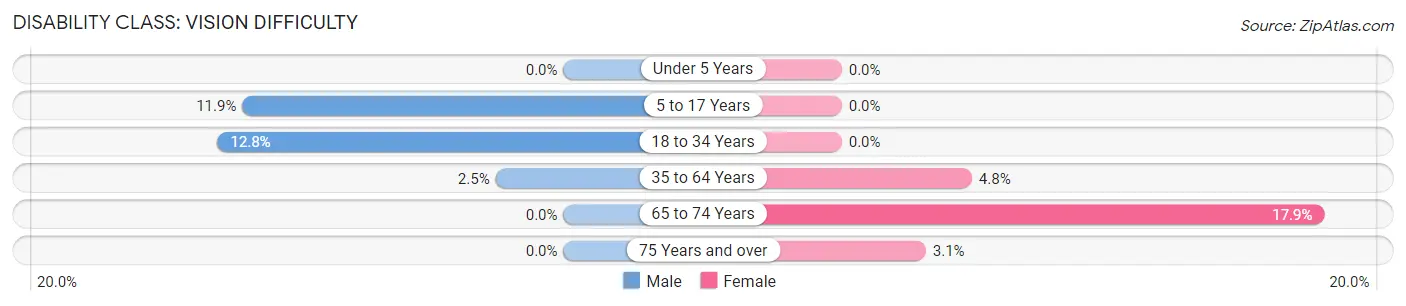
| Age Bracket | Male | Female |
| Under 5 Years | 0 (0.0%) | 0 (0.0%) |
| 5 to 17 Years | 31 (11.9%) | 0 (0.0%) |
| 18 to 34 Years | 14 (12.8%) | 0 (0.0%) |
| 35 to 64 Years | 10 (2.5%) | 14 (4.8%) |
| 65 to 74 Years | 0 (0.0%) | 12 (17.9%) |
| 75 Years and over | 0 (0.0%) | 2 (3.1%) |
Disability Class: Cognitive Difficulty
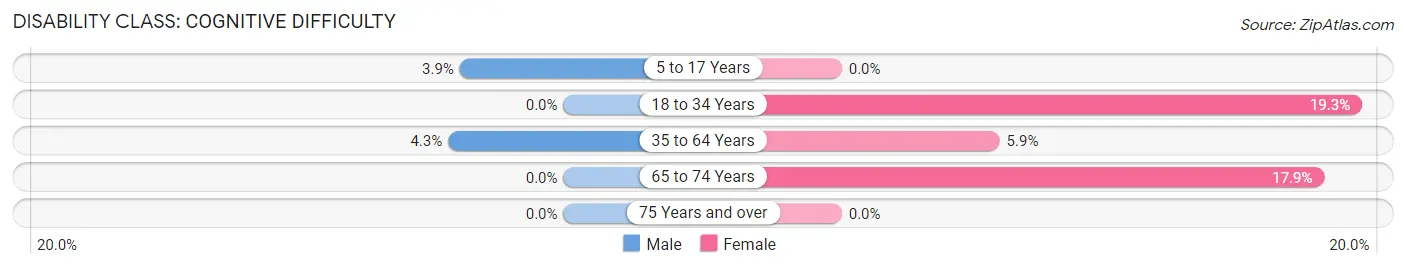
| Age Bracket | Male | Female |
| 5 to 17 Years | 10 (3.8%) | 0 (0.0%) |
| 18 to 34 Years | 0 (0.0%) | 28 (19.3%) |
| 35 to 64 Years | 17 (4.3%) | 17 (5.9%) |
| 65 to 74 Years | 0 (0.0%) | 12 (17.9%) |
| 75 Years and over | 0 (0.0%) | 0 (0.0%) |
Disability Class: Ambulatory Difficulty
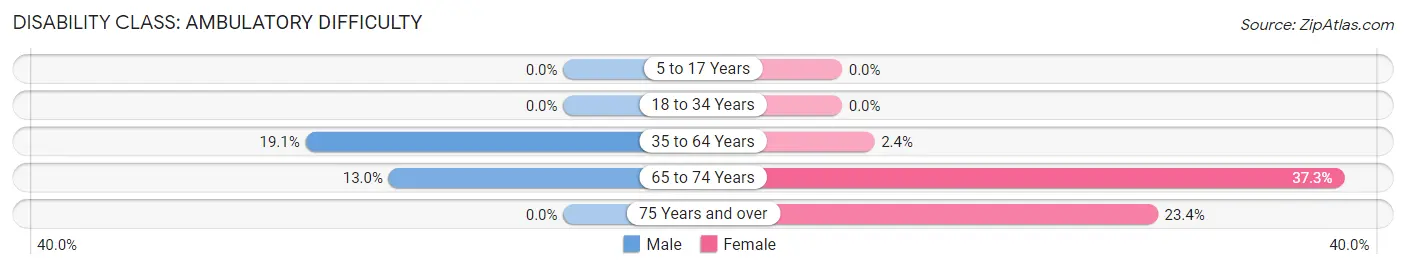
| Age Bracket | Male | Female |
| 5 to 17 Years | 0 (0.0%) | 0 (0.0%) |
| 18 to 34 Years | 0 (0.0%) | 0 (0.0%) |
| 35 to 64 Years | 76 (19.1%) | 7 (2.4%) |
| 65 to 74 Years | 7 (13.0%) | 25 (37.3%) |
| 75 Years and over | 0 (0.0%) | 15 (23.4%) |
Disability Class: Self-Care Difficulty
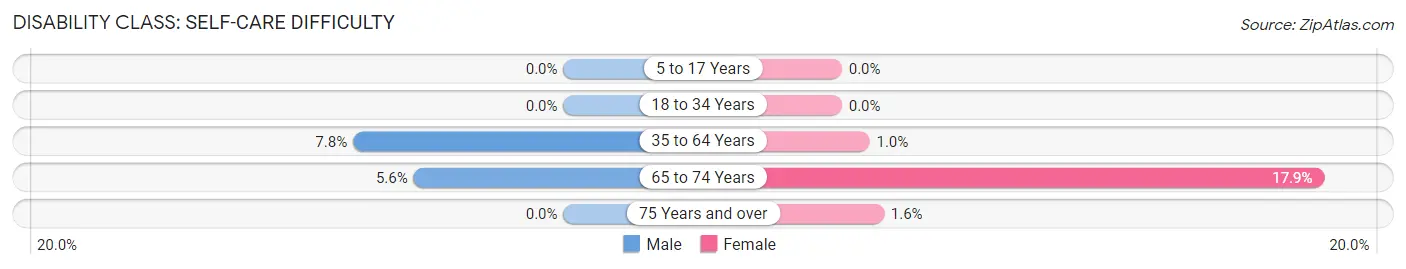
| Age Bracket | Male | Female |
| 5 to 17 Years | 0 (0.0%) | 0 (0.0%) |
| 18 to 34 Years | 0 (0.0%) | 0 (0.0%) |
| 35 to 64 Years | 31 (7.8%) | 3 (1.0%) |
| 65 to 74 Years | 3 (5.6%) | 12 (17.9%) |
| 75 Years and over | 0 (0.0%) | 1 (1.6%) |
Technology Access in Zip Code 72386
Computing Device Access in Zip Code 72386
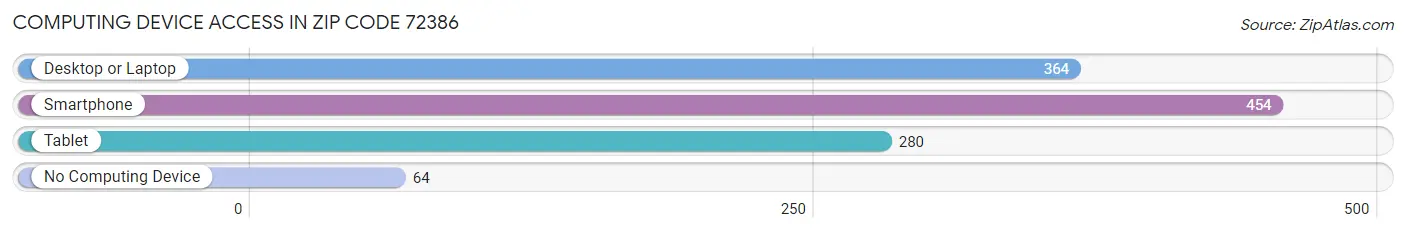
| Device Type | # Households | % Households |
| Desktop or Laptop | 364 | 63.7% |
| Smartphone | 454 | 79.5% |
| Tablet | 280 | 49.0% |
| No Computing Device | 64 | 11.2% |
| Total | 571 | 100.0% |
Internet Access in Zip Code 72386
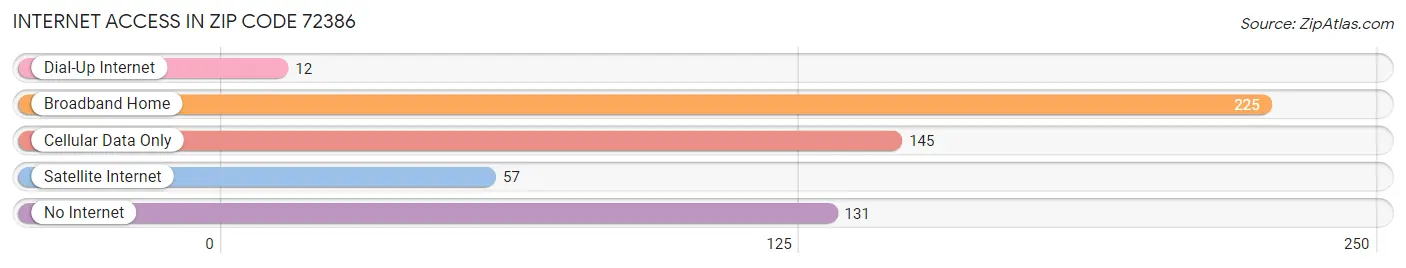
| Internet Type | # Households | % Households |
| Dial-Up Internet | 12 | 2.1% |
| Broadband Home | 225 | 39.4% |
| Cellular Data Only | 145 | 25.4% |
| Satellite Internet | 57 | 10.0% |
| No Internet | 131 | 22.9% |
| Total | 571 | 100.0% |
Common Questions
What is Per Capita Income in Zip Code 72386?
Per Capita income in Zip Code 72386 is $27,996.
What is the Median Family Income in Zip Code 72386?
Median Family Income in Zip Code 72386 is $79,063.
What is the Median Household income in Zip Code 72386?
Median Household Income in Zip Code 72386 is $50,096.
What is Income or Wage Gap in Zip Code 72386?
Income or Wage Gap in Zip Code 72386 is 26.1%.
Women in Zip Code 72386 earn 73.9 cents for every dollar earned by a man.
What is Family Income Deficit in Zip Code 72386?
Family Income Deficit in Zip Code 72386 is $11,534.
Families that are below poverty line in Zip Code 72386 earn $11,534 less on average than the poverty threshold level.
What is Inequality or Gini Index in Zip Code 72386?
Inequality or Gini Index in Zip Code 72386 is 0.43.
What is the Total Population of Zip Code 72386?
Total Population of Zip Code 72386 is 1,551.
What is the Total Male Population of Zip Code 72386?
Total Male Population of Zip Code 72386 is 850.
What is the Total Female Population of Zip Code 72386?
Total Female Population of Zip Code 72386 is 701.
What is the Ratio of Males per 100 Females in Zip Code 72386?
There are 121.26 Males per 100 Females in Zip Code 72386.
What is the Ratio of Females per 100 Males in Zip Code 72386?
There are 82.47 Females per 100 Males in Zip Code 72386.
What is the Median Population Age in Zip Code 72386?
Median Population Age in Zip Code 72386 is 41.7 Years.
What is the Average Family Size in Zip Code 72386
Average Family Size in Zip Code 72386 is 3.4 People.
What is the Average Household Size in Zip Code 72386
Average Household Size in Zip Code 72386 is 2.7 People.
How Large is the Labor Force in Zip Code 72386?
There are 794 People in the Labor Forcein in Zip Code 72386.
What is the Percentage of People in the Labor Force in Zip Code 72386?
64.9% of People are in the Labor Force in Zip Code 72386.
What is the Unemployment Rate in Zip Code 72386?
Unemployment Rate in Zip Code 72386 is 4.3%.