Zip Codes with the Highest Percentage of Renter-Occupied Units in Russellville, AR
RELATED REPORTS & OPTIONS
Highest Renter-Occupied
Russellville
Compare Zip Codes
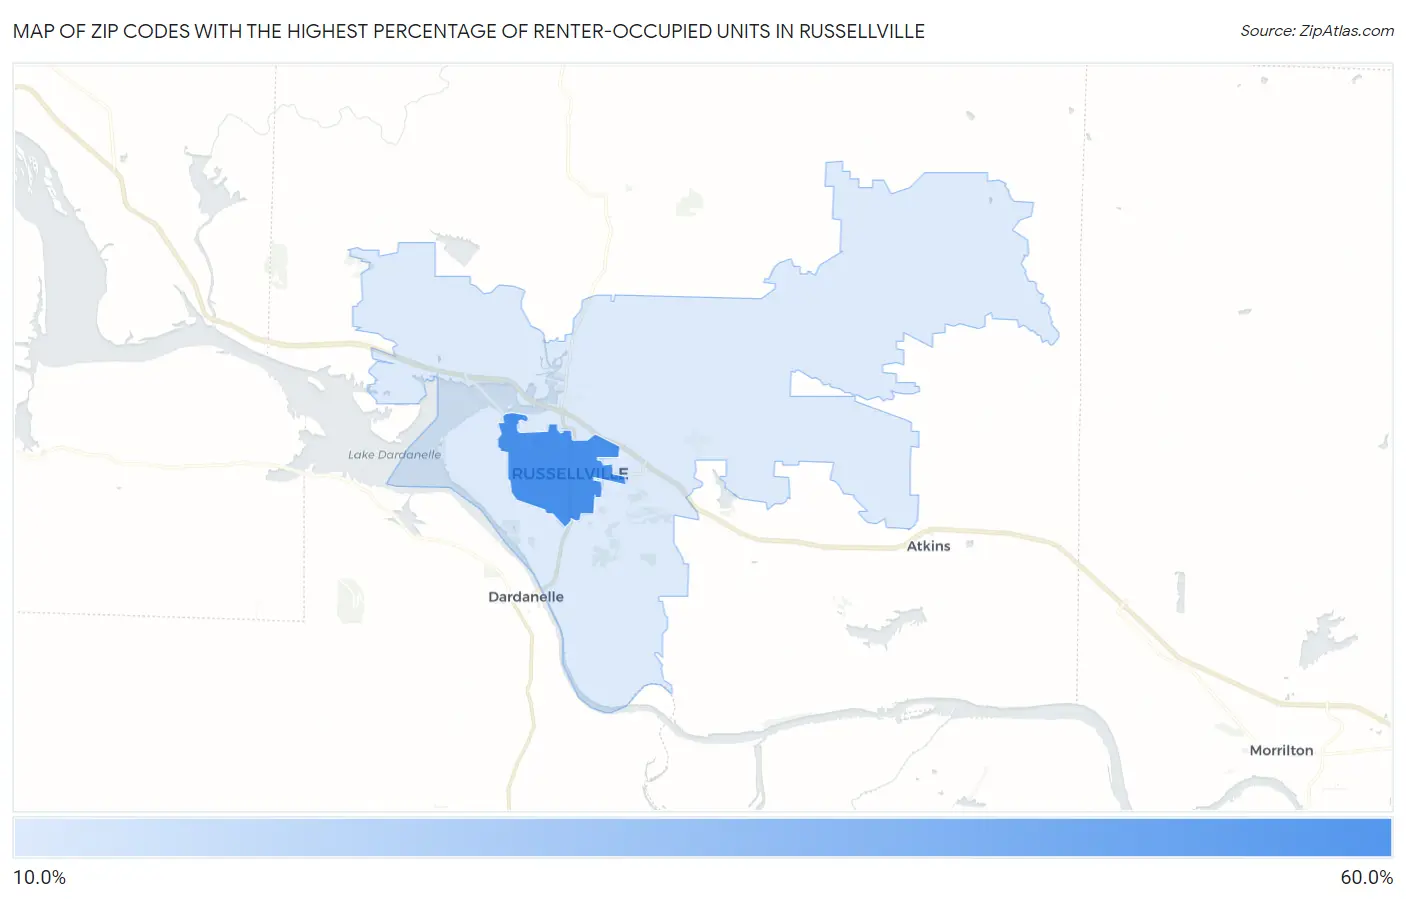
Map of Zip Codes with the Highest Percentage of Renter-Occupied Units in Russellville
0.0%
60.0%
Zip Codes with the Highest Percentage of Renter-Occupied Units in Russellville, AR
| Zip Code | % Renter-Occupied | vs State | vs National | |
| 1. | 72801 | 53.6% | 33.8%(+19.8)#34 | 35.2%(+18.4)#2,525 |
| 2. | 72802 | 18.2% | 33.8%(-15.6)#372 | 35.2%(-17.0)#19,962 |
1
Common Questions
What are the Top Zip Codes with the Highest Percentage of Renter-Occupied Units in Russellville, AR?
Top Zip Codes with the Highest Percentage of Renter-Occupied Units in Russellville, AR are:
What zip code has the Highest Percentage of Renter-Occupied Units in Russellville, AR?
72801 has the Highest Percentage of Renter-Occupied Units in Russellville, AR with 53.6%.
What is the Percentage of Renter-Occupied Units in Russellville, AR?
Percentage of Renter-Occupied Units in Russellville is 41.2%.
What is the Percentage of Renter-Occupied Units in Arkansas?
Percentage of Renter-Occupied Units in Arkansas is 33.8%.
What is the Percentage of Renter-Occupied Units in the United States?
Percentage of Renter-Occupied Units in the United States is 35.2%.