Ozark, AR
Ozark Map
Ozark Overview
3,546
TOTAL POPULATION
1,617
MALE POPULATION
1,929
FEMALE POPULATION
83.83
MALES / 100 FEMALES
119.29
FEMALES / 100 MALES
33.4
MEDIAN AGE
3.0
AVG FAMILY SIZE
2.5
AVG HOUSEHOLD SIZE
$19,220
PER CAPITA INCOME
$49,429
AVG FAMILY INCOME
$41,816
AVG HOUSEHOLD INCOME
9.6%
WAGE / INCOME GAP [ % ]
90.4¢/ $1
WAGE / INCOME GAP [ $ ]
$10,833
FAMILY INCOME DEFICIT
0.37
INEQUALITY / GINI INDEX
1,389
LABOR FORCE [ PEOPLE ]
49.1%
PERCENT IN LABOR FORCE
11.7%
UNEMPLOYMENT RATE
Ozark Zip Codes
Ozark Area Codes
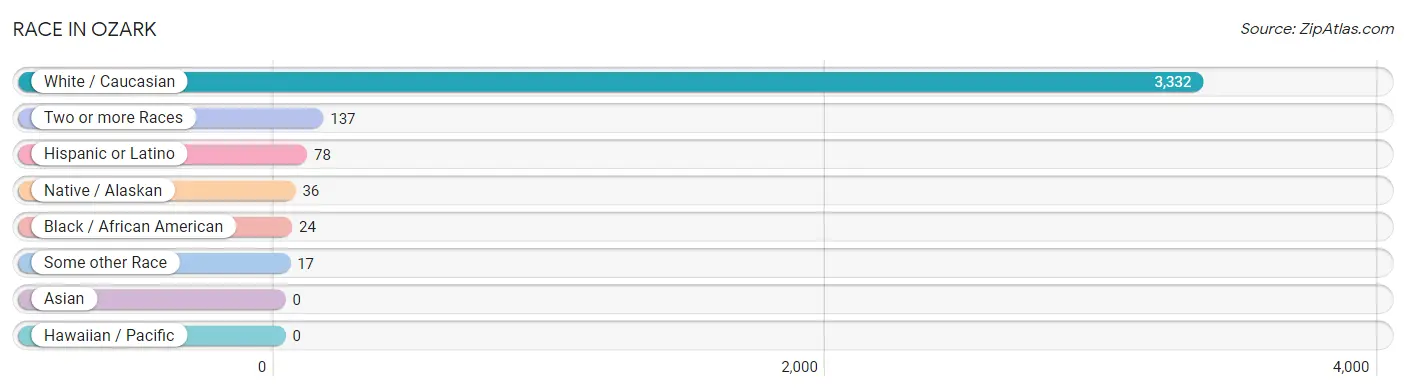
Race in Ozark
The most populous races in Ozark are White / Caucasian (3,332 | 94.0%), Two or more Races (137 | 3.9%), and Hispanic or Latino (78 | 2.2%).
| Race | # Population | % Population |
| Asian | 0 | 0.0% |
| Black / African American | 24 | 0.7% |
| Hawaiian / Pacific | 0 | 0.0% |
| Hispanic or Latino | 78 | 2.2% |
| Native / Alaskan | 36 | 1.0% |
| White / Caucasian | 3,332 | 94.0% |
| Two or more Races | 137 | 3.9% |
| Some other Race | 17 | 0.5% |
| Total | 3,546 | 100.0% |
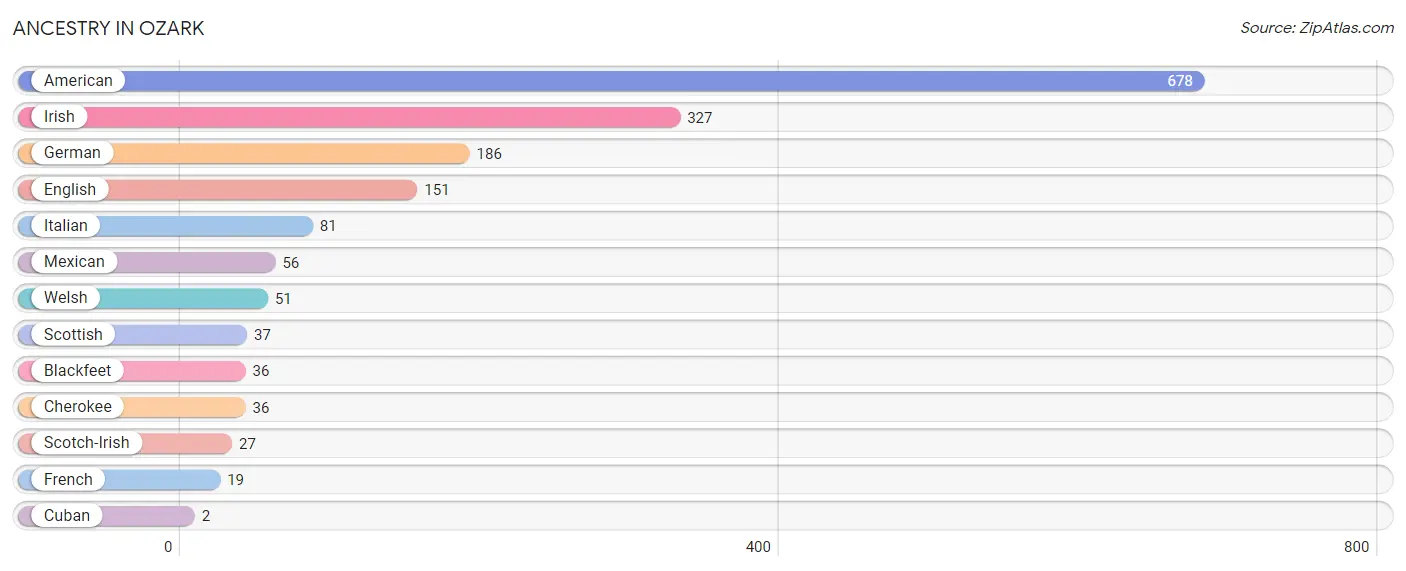
Ancestry in Ozark
The most populous ancestries reported in Ozark are American (678 | 19.1%), Irish (327 | 9.2%), German (186 | 5.2%), English (151 | 4.3%), and Italian (81 | 2.3%), together accounting for 40.1% of all Ozark residents.
| Ancestry | # Population | % Population |
| American | 678 | 19.1% |
| Blackfeet | 36 | 1.0% |
| Cherokee | 36 | 1.0% |
| Cuban | 2 | 0.1% |
| English | 151 | 4.3% |
| French | 19 | 0.5% |
| German | 186 | 5.2% |
| Irish | 327 | 9.2% |
| Italian | 81 | 2.3% |
| Mexican | 56 | 1.6% |
| Scotch-Irish | 27 | 0.8% |
| Scottish | 37 | 1.0% |
| Welsh | 51 | 1.4% | View All 13 Rows |
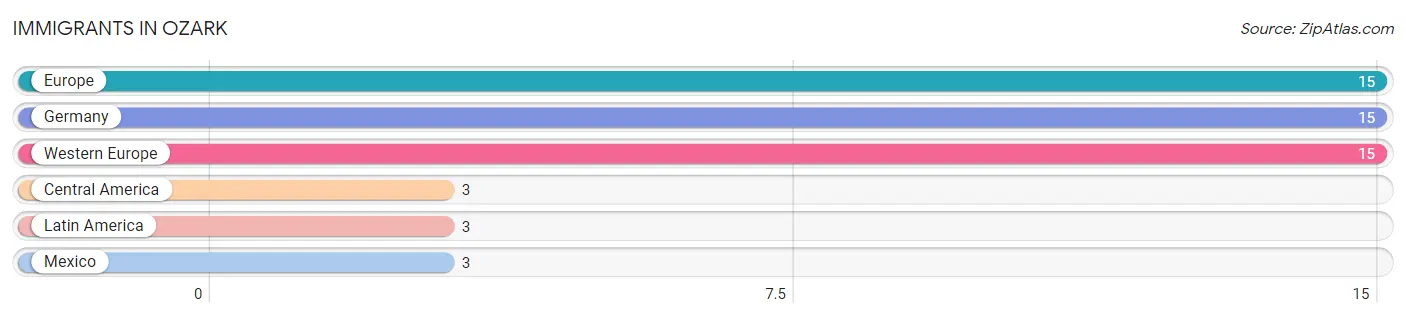
Immigrants in Ozark
The most numerous immigrant groups reported in Ozark came from Europe (15 | 0.4%), Germany (15 | 0.4%), Western Europe (15 | 0.4%), Central America (3 | 0.1%), and Latin America (3 | 0.1%), together accounting for 1.4% of all Ozark residents.
| Immigration Origin | # Population | % Population |
| Central America | 3 | 0.1% |
| Europe | 15 | 0.4% |
| Germany | 15 | 0.4% |
| Latin America | 3 | 0.1% |
| Mexico | 3 | 0.1% |
| Western Europe | 15 | 0.4% | View All 6 Rows |
Sex and Age in Ozark
Sex and Age in Ozark
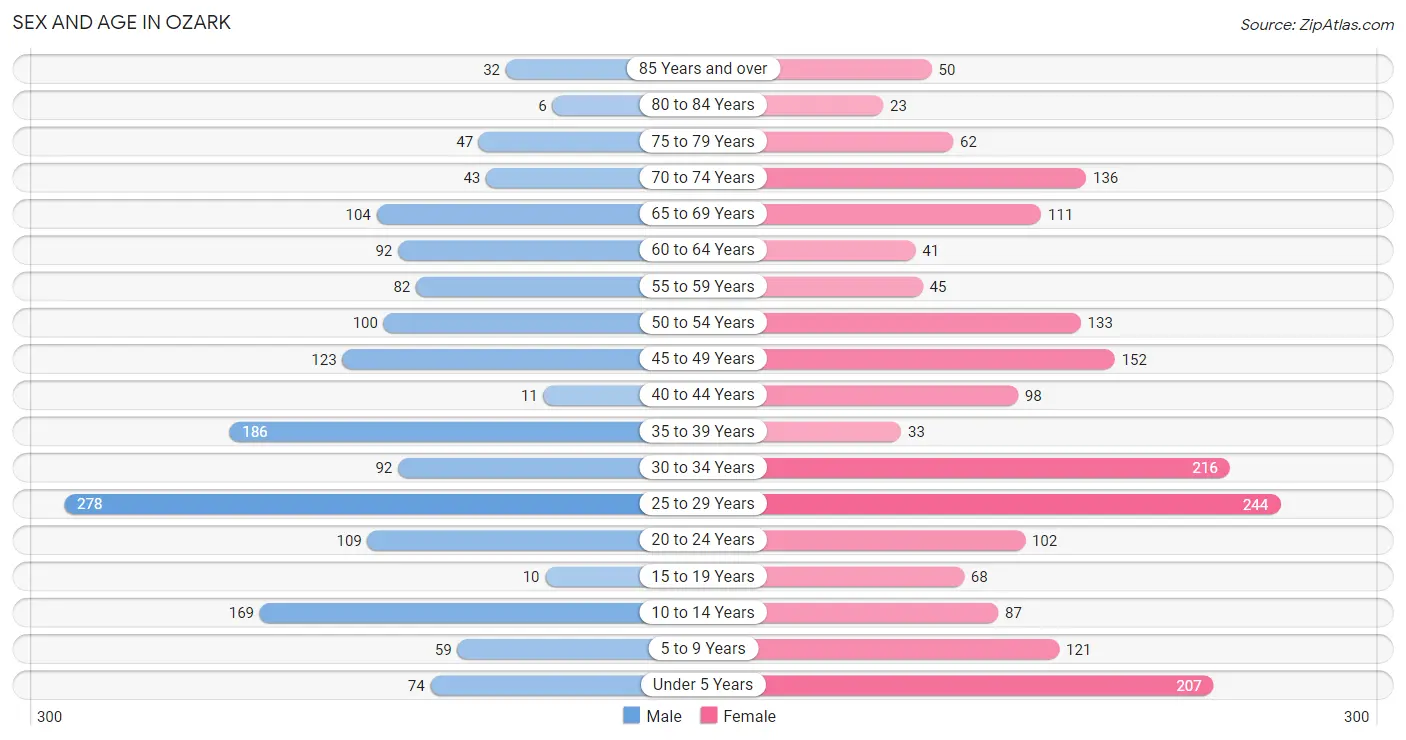
The most populous age groups in Ozark are 25 to 29 Years (278 | 17.2%) for men and 25 to 29 Years (244 | 12.7%) for women.
| Age Bracket | Male | Female |
| Under 5 Years | 74 (4.6%) | 207 (10.7%) |
| 5 to 9 Years | 59 (3.6%) | 121 (6.3%) |
| 10 to 14 Years | 169 (10.4%) | 87 (4.5%) |
| 15 to 19 Years | 10 (0.6%) | 68 (3.5%) |
| 20 to 24 Years | 109 (6.7%) | 102 (5.3%) |
| 25 to 29 Years | 278 (17.2%) | 244 (12.7%) |
| 30 to 34 Years | 92 (5.7%) | 216 (11.2%) |
| 35 to 39 Years | 186 (11.5%) | 33 (1.7%) |
| 40 to 44 Years | 11 (0.7%) | 98 (5.1%) |
| 45 to 49 Years | 123 (7.6%) | 152 (7.9%) |
| 50 to 54 Years | 100 (6.2%) | 133 (6.9%) |
| 55 to 59 Years | 82 (5.1%) | 45 (2.3%) |
| 60 to 64 Years | 92 (5.7%) | 41 (2.1%) |
| 65 to 69 Years | 104 (6.4%) | 111 (5.8%) |
| 70 to 74 Years | 43 (2.7%) | 136 (7.0%) |
| 75 to 79 Years | 47 (2.9%) | 62 (3.2%) |
| 80 to 84 Years | 6 (0.4%) | 23 (1.2%) |
| 85 Years and over | 32 (2.0%) | 50 (2.6%) |
| Total | 1,617 (100.0%) | 1,929 (100.0%) |
Families and Households in Ozark
Median Family Size in Ozark
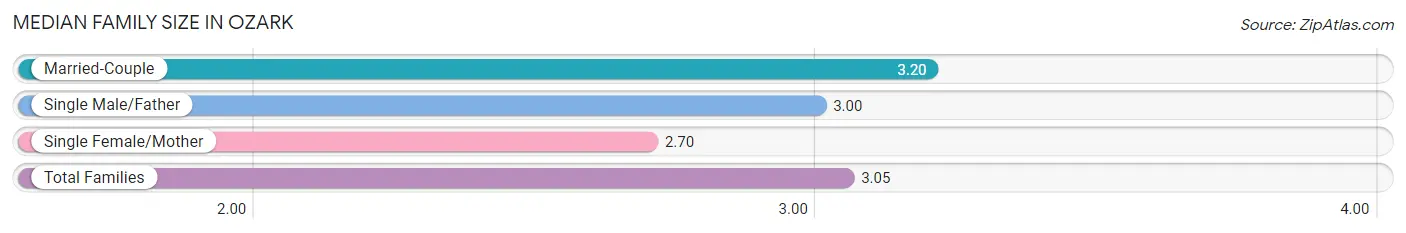
The median family size in Ozark is 3.05 persons per family, with married-couple families (510 | 65.8%) accounting for the largest median family size of 3.2 persons per family. On the other hand, single female/mother families (212 | 27.4%) represent the smallest median family size with 2.70 persons per family.
| Family Type | # Families | Family Size |
| Married-Couple | 510 (65.8%) | 3.20 |
| Single Male/Father | 53 (6.8%) | 3.00 |
| Single Female/Mother | 212 (27.4%) | 2.70 |
| Total Families | 775 (100.0%) | 3.05 |
Median Household Size in Ozark
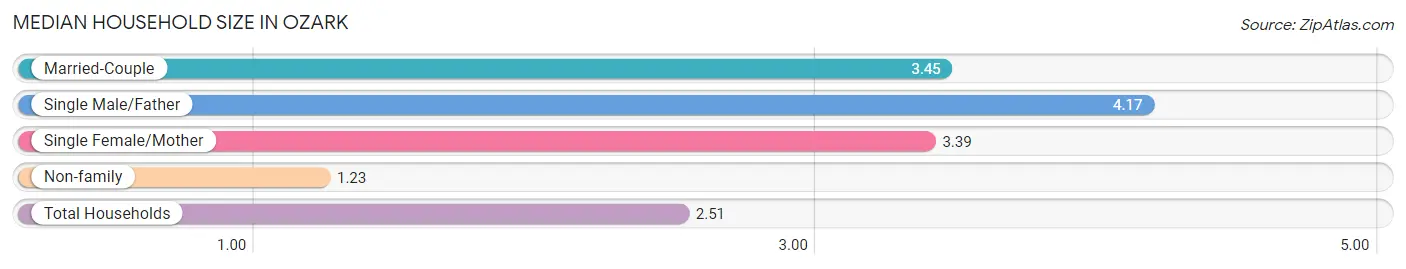
The median household size in Ozark is 2.51 persons per household, with single male/father households (53 | 3.9%) accounting for the largest median household size of 4.17 persons per household. non-family households (586 | 43.1%) represent the smallest median household size with 1.23 persons per household.
| Household Type | # Households | Household Size |
| Married-Couple | 510 (37.5%) | 3.45 |
| Single Male/Father | 53 (3.9%) | 4.17 |
| Single Female/Mother | 212 (15.6%) | 3.39 |
| Non-family | 586 (43.1%) | 1.23 |
| Total Households | 1,361 (100.0%) | 2.51 |
Household Size by Marriage Status in Ozark
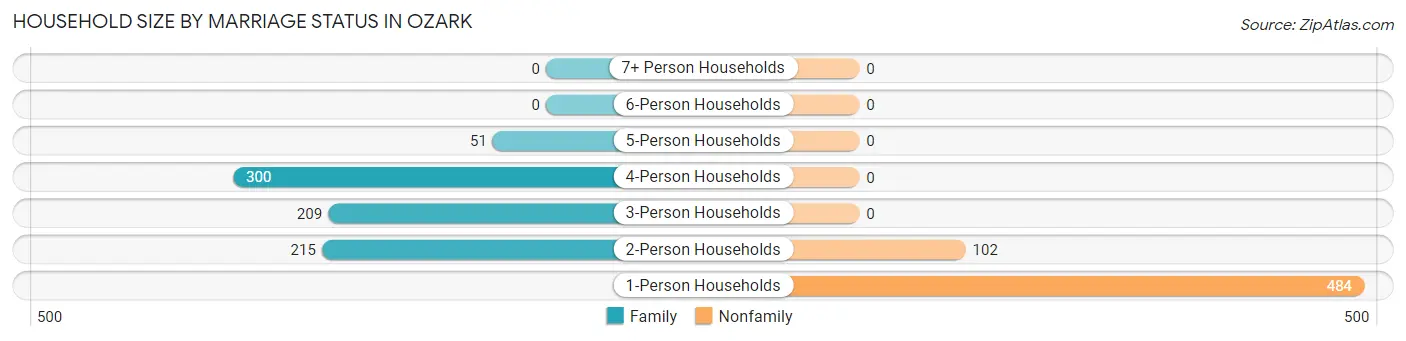
Out of a total of 1,361 households in Ozark, 775 (56.9%) are family households, while 586 (43.1%) are nonfamily households. The most numerous type of family households are 4-person households, comprising 300, and the most common type of nonfamily households are 1-person households, comprising 484.
| Household Size | Family Households | Nonfamily Households |
| 1-Person Households | - | 484 (35.6%) |
| 2-Person Households | 215 (15.8%) | 102 (7.5%) |
| 3-Person Households | 209 (15.4%) | 0 (0.0%) |
| 4-Person Households | 300 (22.0%) | 0 (0.0%) |
| 5-Person Households | 51 (3.7%) | 0 (0.0%) |
| 6-Person Households | 0 (0.0%) | 0 (0.0%) |
| 7+ Person Households | 0 (0.0%) | 0 (0.0%) |
| Total | 775 (56.9%) | 586 (43.1%) |
Female Fertility in Ozark
Fertility by Age in Ozark
Average fertility rate in Ozark is 266.0 births per 1,000 women. Women in the age bracket of 15 to 19 years have the highest fertility rate with 809.0 births per 1,000 women. Women in the age bracket of 20 to 34 years acount for 77.4% of all women with births.
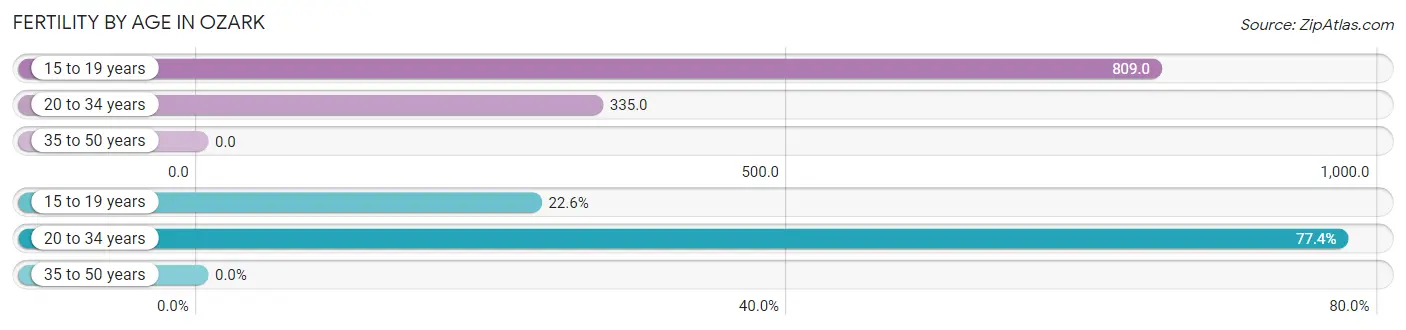
| Age Bracket | Women with Births | Births / 1,000 Women |
| 15 to 19 years | 55 (22.6%) | 809.0 |
| 20 to 34 years | 188 (77.4%) | 335.0 |
| 35 to 50 years | 0 (0.0%) | 0.0 |
| Total | 243 (100.0%) | 266.0 |
Fertility by Age by Marriage Status in Ozark
9.5% of women with births (243) in Ozark are married. The highest percentage of unmarried women with births falls into 15 to 19 years age bracket with 100.0% of them unmarried at the time of birth, while the lowest percentage of unmarried women with births belong to 20 to 34 years age bracket with 87.8% of them unmarried.
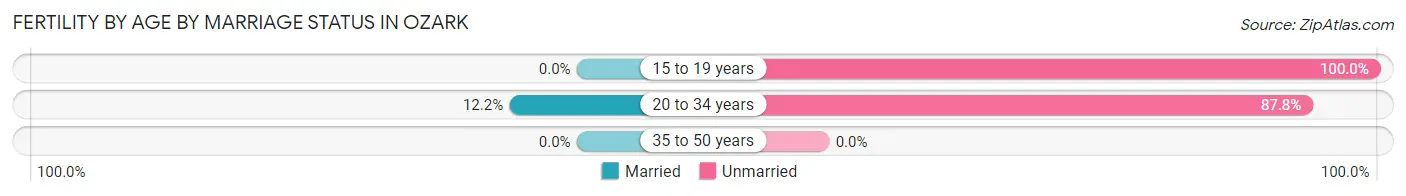
| Age Bracket | Married | Unmarried |
| 15 to 19 years | 0 (0.0%) | 55 (100.0%) |
| 20 to 34 years | 23 (12.2%) | 165 (87.8%) |
| 35 to 50 years | 0 (0.0%) | 0 (0.0%) |
| Total | 23 (9.5%) | 220 (90.5%) |
Fertility by Education in Ozark
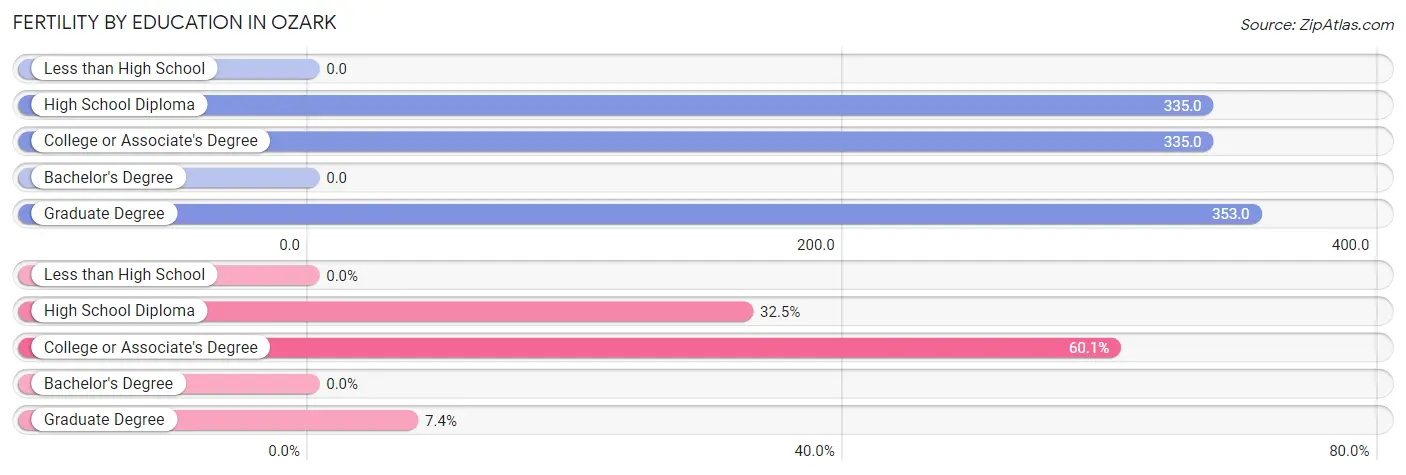
| Educational Attainment | Women with Births | Births / 1,000 Women |
| Less than High School | 0 (0.0%) | 0.0 |
| High School Diploma | 79 (32.5%) | 335.0 |
| College or Associate's Degree | 146 (60.1%) | 335.0 |
| Bachelor's Degree | 0 (0.0%) | 0.0 |
| Graduate Degree | 18 (7.4%) | 353.0 |
| Total | 243 (100.0%) | 266.0 |
Fertility by Education by Marriage Status in Ozark
90.5% of women with births in Ozark are unmarried. Women with the educational attainment of graduate degree are most likely to be married with 100.0% of them married at childbirth, while women with the educational attainment of high school diploma are least likely to be married with 100.0% of them unmarried at childbirth.
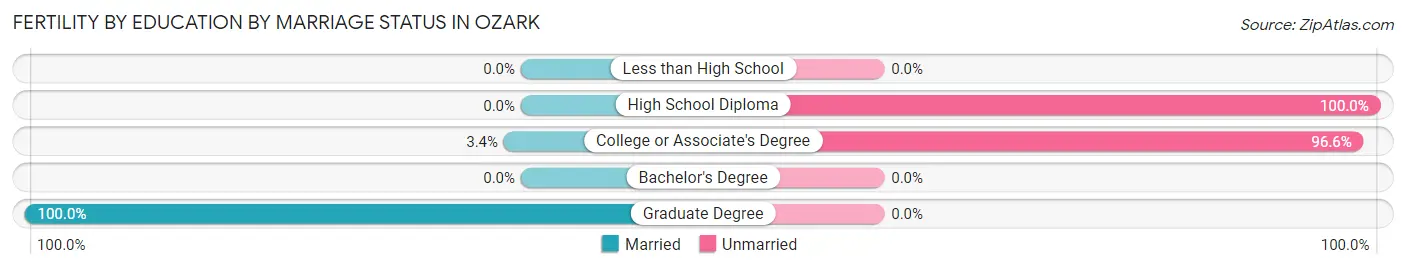
| Educational Attainment | Married | Unmarried |
| Less than High School | 0 (0.0%) | 0 (0.0%) |
| High School Diploma | 0 (0.0%) | 79 (100.0%) |
| College or Associate's Degree | 5 (3.4%) | 141 (96.6%) |
| Bachelor's Degree | 0 (0.0%) | 0 (0.0%) |
| Graduate Degree | 18 (100.0%) | 0 (0.0%) |
| Total | 23 (9.5%) | 220 (90.5%) |
Income in Ozark
Income Overview in Ozark
Per Capita Income in Ozark is $19,220, while median incomes of families and households are $49,429 and $41,816 respectively.
| Characteristic | Number | Measure |
| Per Capita Income | 3,546 | $19,220 |
| Median Family Income | 775 | $49,429 |
| Mean Family Income | 775 | $55,284 |
| Median Household Income | 1,361 | $41,816 |
| Mean Household Income | 1,361 | $47,609 |
| Income Deficit | 775 | $10,833 |
| Wage / Income Gap (%) | 3,546 | 9.58% |
| Wage / Income Gap ($) | 3,546 | 90.42¢ per $1 |
| Gini / Inequality Index | 3,546 | 0.37 |
Earnings by Sex in Ozark
Average Earnings in Ozark are $32,957, $33,101 for men and $29,930 for women, a difference of 9.6%.
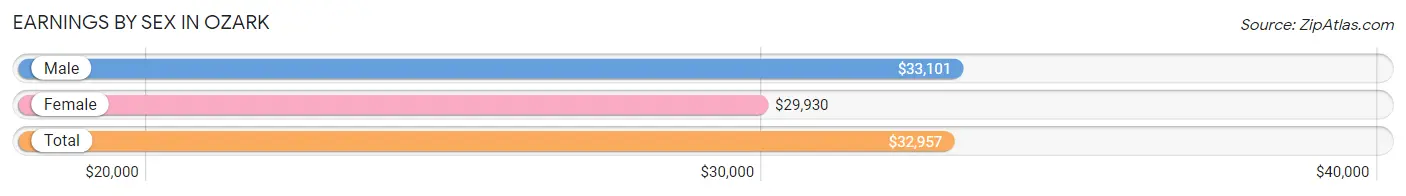
| Sex | Number | Average Earnings |
| Male | 933 (61.4%) | $33,101 |
| Female | 586 (38.6%) | $29,930 |
| Total | 1,519 (100.0%) | $32,957 |
Earnings by Sex by Income Bracket in Ozark
The most common earnings brackets in Ozark are $20,000 to $22,499 for men (154 | 16.5%) and $25,000 to $29,999 for women (143 | 24.4%).
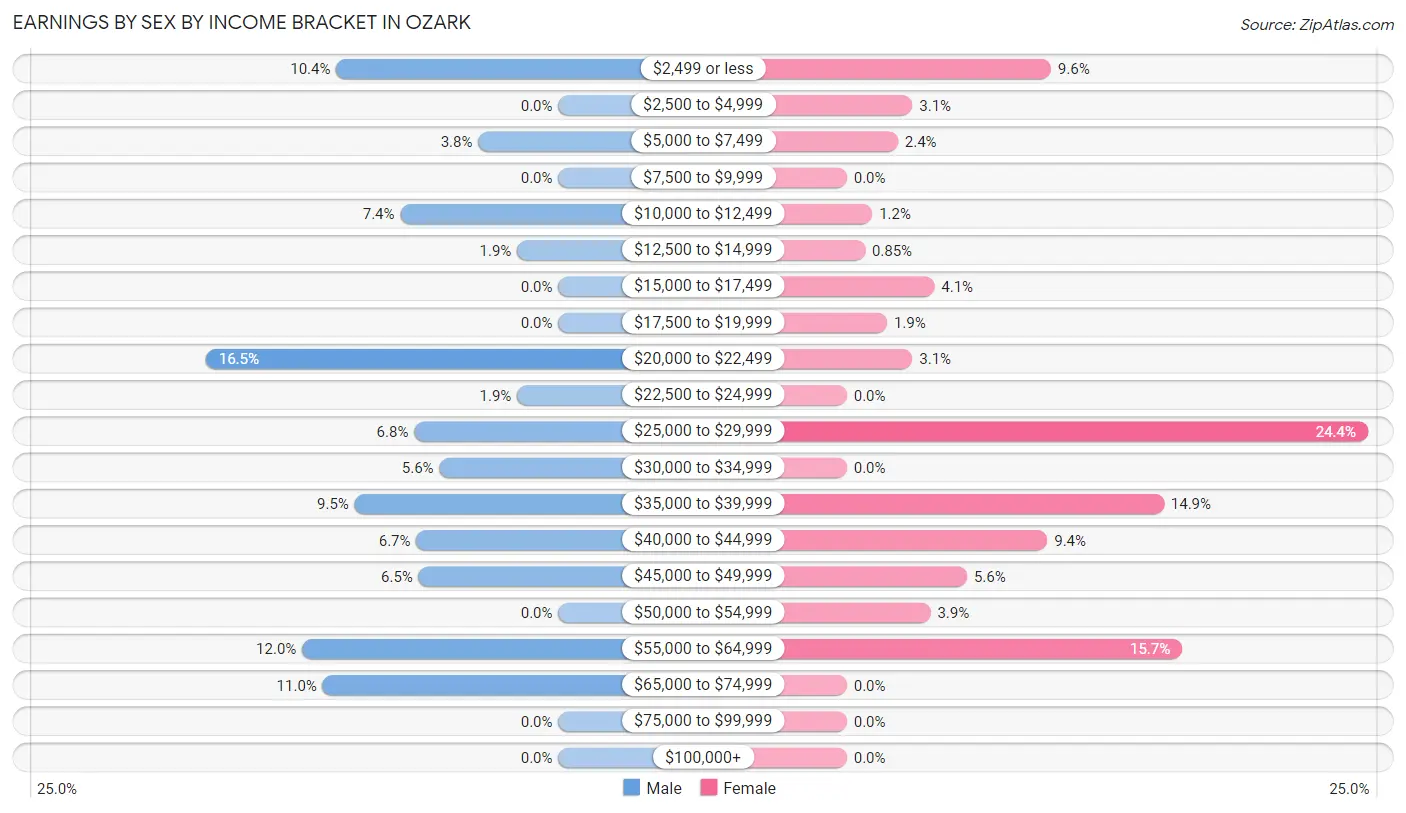
| Income | Male | Female |
| $2,499 or less | 97 (10.4%) | 56 (9.6%) |
| $2,500 to $4,999 | 0 (0.0%) | 18 (3.1%) |
| $5,000 to $7,499 | 35 (3.7%) | 14 (2.4%) |
| $7,500 to $9,999 | 0 (0.0%) | 0 (0.0%) |
| $10,000 to $12,499 | 69 (7.4%) | 7 (1.2%) |
| $12,500 to $14,999 | 18 (1.9%) | 5 (0.9%) |
| $15,000 to $17,499 | 0 (0.0%) | 24 (4.1%) |
| $17,500 to $19,999 | 0 (0.0%) | 11 (1.9%) |
| $20,000 to $22,499 | 154 (16.5%) | 18 (3.1%) |
| $22,500 to $24,999 | 18 (1.9%) | 0 (0.0%) |
| $25,000 to $29,999 | 63 (6.8%) | 143 (24.4%) |
| $30,000 to $34,999 | 52 (5.6%) | 0 (0.0%) |
| $35,000 to $39,999 | 89 (9.5%) | 87 (14.8%) |
| $40,000 to $44,999 | 62 (6.7%) | 55 (9.4%) |
| $45,000 to $49,999 | 61 (6.5%) | 33 (5.6%) |
| $50,000 to $54,999 | 0 (0.0%) | 23 (3.9%) |
| $55,000 to $64,999 | 112 (12.0%) | 92 (15.7%) |
| $65,000 to $74,999 | 103 (11.0%) | 0 (0.0%) |
| $75,000 to $99,999 | 0 (0.0%) | 0 (0.0%) |
| $100,000+ | 0 (0.0%) | 0 (0.0%) |
| Total | 933 (100.0%) | 586 (100.0%) |
Earnings by Sex by Educational Attainment in Ozark
Average earnings in Ozark are $33,053 for men and $38,448 for women, a difference of 14.0%. Men with an educational attainment of college or associate's degree enjoy the highest average annual earnings of $45,301, while those with high school diploma education earn the least with $21,737. Women with an educational attainment of high school diploma earn the most with the average annual earnings of $57,880, while those with less than high school education have the smallest earnings of $39,497.
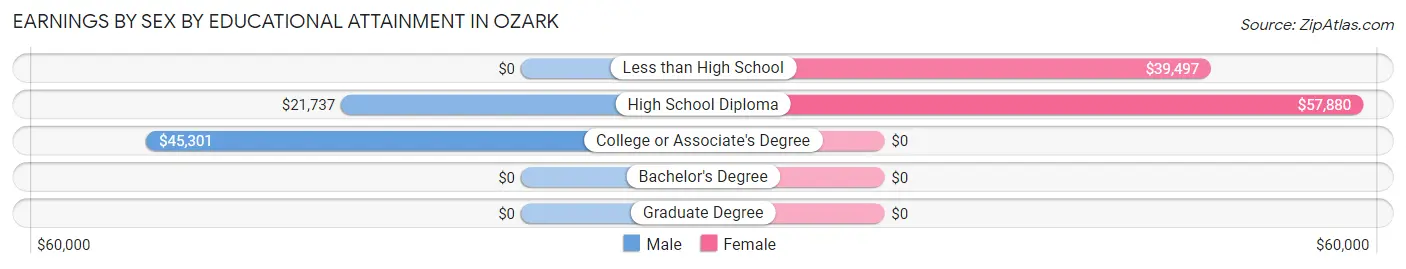
| Educational Attainment | Male Income | Female Income |
| Less than High School | - | - |
| High School Diploma | $21,737 | $57,880 |
| College or Associate's Degree | $45,301 | $0 |
| Bachelor's Degree | - | - |
| Graduate Degree | - | - |
| Total | $33,053 | $38,448 |
Family Income in Ozark
Family Income Brackets in Ozark
According to the Ozark family income data, there are 197 families falling into the $50,000 to $74,999 income range, which is the most common income bracket and makes up 25.4% of all families.
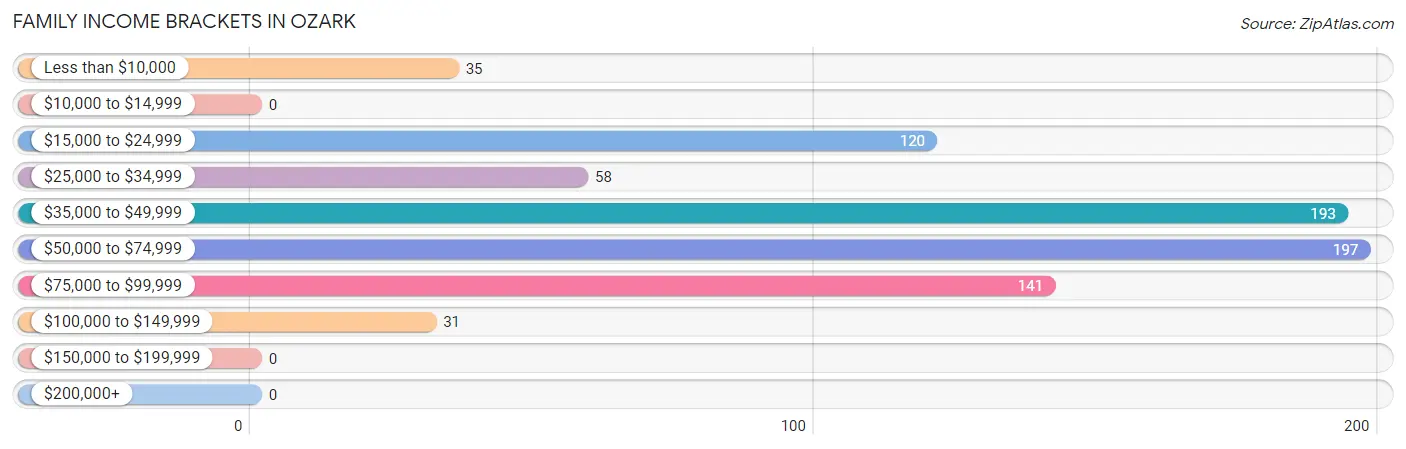
| Income Bracket | # Families | % Families |
| Less than $10,000 | 35 | 4.5% |
| $10,000 to $14,999 | 0 | 0.0% |
| $15,000 to $24,999 | 120 | 15.5% |
| $25,000 to $34,999 | 58 | 7.5% |
| $35,000 to $49,999 | 193 | 24.9% |
| $50,000 to $74,999 | 197 | 25.4% |
| $75,000 to $99,999 | 141 | 18.2% |
| $100,000 to $149,999 | 31 | 4.0% |
| $150,000 to $199,999 | 0 | 0.0% |
| $200,000+ | 0 | 0.0% |
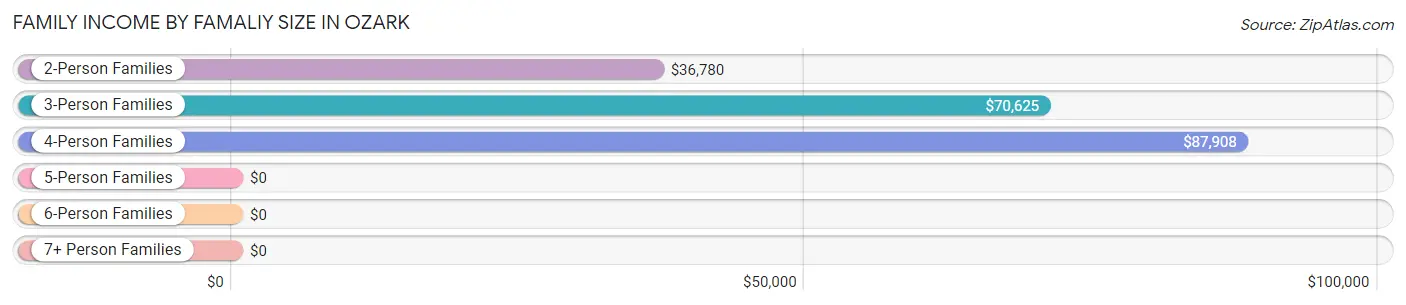
Family Income by Famaliy Size in Ozark
4-person families (154 | 19.9%) account for the highest median family income in Ozark with $87,908 per family, while 3-person families (280 | 36.1%) have the highest median income of $23,542 per family member.
| Income Bracket | # Families | Median Income |
| 2-Person Families | 290 (37.4%) | $36,780 |
| 3-Person Families | 280 (36.1%) | $70,625 |
| 4-Person Families | 154 (19.9%) | $87,908 |
| 5-Person Families | 51 (6.6%) | $0 |
| 6-Person Families | 0 (0.0%) | $0 |
| 7+ Person Families | 0 (0.0%) | $0 |
| Total | 775 (100.0%) | $49,429 |
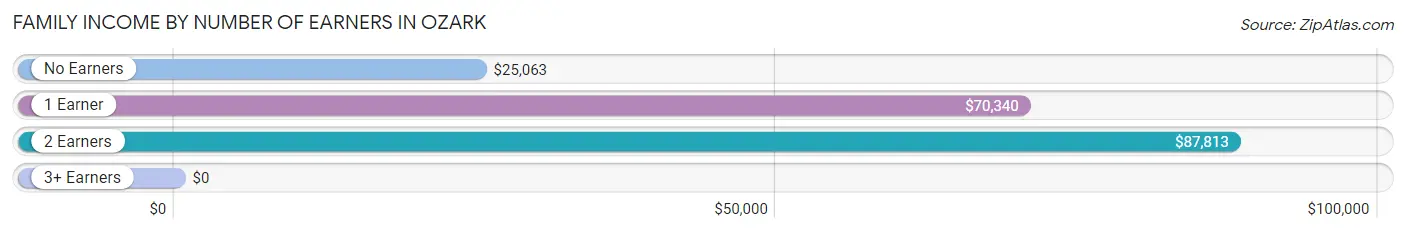
Family Income by Number of Earners in Ozark
| Number of Earners | # Families | Median Income |
| No Earners | 195 (25.2%) | $25,063 |
| 1 Earner | 353 (45.6%) | $70,340 |
| 2 Earners | 227 (29.3%) | $87,813 |
| 3+ Earners | 0 (0.0%) | $0 |
| Total | 775 (100.0%) | $49,429 |
Household Income in Ozark
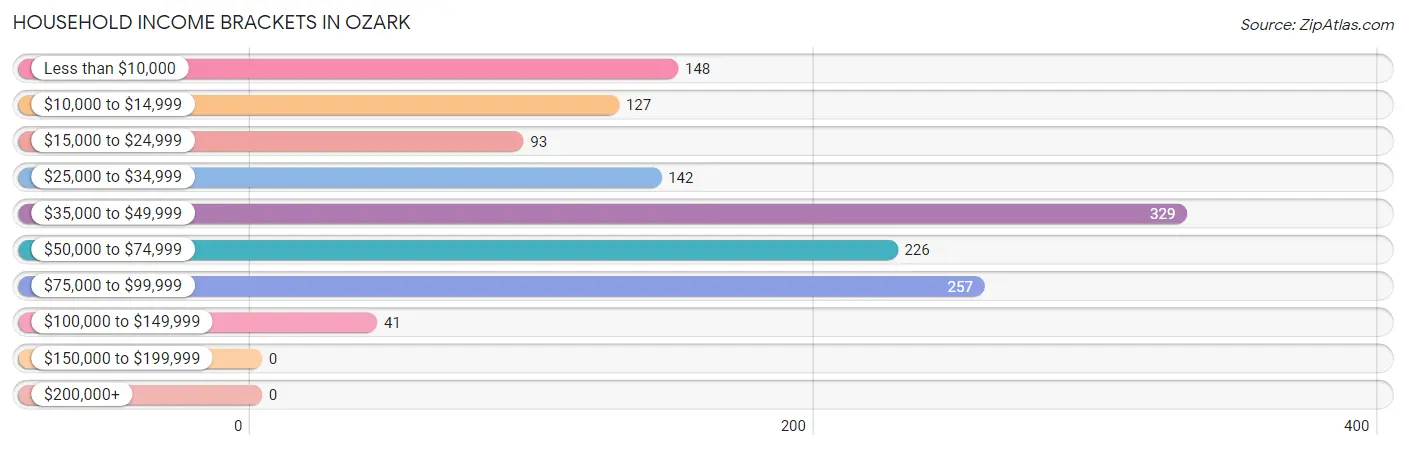
Household Income Brackets in Ozark
With 329 households falling in the category, the $35,000 to $49,999 income range is the most frequent in Ozark, accounting for 24.2% of all households.
| Income Bracket | # Households | % Households |
| Less than $10,000 | 148 | 10.9% |
| $10,000 to $14,999 | 127 | 9.3% |
| $15,000 to $24,999 | 93 | 6.8% |
| $25,000 to $34,999 | 142 | 10.4% |
| $35,000 to $49,999 | 329 | 24.2% |
| $50,000 to $74,999 | 226 | 16.6% |
| $75,000 to $99,999 | 257 | 18.9% |
| $100,000 to $149,999 | 41 | 3.0% |
| $150,000 to $199,999 | 0 | 0.0% |
| $200,000+ | 0 | 0.0% |
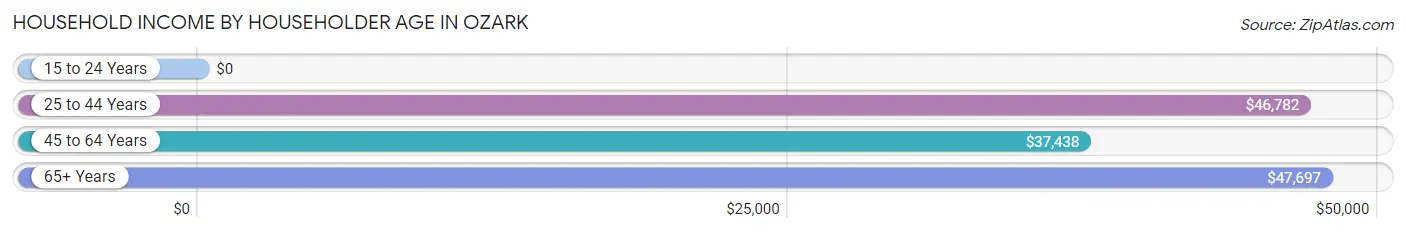
Household Income by Householder Age in Ozark
The median household income in Ozark is $41,816, with the highest median household income of $47,697 found in the 65+ years age bracket for the primary householder. A total of 402 households (29.5%) fall into this category. Meanwhile, the 15 to 24 years age bracket for the primary householder has the lowest median household income of $0, with 113 households (8.3%) in this group.
| Income Bracket | # Households | Median Income |
| 15 to 24 Years | 113 (8.3%) | $0 |
| 25 to 44 Years | 421 (30.9%) | $46,782 |
| 45 to 64 Years | 425 (31.2%) | $37,438 |
| 65+ Years | 402 (29.5%) | $47,697 |
| Total | 1,361 (100.0%) | $41,816 |
Poverty in Ozark
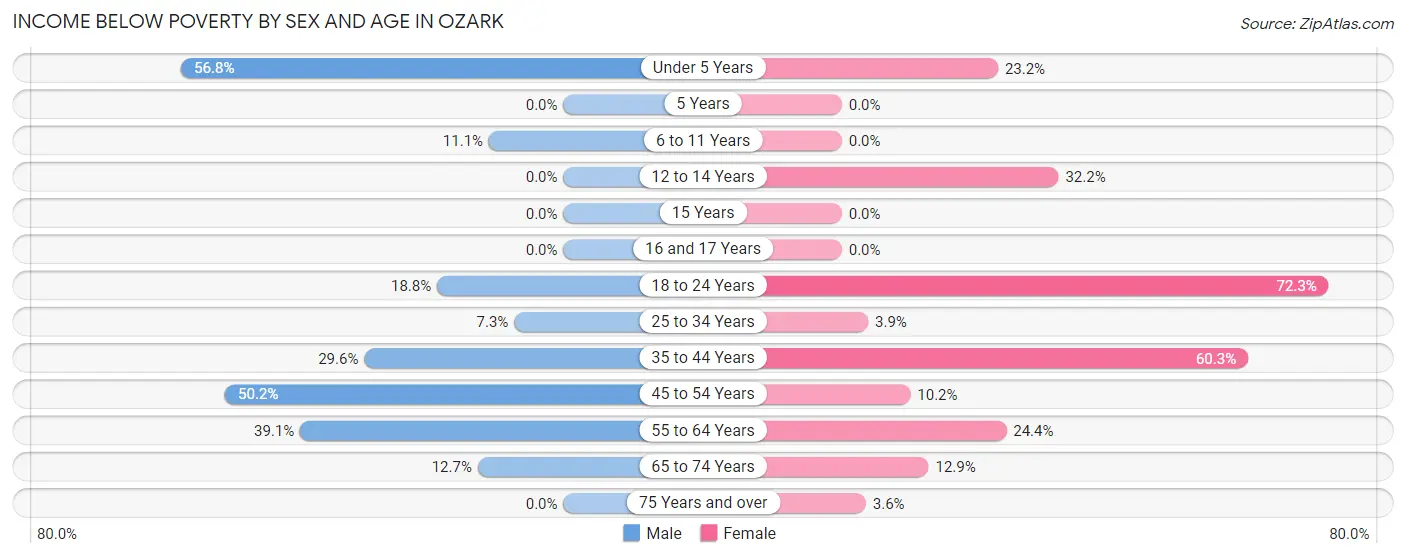
Income Below Poverty by Sex and Age in Ozark
With 23.6% poverty level for males and 20.0% for females among the residents of Ozark, under 5 year old males and 18 to 24 year old females are the most vulnerable to poverty, with 42 males (56.8%) and 120 females (72.3%) in their respective age groups living below the poverty level.
| Age Bracket | Male | Female |
| Under 5 Years | 42 (56.8%) | 48 (23.2%) |
| 5 Years | 0 (0.0%) | 0 (0.0%) |
| 6 to 11 Years | 21 (11.1%) | 0 (0.0%) |
| 12 to 14 Years | 0 (0.0%) | 28 (32.2%) |
| 15 Years | 0 (0.0%) | 0 (0.0%) |
| 16 and 17 Years | 0 (0.0%) | 0 (0.0%) |
| 18 to 24 Years | 21 (18.8%) | 120 (72.3%) |
| 25 to 34 Years | 27 (7.3%) | 18 (3.9%) |
| 35 to 44 Years | 55 (29.6%) | 79 (60.3%) |
| 45 to 54 Years | 112 (50.2%) | 29 (10.2%) |
| 55 to 64 Years | 68 (39.1%) | 21 (24.4%) |
| 65 to 74 Years | 15 (12.7%) | 30 (12.9%) |
| 75 Years and over | 0 (0.0%) | 4 (3.6%) |
| Total | 361 (23.6%) | 377 (20.0%) |
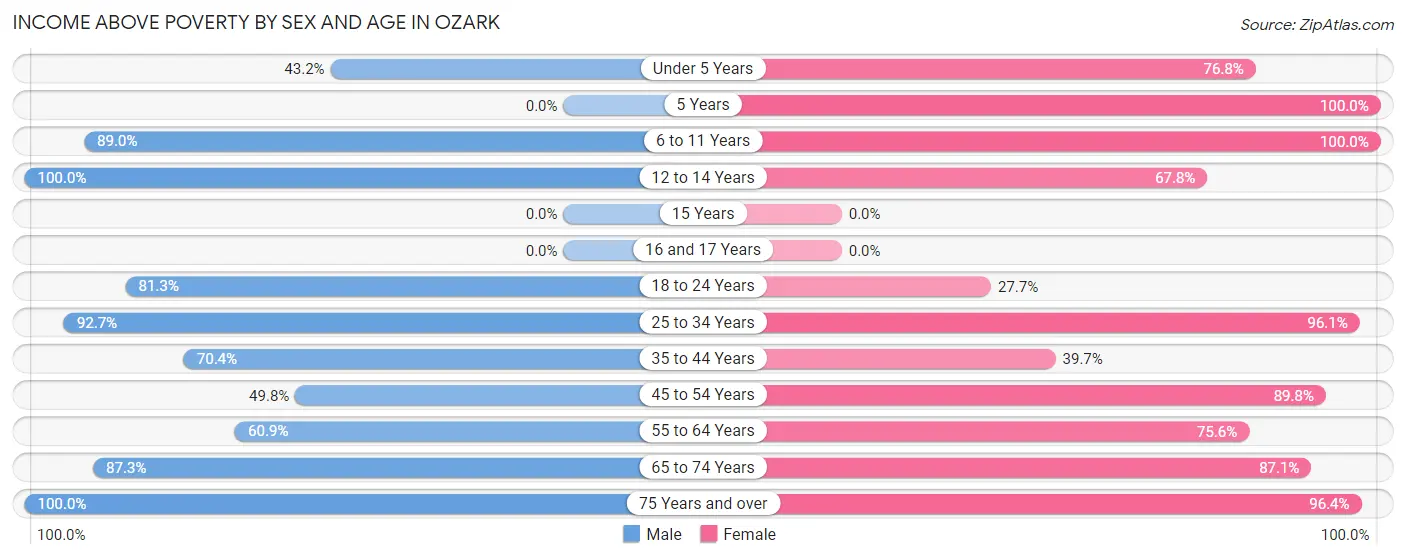
Income Above Poverty by Sex and Age in Ozark
According to the poverty statistics in Ozark, males aged 12 to 14 years and females aged 5 years are the age groups that are most secure financially, with 100.0% of males and 100.0% of females in these age groups living above the poverty line.
| Age Bracket | Male | Female |
| Under 5 Years | 32 (43.2%) | 159 (76.8%) |
| 5 Years | 0 (0.0%) | 103 (100.0%) |
| 6 to 11 Years | 169 (88.9%) | 18 (100.0%) |
| 12 to 14 Years | 38 (100.0%) | 59 (67.8%) |
| 15 Years | 0 (0.0%) | 0 (0.0%) |
| 16 and 17 Years | 0 (0.0%) | 0 (0.0%) |
| 18 to 24 Years | 91 (81.2%) | 46 (27.7%) |
| 25 to 34 Years | 343 (92.7%) | 442 (96.1%) |
| 35 to 44 Years | 131 (70.4%) | 52 (39.7%) |
| 45 to 54 Years | 111 (49.8%) | 256 (89.8%) |
| 55 to 64 Years | 106 (60.9%) | 65 (75.6%) |
| 65 to 74 Years | 103 (87.3%) | 203 (87.1%) |
| 75 Years and over | 45 (100.0%) | 108 (96.4%) |
| Total | 1,169 (76.4%) | 1,511 (80.0%) |
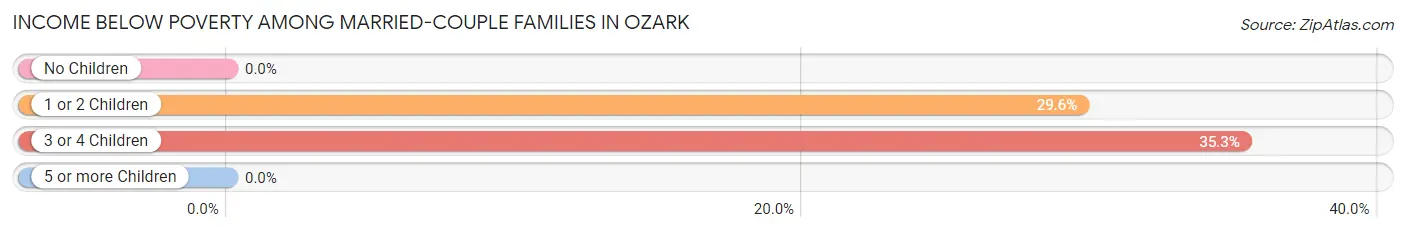
Income Below Poverty Among Married-Couple Families in Ozark
The poverty statistics for married-couple families in Ozark show that 17.6% or 90 of the total 510 families live below the poverty line. Families with 3 or 4 children have the highest poverty rate of 35.3%, comprising of 18 families. On the other hand, families with no children have the lowest poverty rate of 0.0%, which includes 0 families.
| Children | Above Poverty | Below Poverty |
| No Children | 216 (100.0%) | 0 (0.0%) |
| 1 or 2 Children | 171 (70.4%) | 72 (29.6%) |
| 3 or 4 Children | 33 (64.7%) | 18 (35.3%) |
| 5 or more Children | 0 (0.0%) | 0 (0.0%) |
| Total | 420 (82.4%) | 90 (17.6%) |
Income Below Poverty Among Single-Parent Households in Ozark
| Children | Single Father | Single Mother |
| No Children | 0 (0.0%) | 0 (0.0%) |
| 1 or 2 Children | 0 (0.0%) | 0 (0.0%) |
| 3 or 4 Children | 0 (0.0%) | 0 (0.0%) |
| 5 or more Children | 0 (0.0%) | 0 (0.0%) |
| Total | 0 (0.0%) | 0 (0.0%) |
Income Below Poverty Among Married-Couple vs Single-Parent Households in Ozark
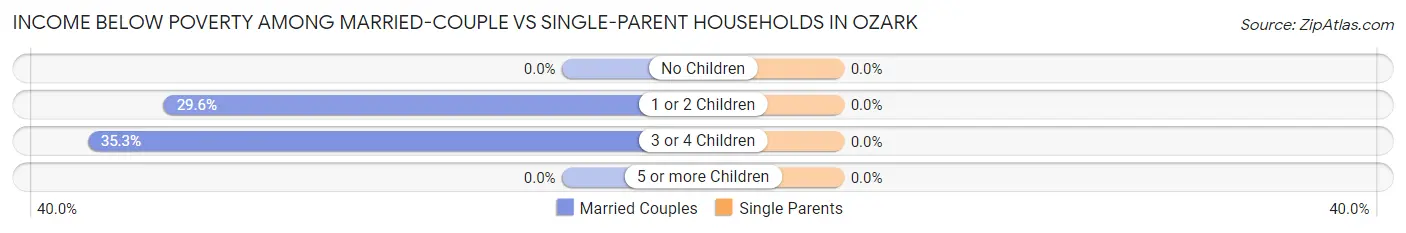
| Children | Married-Couple Families | Single-Parent Households |
| No Children | 0 (0.0%) | 0 (0.0%) |
| 1 or 2 Children | 72 (29.6%) | 0 (0.0%) |
| 3 or 4 Children | 18 (35.3%) | 0 (0.0%) |
| 5 or more Children | 0 (0.0%) | 0 (0.0%) |
| Total | 90 (17.6%) | 0 (0.0%) |
Employment Characteristics in Ozark
Employment by Class of Employer in Ozark
Among the 1,217 employed individuals in Ozark, private company employees (729 | 59.9%), state government employees (157 | 12.9%), and local government employees (97 | 8.0%) make up the most common classes of employment.
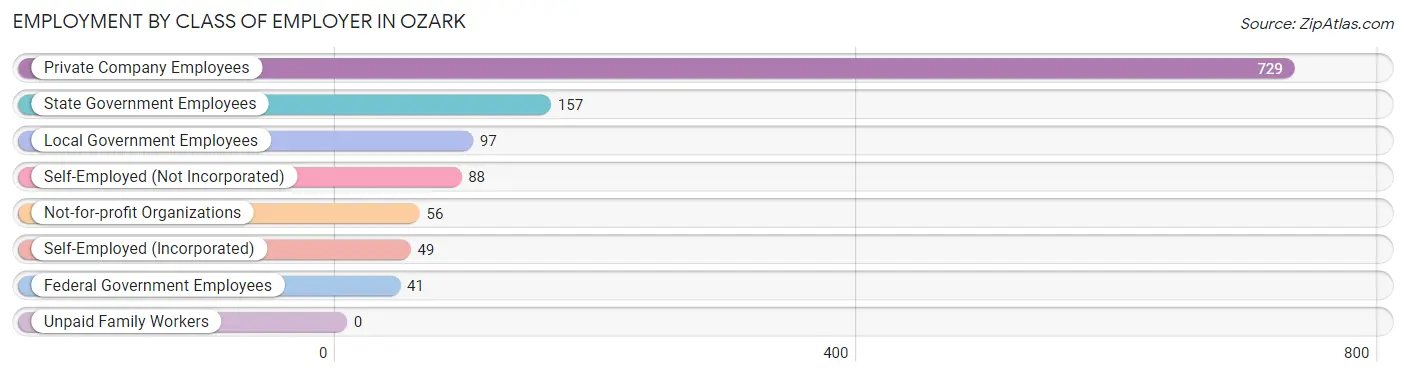
| Employer Class | # Employees | % Employees |
| Private Company Employees | 729 | 59.9% |
| Self-Employed (Incorporated) | 49 | 4.0% |
| Self-Employed (Not Incorporated) | 88 | 7.2% |
| Not-for-profit Organizations | 56 | 4.6% |
| Local Government Employees | 97 | 8.0% |
| State Government Employees | 157 | 12.9% |
| Federal Government Employees | 41 | 3.4% |
| Unpaid Family Workers | 0 | 0.0% |
| Total | 1,217 | 100.0% |
Employment Status by Age in Ozark
According to the labor force statistics for Ozark, out of the total population over 16 years of age (2,829), 49.1% or 1,389 individuals are in the labor force, with 11.7% or 163 of them unemployed. The age group with the highest labor force participation rate is 25 to 29 years, with 85.6% or 447 individuals in the labor force. Within the labor force, the 16 to 19 years age range has the highest percentage of unemployed individuals, with 66.7% or 22 of them being unemployed.
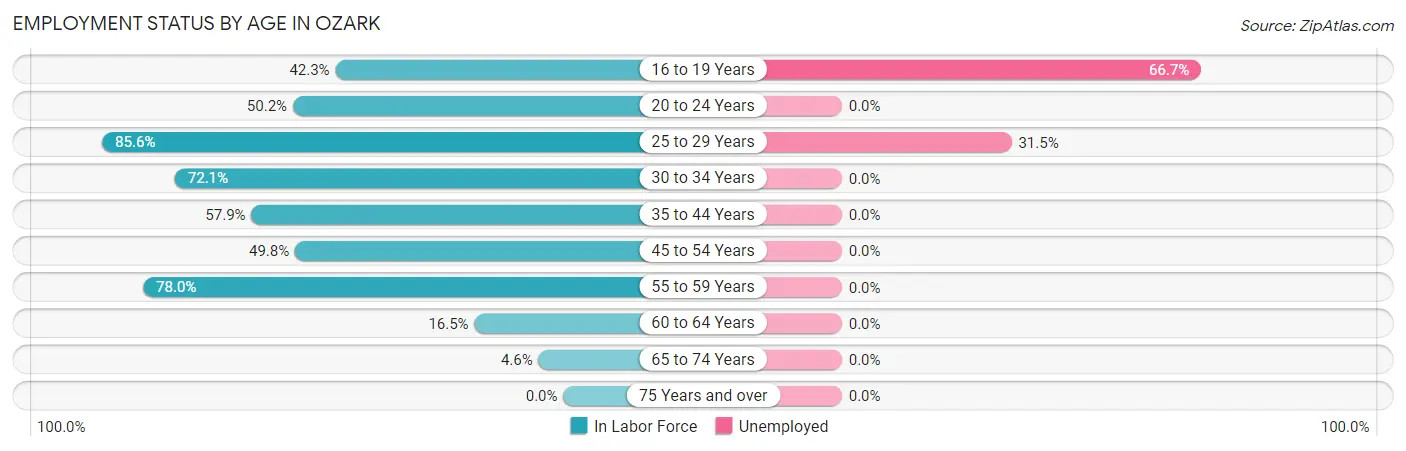
| Age Bracket | In Labor Force | Unemployed |
| 16 to 19 Years | 33 (42.3%) | 22 (66.7%) |
| 20 to 24 Years | 106 (50.2%) | 0 (0.0%) |
| 25 to 29 Years | 447 (85.6%) | 141 (31.5%) |
| 30 to 34 Years | 222 (72.1%) | 0 (0.0%) |
| 35 to 44 Years | 190 (57.9%) | 0 (0.0%) |
| 45 to 54 Years | 253 (49.8%) | 0 (0.0%) |
| 55 to 59 Years | 99 (78.0%) | 0 (0.0%) |
| 60 to 64 Years | 22 (16.5%) | 0 (0.0%) |
| 65 to 74 Years | 18 (4.6%) | 0 (0.0%) |
| 75 Years and over | 0 (0.0%) | 0 (0.0%) |
| Total | 1,389 (49.1%) | 163 (11.7%) |
Employment Status by Educational Attainment in Ozark
According to labor force statistics for Ozark, 64.0% of individuals (1,233) out of the total population between 25 and 64 years of age (1,926) are in the labor force, with 11.4% or 141 of them being unemployed. The group with the highest labor force participation rate are those with the educational attainment of bachelor's degree or higher, with 70.3% or 121 individuals in the labor force. Within the labor force, individuals with college / associate degree education have the highest percentage of unemployment, with 28.3% or 141 of them being unemployed.
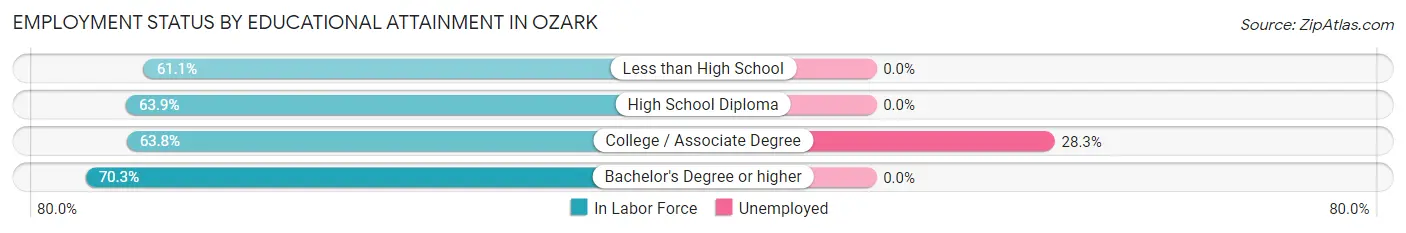
| Educational Attainment | In Labor Force | Unemployed |
| Less than High School | 160 (61.1%) | 0 (0.0%) |
| High School Diploma | 454 (63.9%) | 0 (0.0%) |
| College / Associate Degree | 498 (63.8%) | 221 (28.3%) |
| Bachelor's Degree or higher | 121 (70.3%) | 0 (0.0%) |
| Total | 1,233 (64.0%) | 220 (11.4%) |
Employment Occupations by Sex in Ozark
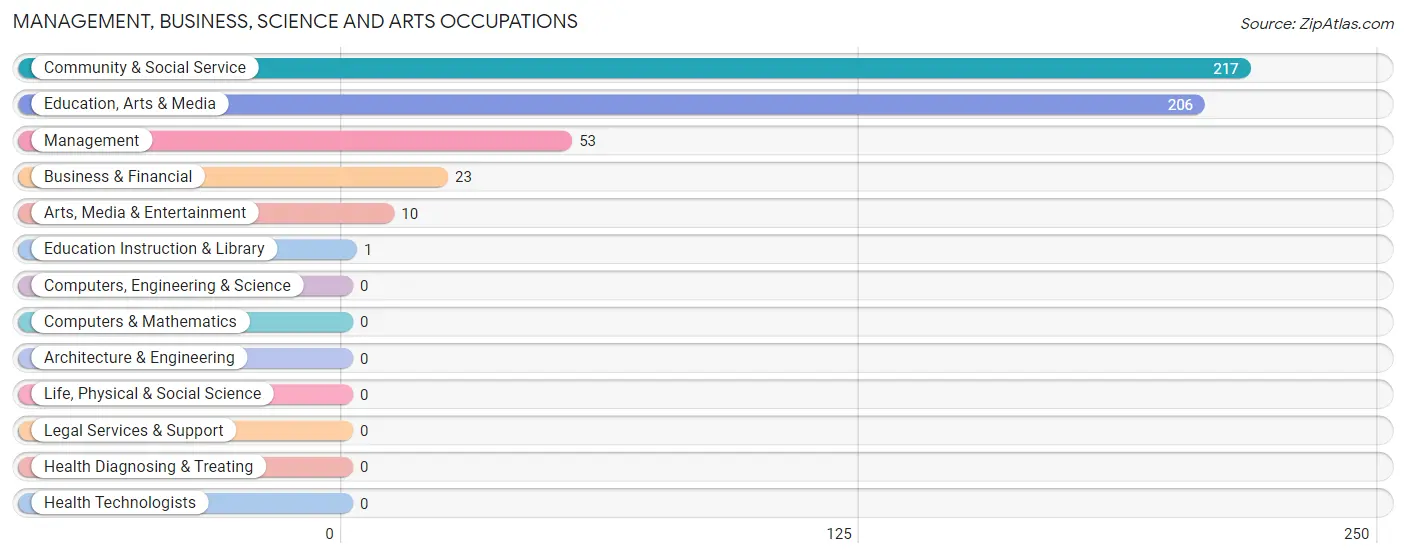
Management, Business, Science and Arts Occupations
The most common Management, Business, Science and Arts occupations in Ozark are Community & Social Service (217 | 17.7%), Education, Arts & Media (206 | 16.8%), Management (53 | 4.3%), Business & Financial (23 | 1.9%), and Arts, Media & Entertainment (10 | 0.8%).
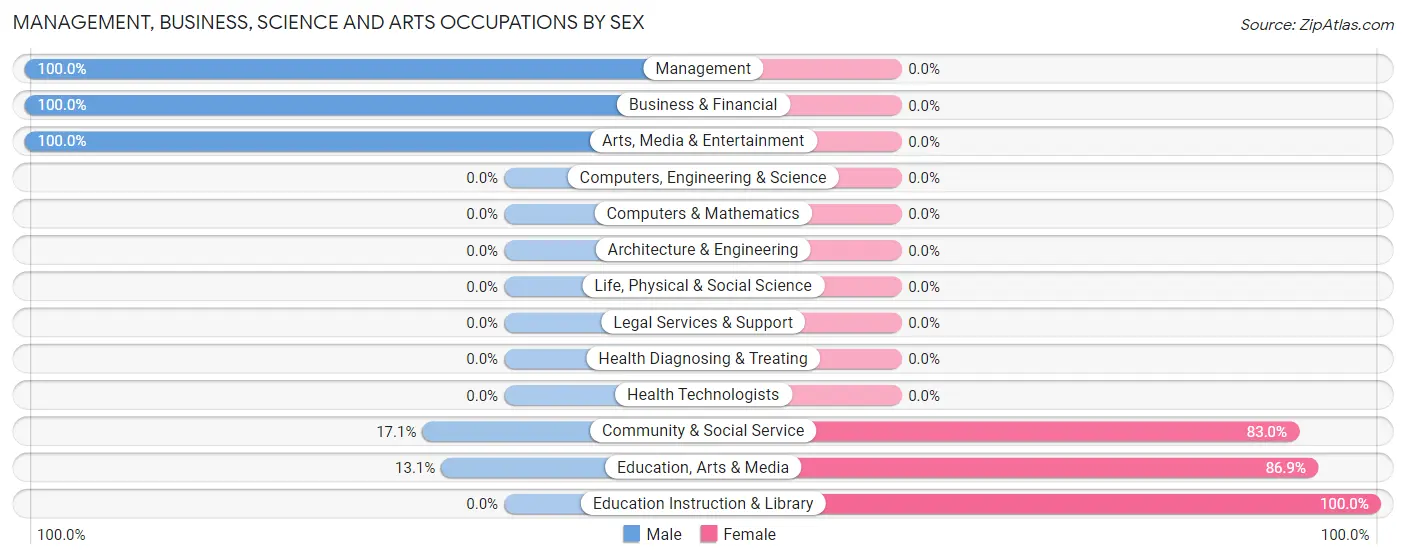
Management, Business, Science and Arts Occupations by Sex
Within the Management, Business, Science and Arts occupations in Ozark, the most male-oriented occupations are Management (100.0%), Business & Financial (100.0%), and Arts, Media & Entertainment (100.0%), while the most female-oriented occupations are Education Instruction & Library (100.0%), Education, Arts & Media (86.9%), and Community & Social Service (83.0%).
| Occupation | Male | Female |
| Management | 53 (100.0%) | 0 (0.0%) |
| Business & Financial | 23 (100.0%) | 0 (0.0%) |
| Computers, Engineering & Science | 0 (0.0%) | 0 (0.0%) |
| Computers & Mathematics | 0 (0.0%) | 0 (0.0%) |
| Architecture & Engineering | 0 (0.0%) | 0 (0.0%) |
| Life, Physical & Social Science | 0 (0.0%) | 0 (0.0%) |
| Community & Social Service | 37 (17.1%) | 180 (83.0%) |
| Education, Arts & Media | 27 (13.1%) | 179 (86.9%) |
| Legal Services & Support | 0 (0.0%) | 0 (0.0%) |
| Education Instruction & Library | 0 (0.0%) | 1 (100.0%) |
| Arts, Media & Entertainment | 10 (100.0%) | 0 (0.0%) |
| Health Diagnosing & Treating | 0 (0.0%) | 0 (0.0%) |
| Health Technologists | 0 (0.0%) | 0 (0.0%) |
| Total (Category) | 113 (38.6%) | 180 (61.4%) |
| Total (Overall) | 836 (68.1%) | 391 (31.9%) |
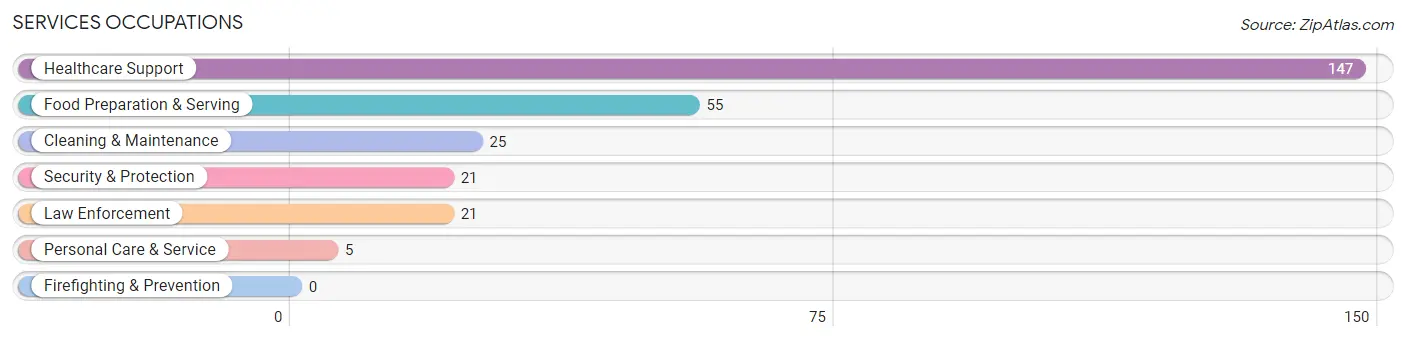
Services Occupations
The most common Services occupations in Ozark are Healthcare Support (147 | 12.0%), Food Preparation & Serving (55 | 4.5%), Cleaning & Maintenance (25 | 2.0%), Security & Protection (21 | 1.7%), and Law Enforcement (21 | 1.7%).
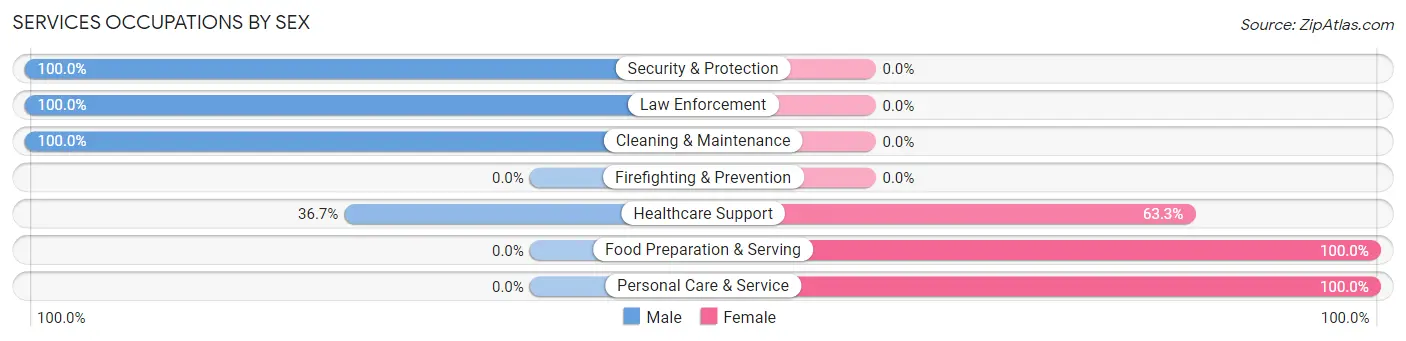
Services Occupations by Sex
Within the Services occupations in Ozark, the most male-oriented occupations are Security & Protection (100.0%), Law Enforcement (100.0%), and Cleaning & Maintenance (100.0%), while the most female-oriented occupations are Food Preparation & Serving (100.0%), Personal Care & Service (100.0%), and Healthcare Support (63.3%).
| Occupation | Male | Female |
| Healthcare Support | 54 (36.7%) | 93 (63.3%) |
| Security & Protection | 21 (100.0%) | 0 (0.0%) |
| Firefighting & Prevention | 0 (0.0%) | 0 (0.0%) |
| Law Enforcement | 21 (100.0%) | 0 (0.0%) |
| Food Preparation & Serving | 0 (0.0%) | 55 (100.0%) |
| Cleaning & Maintenance | 25 (100.0%) | 0 (0.0%) |
| Personal Care & Service | 0 (0.0%) | 5 (100.0%) |
| Total (Category) | 100 (39.5%) | 153 (60.5%) |
| Total (Overall) | 836 (68.1%) | 391 (31.9%) |
Sales and Office Occupations
The most common Sales and Office occupations in Ozark are Sales & Related (132 | 10.8%), and Office & Administration (95 | 7.7%).
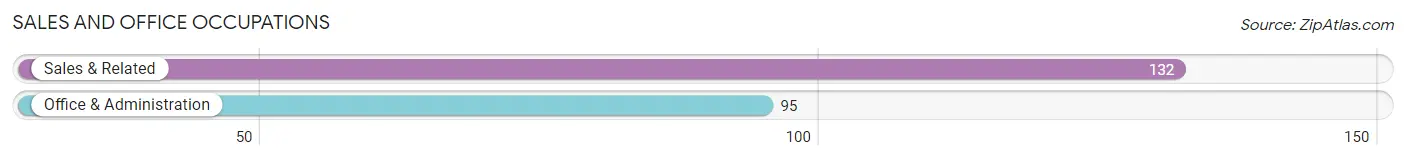
Sales and Office Occupations by Sex

| Occupation | Male | Female |
| Sales & Related | 131 (99.2%) | 1 (0.8%) |
| Office & Administration | 51 (53.7%) | 44 (46.3%) |
| Total (Category) | 182 (80.2%) | 45 (19.8%) |
| Total (Overall) | 836 (68.1%) | 391 (31.9%) |
Natural Resources, Construction and Maintenance Occupations
The most common Natural Resources, Construction and Maintenance occupations in Ozark are , and Installation, Maintenance & Repair (146 | 11.9%).
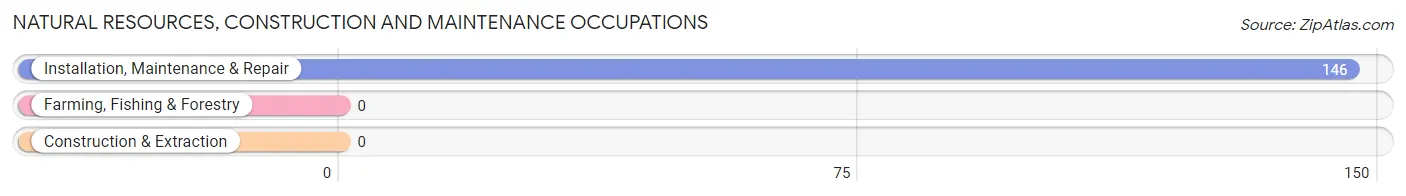
Natural Resources, Construction and Maintenance Occupations by Sex

| Occupation | Male | Female |
| Farming, Fishing & Forestry | 0 (0.0%) | 0 (0.0%) |
| Construction & Extraction | 0 (0.0%) | 0 (0.0%) |
| Installation, Maintenance & Repair | 146 (100.0%) | 0 (0.0%) |
| Total (Category) | 146 (100.0%) | 0 (0.0%) |
| Total (Overall) | 836 (68.1%) | 391 (31.9%) |
Production, Transportation and Moving Occupations
The most common Production, Transportation and Moving occupations in Ozark are Production (259 | 21.1%), Transportation (25 | 2.0%), and Material Moving (24 | 2.0%).
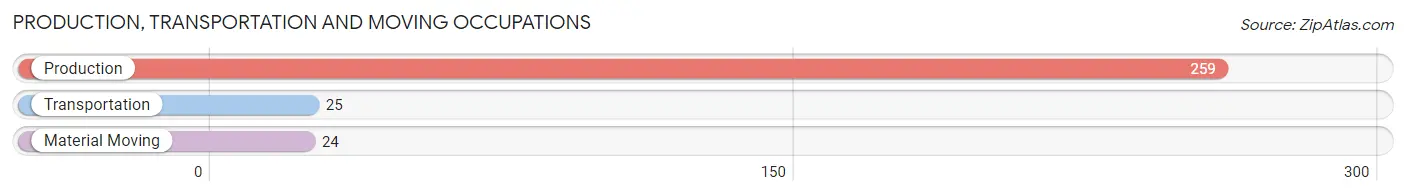
Production, Transportation and Moving Occupations by Sex
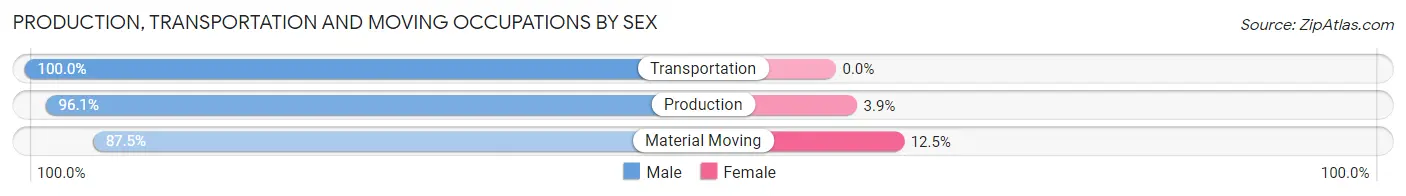
| Occupation | Male | Female |
| Production | 249 (96.1%) | 10 (3.9%) |
| Transportation | 25 (100.0%) | 0 (0.0%) |
| Material Moving | 21 (87.5%) | 3 (12.5%) |
| Total (Category) | 295 (95.8%) | 13 (4.2%) |
| Total (Overall) | 836 (68.1%) | 391 (31.9%) |
Employment Industries by Sex in Ozark
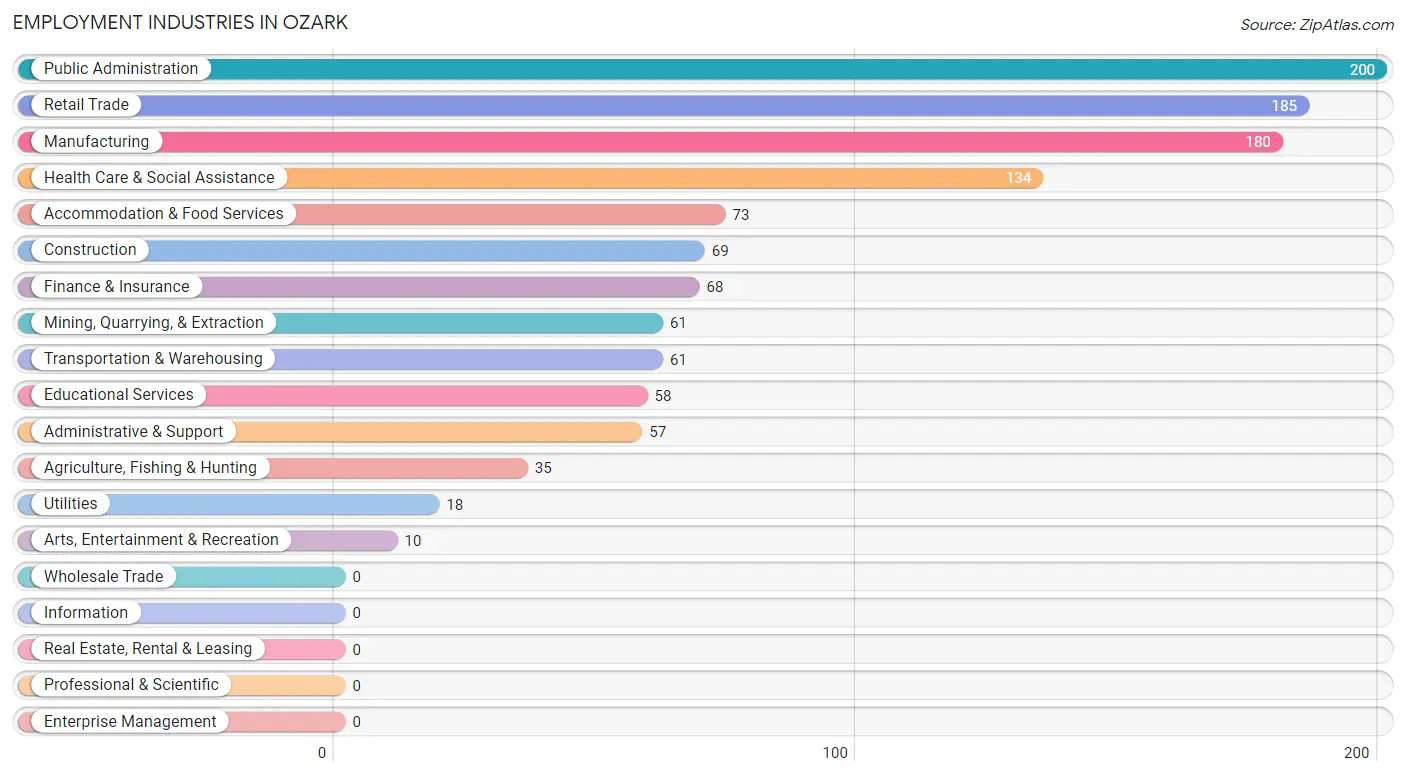
Employment Industries in Ozark
The major employment industries in Ozark include Public Administration (200 | 16.3%), Retail Trade (185 | 15.1%), Manufacturing (180 | 14.7%), Health Care & Social Assistance (134 | 10.9%), and Accommodation & Food Services (73 | 5.9%).
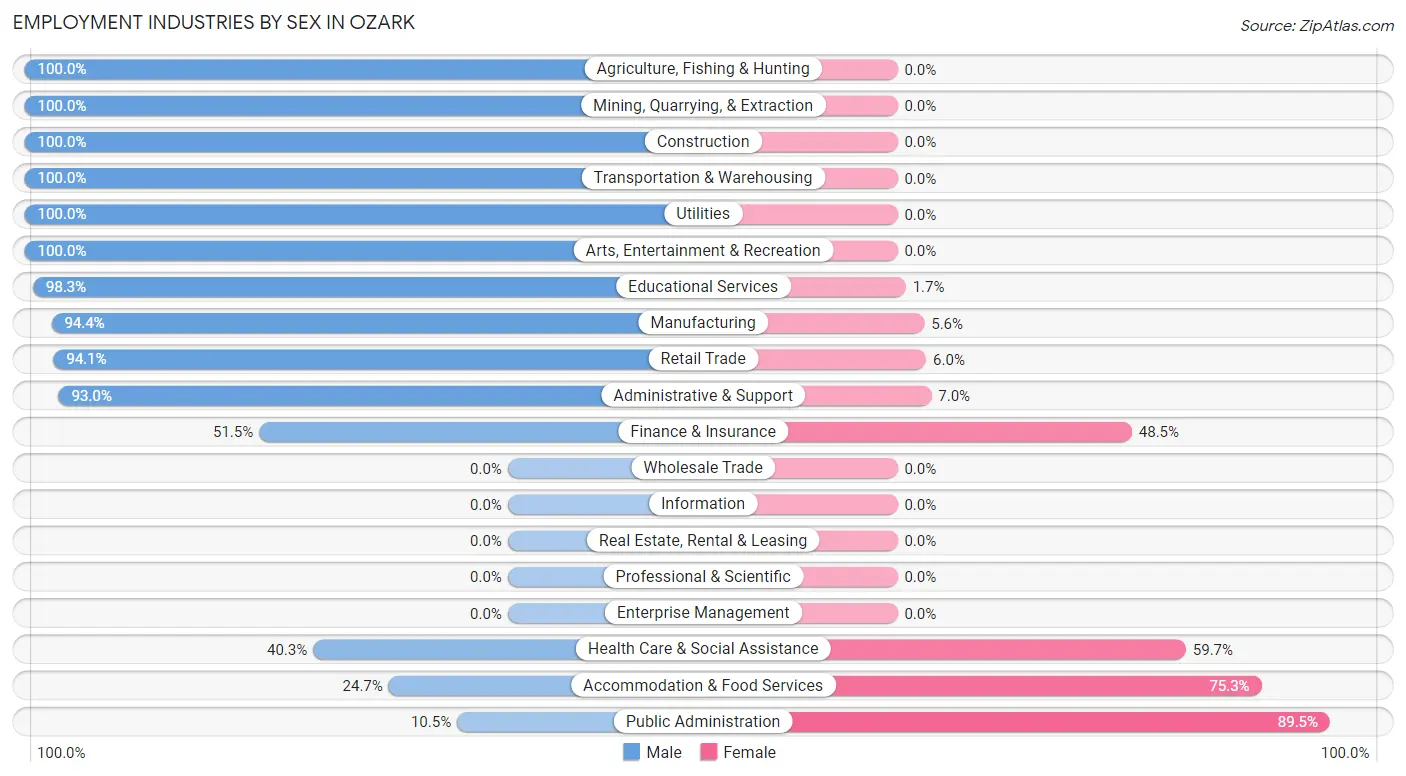
Employment Industries by Sex in Ozark
The Ozark industries that see more men than women are Agriculture, Fishing & Hunting (100.0%), Mining, Quarrying, & Extraction (100.0%), and Construction (100.0%), whereas the industries that tend to have a higher number of women are Public Administration (89.5%), Accommodation & Food Services (75.3%), and Health Care & Social Assistance (59.7%).
| Industry | Male | Female |
| Agriculture, Fishing & Hunting | 35 (100.0%) | 0 (0.0%) |
| Mining, Quarrying, & Extraction | 61 (100.0%) | 0 (0.0%) |
| Construction | 69 (100.0%) | 0 (0.0%) |
| Manufacturing | 170 (94.4%) | 10 (5.6%) |
| Wholesale Trade | 0 (0.0%) | 0 (0.0%) |
| Retail Trade | 174 (94.1%) | 11 (5.9%) |
| Transportation & Warehousing | 61 (100.0%) | 0 (0.0%) |
| Utilities | 18 (100.0%) | 0 (0.0%) |
| Information | 0 (0.0%) | 0 (0.0%) |
| Finance & Insurance | 35 (51.5%) | 33 (48.5%) |
| Real Estate, Rental & Leasing | 0 (0.0%) | 0 (0.0%) |
| Professional & Scientific | 0 (0.0%) | 0 (0.0%) |
| Enterprise Management | 0 (0.0%) | 0 (0.0%) |
| Administrative & Support | 53 (93.0%) | 4 (7.0%) |
| Educational Services | 57 (98.3%) | 1 (1.7%) |
| Health Care & Social Assistance | 54 (40.3%) | 80 (59.7%) |
| Arts, Entertainment & Recreation | 10 (100.0%) | 0 (0.0%) |
| Accommodation & Food Services | 18 (24.7%) | 55 (75.3%) |
| Public Administration | 21 (10.5%) | 179 (89.5%) |
| Total | 836 (68.1%) | 391 (31.9%) |
Education in Ozark
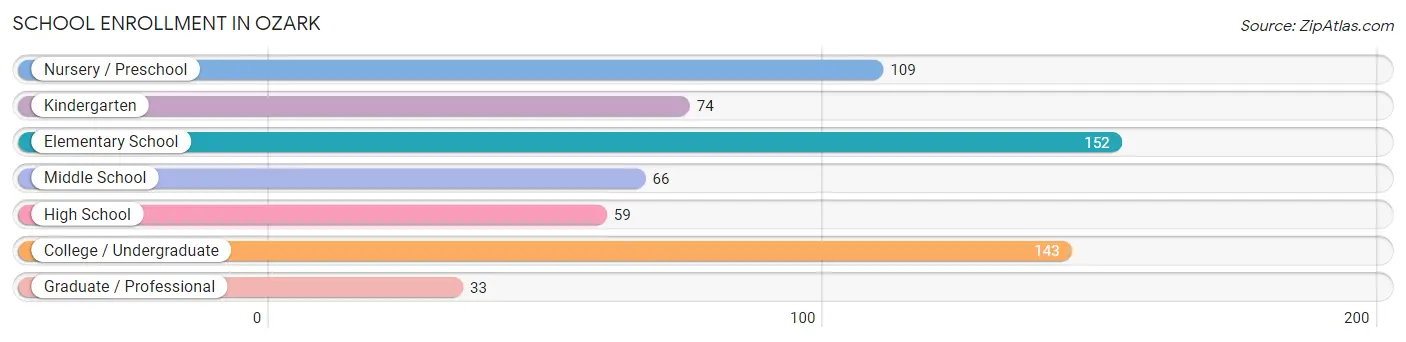
School Enrollment in Ozark
The most common levels of schooling among the 636 students in Ozark are elementary school (152 | 23.9%), college / undergraduate (143 | 22.5%), and nursery / preschool (109 | 17.1%).
| School Level | # Students | % Students |
| Nursery / Preschool | 109 | 17.1% |
| Kindergarten | 74 | 11.6% |
| Elementary School | 152 | 23.9% |
| Middle School | 66 | 10.4% |
| High School | 59 | 9.3% |
| College / Undergraduate | 143 | 22.5% |
| Graduate / Professional | 33 | 5.2% |
| Total | 636 | 100.0% |
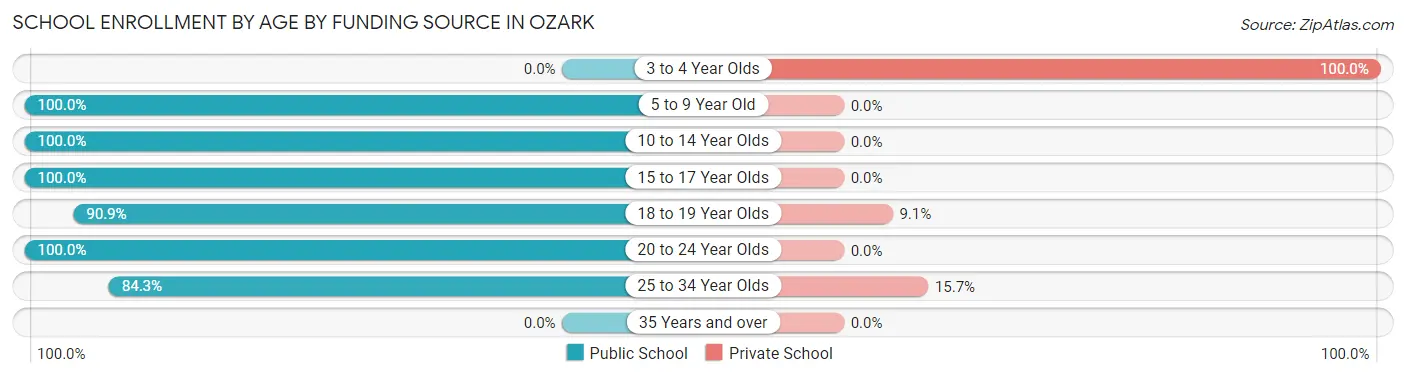
School Enrollment by Age by Funding Source in Ozark
Out of a total of 636 students who are enrolled in schools in Ozark, 44 (6.9%) attend a private institution, while the remaining 592 (93.1%) are enrolled in public schools. The age group of 3 to 4 year olds has the highest likelihood of being enrolled in private schools, with 24 (100.0% in the age bracket) enrolled. Conversely, the age group of 5 to 9 year old has the lowest likelihood of being enrolled in a private school, with 180 (100.0% in the age bracket) attending a public institution.
| Age Bracket | Public School | Private School |
| 3 to 4 Year Olds | 0 (0.0%) | 24 (100.0%) |
| 5 to 9 Year Old | 180 (100.0%) | 0 (0.0%) |
| 10 to 14 Year Olds | 256 (100.0%) | 0 (0.0%) |
| 15 to 17 Year Olds | 2 (100.0%) | 0 (0.0%) |
| 18 to 19 Year Olds | 10 (90.9%) | 1 (9.1%) |
| 20 to 24 Year Olds | 42 (100.0%) | 0 (0.0%) |
| 25 to 34 Year Olds | 102 (84.3%) | 19 (15.7%) |
| 35 Years and over | 0 (0.0%) | 0 (0.0%) |
| Total | 592 (93.1%) | 44 (6.9%) |
Educational Attainment by Field of Study in Ozark
Education (86 | 36.1%), business (33 | 13.9%), liberal arts & history (33 | 13.9%), communications (23 | 9.7%), and engineering (21 | 8.8%) are the most common fields of study among 238 individuals in Ozark who have obtained a bachelor's degree or higher.
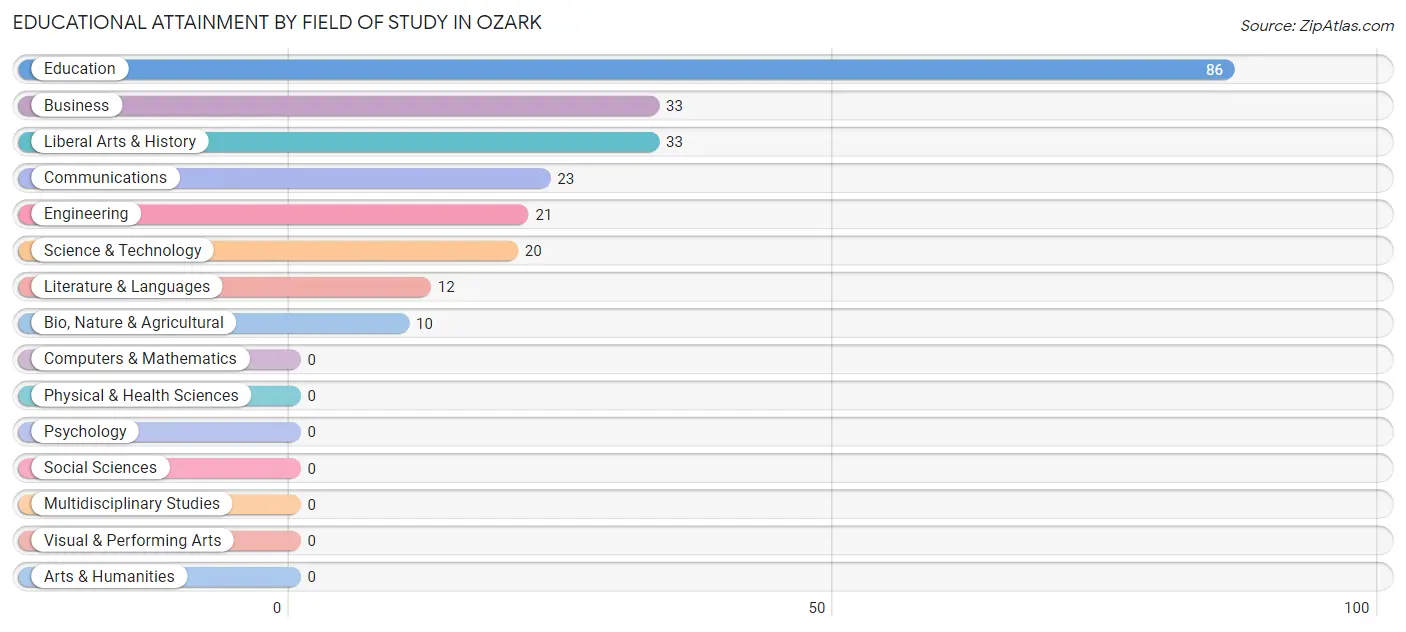
| Field of Study | # Graduates | % Graduates |
| Computers & Mathematics | 0 | 0.0% |
| Bio, Nature & Agricultural | 10 | 4.2% |
| Physical & Health Sciences | 0 | 0.0% |
| Psychology | 0 | 0.0% |
| Social Sciences | 0 | 0.0% |
| Engineering | 21 | 8.8% |
| Multidisciplinary Studies | 0 | 0.0% |
| Science & Technology | 20 | 8.4% |
| Business | 33 | 13.9% |
| Education | 86 | 36.1% |
| Literature & Languages | 12 | 5.0% |
| Liberal Arts & History | 33 | 13.9% |
| Visual & Performing Arts | 0 | 0.0% |
| Communications | 23 | 9.7% |
| Arts & Humanities | 0 | 0.0% |
| Total | 238 | 100.0% |
Transportation & Commute in Ozark
Vehicle Availability by Sex in Ozark
The most prevalent vehicle ownership categories in Ozark are males with 1 vehicle (235, accounting for 28.4%) and females with 1 vehicle (86, making up 60.4%).
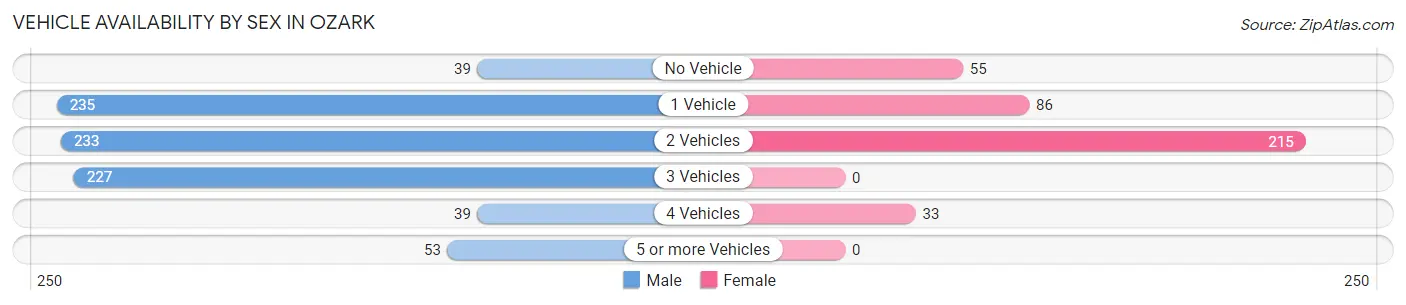
| Vehicles Available | Male | Female |
| No Vehicle | 39 (4.7%) | 55 (14.1%) |
| 1 Vehicle | 235 (28.4%) | 86 (22.1%) |
| 2 Vehicles | 233 (28.2%) | 215 (55.3%) |
| 3 Vehicles | 227 (27.5%) | 0 (0.0%) |
| 4 Vehicles | 39 (4.7%) | 33 (8.5%) |
| 5 or more Vehicles | 53 (6.4%) | 0 (0.0%) |
| Total | 826 (100.0%) | 389 (100.0%) |
Commute Time in Ozark
The most frequently occuring commute durations in Ozark are 45 to 59 minutes (376 commuters, 31.5%), less than 5 minutes (241 commuters, 20.2%), and 15 to 19 minutes (218 commuters, 18.3%).
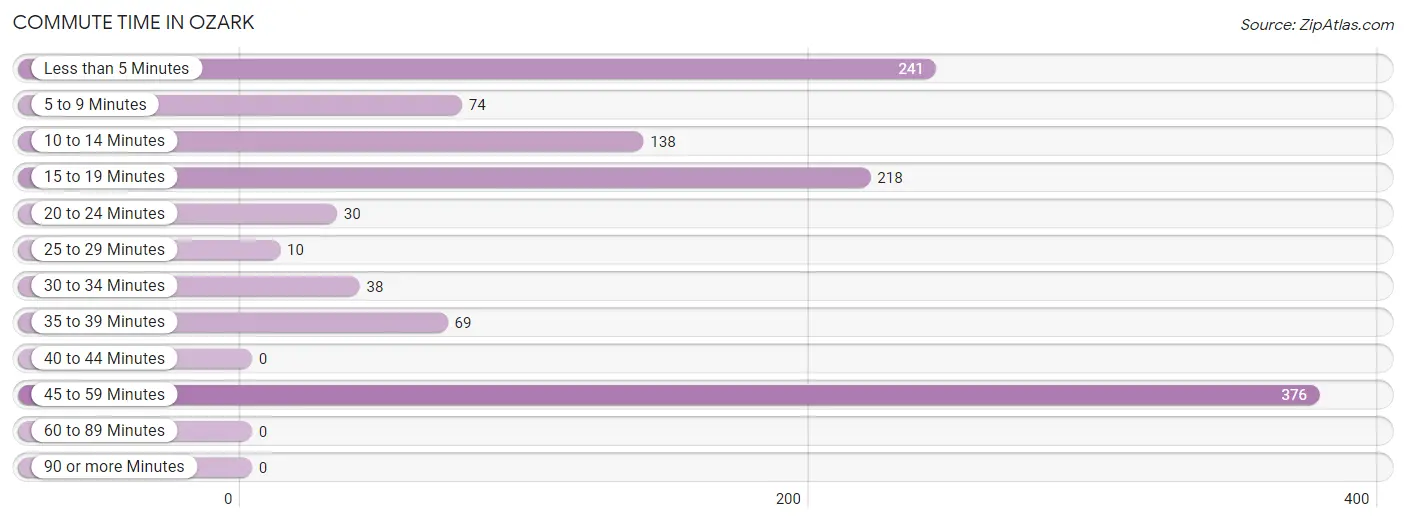
| Commute Time | # Commuters | % Commuters |
| Less than 5 Minutes | 241 | 20.2% |
| 5 to 9 Minutes | 74 | 6.2% |
| 10 to 14 Minutes | 138 | 11.6% |
| 15 to 19 Minutes | 218 | 18.3% |
| 20 to 24 Minutes | 30 | 2.5% |
| 25 to 29 Minutes | 10 | 0.8% |
| 30 to 34 Minutes | 38 | 3.2% |
| 35 to 39 Minutes | 69 | 5.8% |
| 40 to 44 Minutes | 0 | 0.0% |
| 45 to 59 Minutes | 376 | 31.5% |
| 60 to 89 Minutes | 0 | 0.0% |
| 90 or more Minutes | 0 | 0.0% |
Commute Time by Sex in Ozark
The most common commute times in Ozark are 45 to 59 minutes (201 commuters, 25.0%) for males and 45 to 59 minutes (175 commuters, 44.8%) for females.
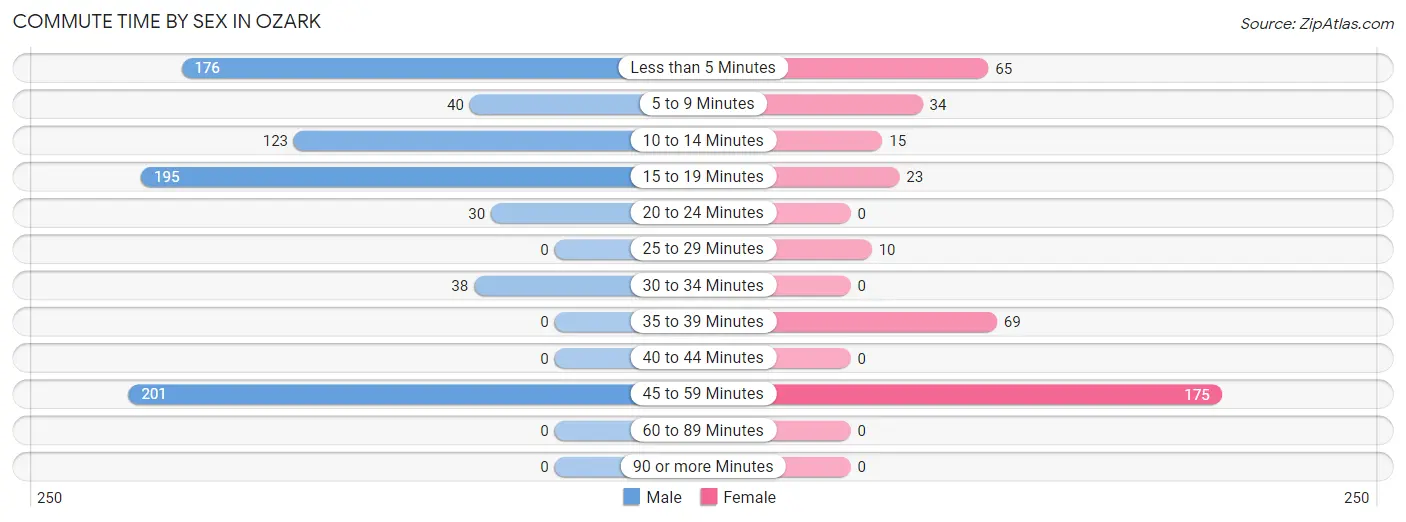
| Commute Time | Male | Female |
| Less than 5 Minutes | 176 (21.9%) | 65 (16.6%) |
| 5 to 9 Minutes | 40 (5.0%) | 34 (8.7%) |
| 10 to 14 Minutes | 123 (15.3%) | 15 (3.8%) |
| 15 to 19 Minutes | 195 (24.3%) | 23 (5.9%) |
| 20 to 24 Minutes | 30 (3.7%) | 0 (0.0%) |
| 25 to 29 Minutes | 0 (0.0%) | 10 (2.6%) |
| 30 to 34 Minutes | 38 (4.7%) | 0 (0.0%) |
| 35 to 39 Minutes | 0 (0.0%) | 69 (17.6%) |
| 40 to 44 Minutes | 0 (0.0%) | 0 (0.0%) |
| 45 to 59 Minutes | 201 (25.0%) | 175 (44.8%) |
| 60 to 89 Minutes | 0 (0.0%) | 0 (0.0%) |
| 90 or more Minutes | 0 (0.0%) | 0 (0.0%) |
Time of Departure to Work by Sex in Ozark
The most frequent times of departure to work in Ozark are 12:00 PM to 3:59 PM (259, 32.3%) for males and 7:00 AM to 7:29 AM (120, 30.7%) for females.
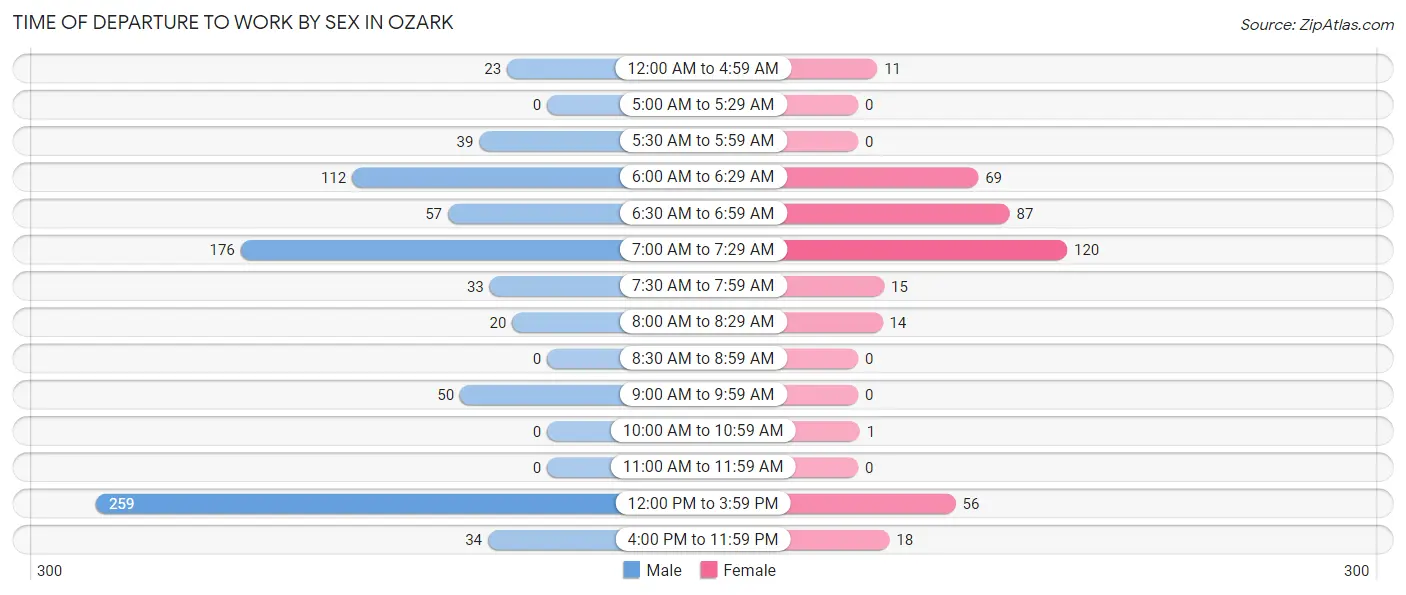
| Time of Departure | Male | Female |
| 12:00 AM to 4:59 AM | 23 (2.9%) | 11 (2.8%) |
| 5:00 AM to 5:29 AM | 0 (0.0%) | 0 (0.0%) |
| 5:30 AM to 5:59 AM | 39 (4.9%) | 0 (0.0%) |
| 6:00 AM to 6:29 AM | 112 (14.0%) | 69 (17.6%) |
| 6:30 AM to 6:59 AM | 57 (7.1%) | 87 (22.3%) |
| 7:00 AM to 7:29 AM | 176 (21.9%) | 120 (30.7%) |
| 7:30 AM to 7:59 AM | 33 (4.1%) | 15 (3.8%) |
| 8:00 AM to 8:29 AM | 20 (2.5%) | 14 (3.6%) |
| 8:30 AM to 8:59 AM | 0 (0.0%) | 0 (0.0%) |
| 9:00 AM to 9:59 AM | 50 (6.2%) | 0 (0.0%) |
| 10:00 AM to 10:59 AM | 0 (0.0%) | 1 (0.3%) |
| 11:00 AM to 11:59 AM | 0 (0.0%) | 0 (0.0%) |
| 12:00 PM to 3:59 PM | 259 (32.3%) | 56 (14.3%) |
| 4:00 PM to 11:59 PM | 34 (4.2%) | 18 (4.6%) |
| Total | 803 (100.0%) | 391 (100.0%) |
Housing Occupancy in Ozark
Occupancy by Ownership in Ozark
Of the total 1,361 dwellings in Ozark, owner-occupied units account for 519 (38.1%), while renter-occupied units make up 842 (61.9%).
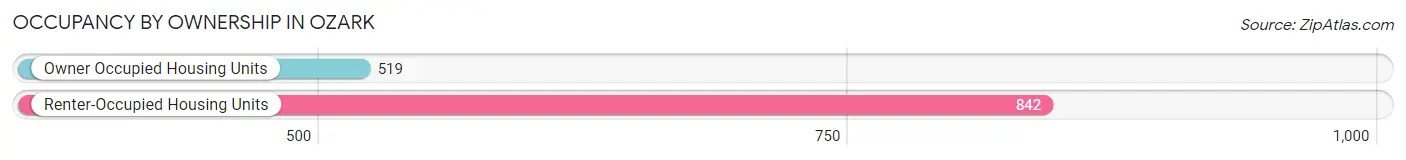
| Occupancy | # Housing Units | % Housing Units |
| Owner Occupied Housing Units | 519 | 38.1% |
| Renter-Occupied Housing Units | 842 | 61.9% |
| Total Occupied Housing Units | 1,361 | 100.0% |
Occupancy by Household Size in Ozark
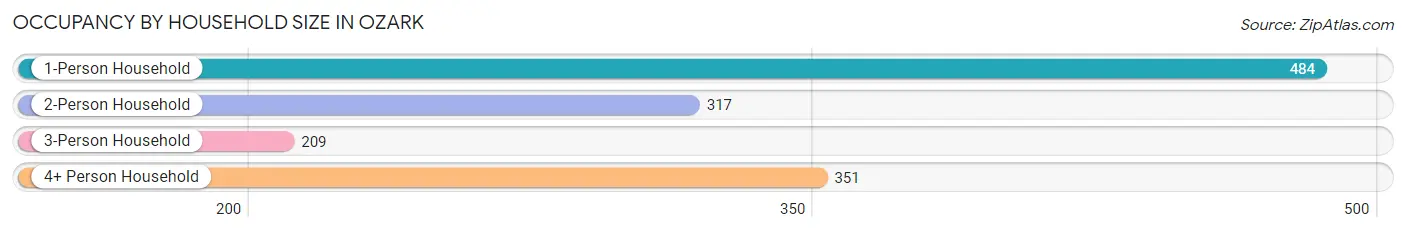
| Household Size | # Housing Units | % Housing Units |
| 1-Person Household | 484 | 35.6% |
| 2-Person Household | 317 | 23.3% |
| 3-Person Household | 209 | 15.4% |
| 4+ Person Household | 351 | 25.8% |
| Total Housing Units | 1,361 | 100.0% |
Occupancy by Ownership by Household Size in Ozark
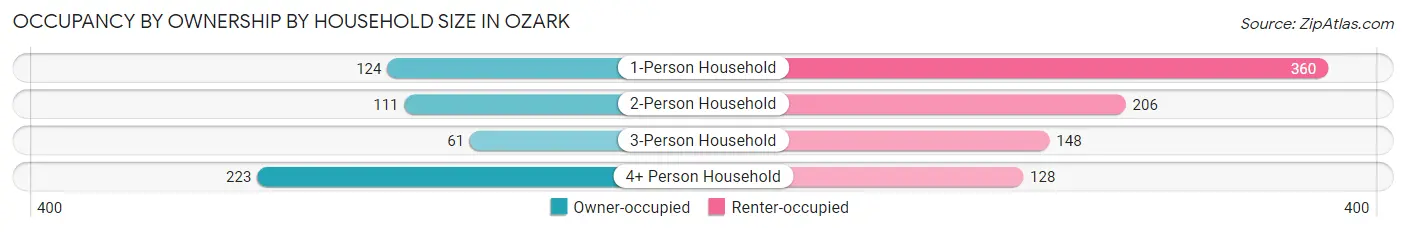
| Household Size | Owner-occupied | Renter-occupied |
| 1-Person Household | 124 (25.6%) | 360 (74.4%) |
| 2-Person Household | 111 (35.0%) | 206 (65.0%) |
| 3-Person Household | 61 (29.2%) | 148 (70.8%) |
| 4+ Person Household | 223 (63.5%) | 128 (36.5%) |
| Total Housing Units | 519 (38.1%) | 842 (61.9%) |
Occupancy by Educational Attainment in Ozark
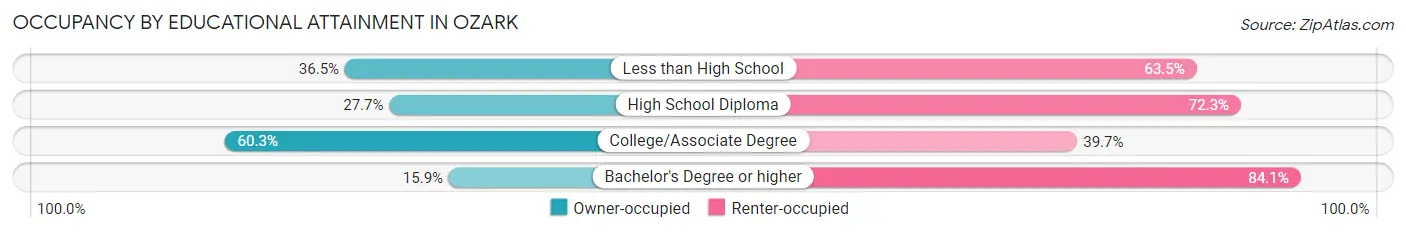
| Household Size | Owner-occupied | Renter-occupied |
| Less than High School | 27 (36.5%) | 47 (63.5%) |
| High School Diploma | 170 (27.7%) | 444 (72.3%) |
| College/Associate Degree | 292 (60.3%) | 192 (39.7%) |
| Bachelor's Degree or higher | 30 (15.9%) | 159 (84.1%) |
Occupancy by Age of Householder in Ozark
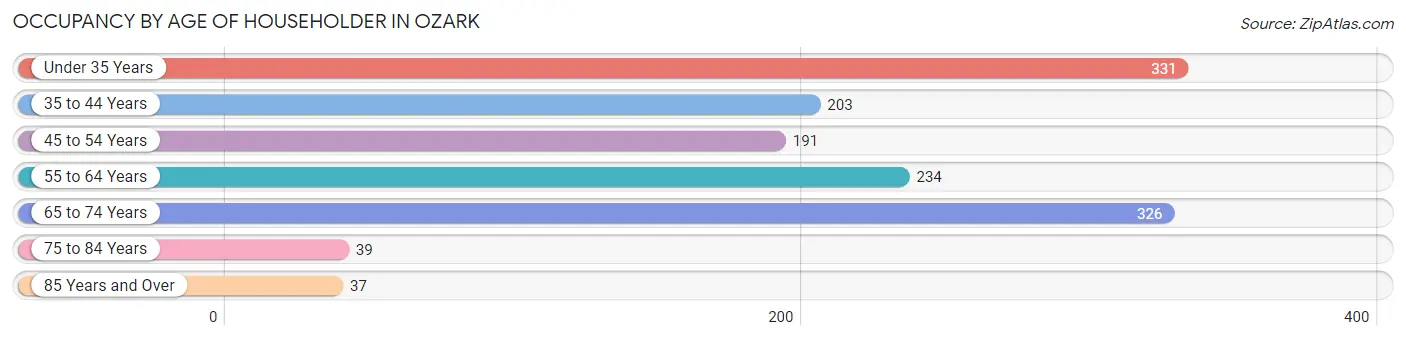
| Age Bracket | # Households | % Households |
| Under 35 Years | 331 | 24.3% |
| 35 to 44 Years | 203 | 14.9% |
| 45 to 54 Years | 191 | 14.0% |
| 55 to 64 Years | 234 | 17.2% |
| 65 to 74 Years | 326 | 23.9% |
| 75 to 84 Years | 39 | 2.9% |
| 85 Years and Over | 37 | 2.7% |
| Total | 1,361 | 100.0% |
Housing Finances in Ozark
Median Income by Occupancy in Ozark
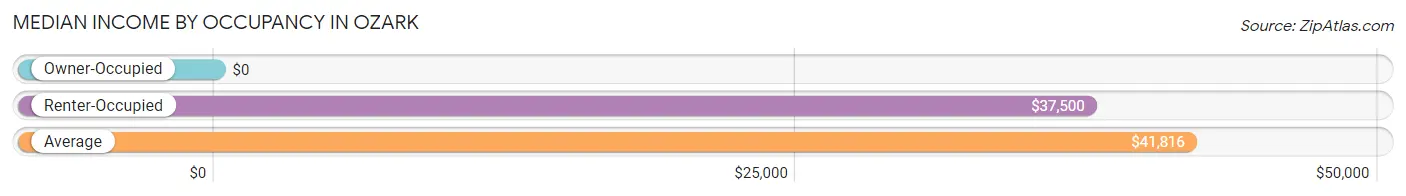
| Occupancy Type | # Households | Median Income |
| Owner-Occupied | 519 (38.1%) | $0 |
| Renter-Occupied | 842 (61.9%) | $37,500 |
| Average | 1,361 (100.0%) | $41,816 |
Occupancy by Householder Income Bracket in Ozark
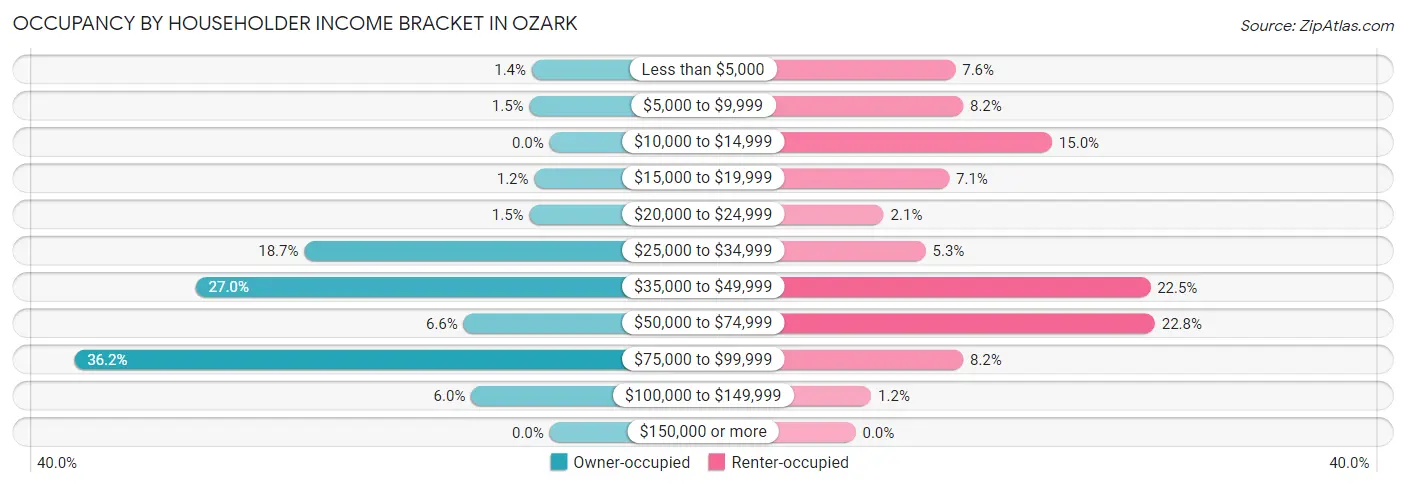
| Income Bracket | Owner-occupied | Renter-occupied |
| Less than $5,000 | 7 (1.3%) | 64 (7.6%) |
| $5,000 to $9,999 | 8 (1.5%) | 69 (8.2%) |
| $10,000 to $14,999 | 0 (0.0%) | 126 (15.0%) |
| $15,000 to $19,999 | 6 (1.2%) | 60 (7.1%) |
| $20,000 to $24,999 | 8 (1.5%) | 18 (2.1%) |
| $25,000 to $34,999 | 97 (18.7%) | 45 (5.3%) |
| $35,000 to $49,999 | 140 (27.0%) | 189 (22.5%) |
| $50,000 to $74,999 | 34 (6.6%) | 192 (22.8%) |
| $75,000 to $99,999 | 188 (36.2%) | 69 (8.2%) |
| $100,000 to $149,999 | 31 (6.0%) | 10 (1.2%) |
| $150,000 or more | 0 (0.0%) | 0 (0.0%) |
| Total | 519 (100.0%) | 842 (100.0%) |
Monthly Housing Cost Tiers in Ozark
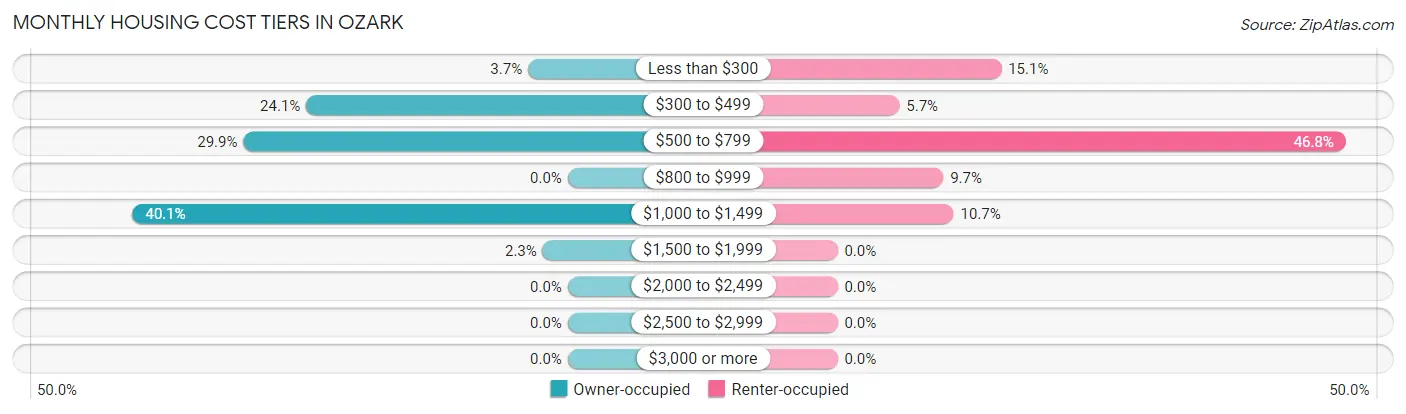
| Monthly Cost | Owner-occupied | Renter-occupied |
| Less than $300 | 19 (3.7%) | 127 (15.1%) |
| $300 to $499 | 125 (24.1%) | 48 (5.7%) |
| $500 to $799 | 155 (29.9%) | 394 (46.8%) |
| $800 to $999 | 0 (0.0%) | 82 (9.7%) |
| $1,000 to $1,499 | 208 (40.1%) | 90 (10.7%) |
| $1,500 to $1,999 | 12 (2.3%) | 0 (0.0%) |
| $2,000 to $2,499 | 0 (0.0%) | 0 (0.0%) |
| $2,500 to $2,999 | 0 (0.0%) | 0 (0.0%) |
| $3,000 or more | 0 (0.0%) | 0 (0.0%) |
| Total | 519 (100.0%) | 842 (100.0%) |
Physical Housing Characteristics in Ozark
Housing Structures in Ozark
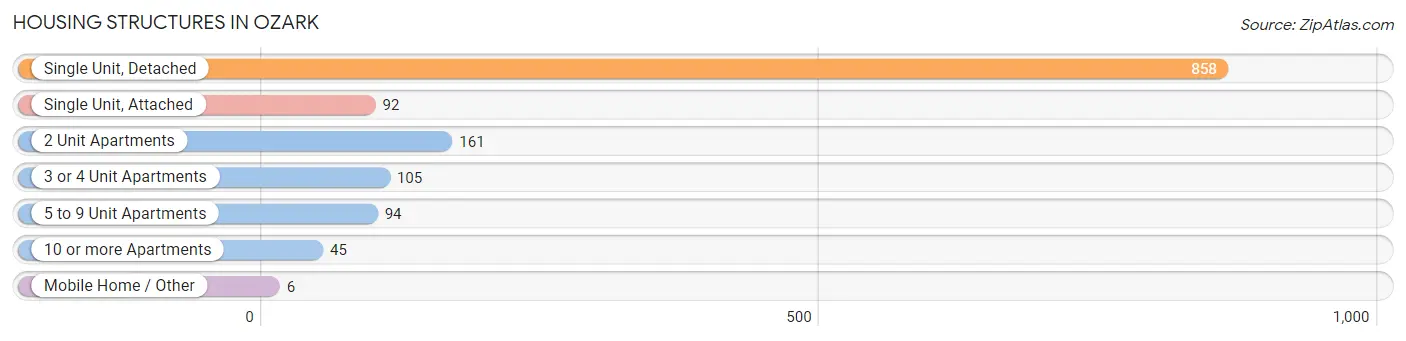
| Structure Type | # Housing Units | % Housing Units |
| Single Unit, Detached | 858 | 63.0% |
| Single Unit, Attached | 92 | 6.8% |
| 2 Unit Apartments | 161 | 11.8% |
| 3 or 4 Unit Apartments | 105 | 7.7% |
| 5 to 9 Unit Apartments | 94 | 6.9% |
| 10 or more Apartments | 45 | 3.3% |
| Mobile Home / Other | 6 | 0.4% |
| Total | 1,361 | 100.0% |
Housing Structures by Occupancy in Ozark
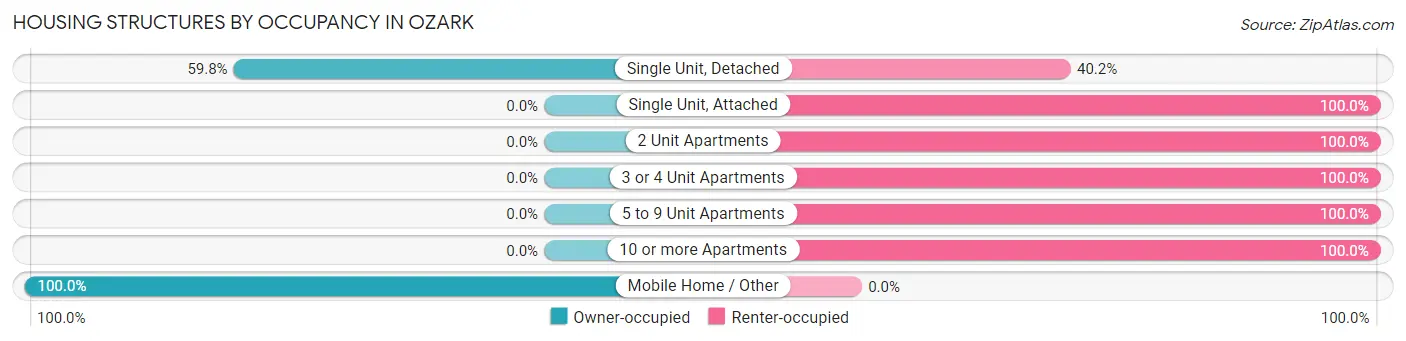
| Structure Type | Owner-occupied | Renter-occupied |
| Single Unit, Detached | 513 (59.8%) | 345 (40.2%) |
| Single Unit, Attached | 0 (0.0%) | 92 (100.0%) |
| 2 Unit Apartments | 0 (0.0%) | 161 (100.0%) |
| 3 or 4 Unit Apartments | 0 (0.0%) | 105 (100.0%) |
| 5 to 9 Unit Apartments | 0 (0.0%) | 94 (100.0%) |
| 10 or more Apartments | 0 (0.0%) | 45 (100.0%) |
| Mobile Home / Other | 6 (100.0%) | 0 (0.0%) |
| Total | 519 (38.1%) | 842 (61.9%) |
Housing Structures by Number of Rooms in Ozark
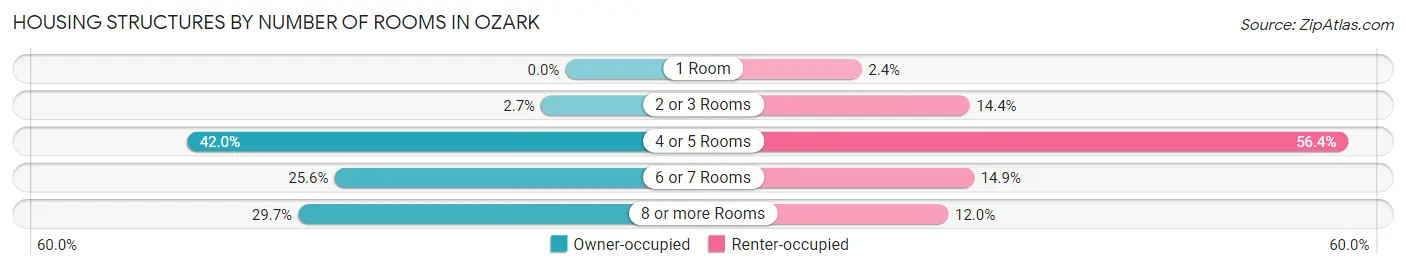
| Number of Rooms | Owner-occupied | Renter-occupied |
| 1 Room | 0 (0.0%) | 20 (2.4%) |
| 2 or 3 Rooms | 14 (2.7%) | 121 (14.4%) |
| 4 or 5 Rooms | 218 (42.0%) | 475 (56.4%) |
| 6 or 7 Rooms | 133 (25.6%) | 125 (14.8%) |
| 8 or more Rooms | 154 (29.7%) | 101 (12.0%) |
| Total | 519 (100.0%) | 842 (100.0%) |
Housing Structure by Heating Type in Ozark
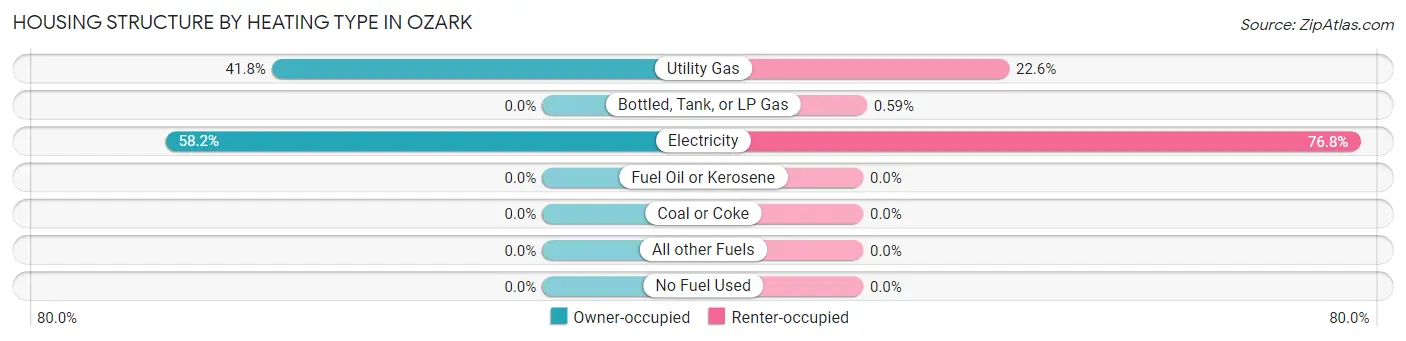
| Heating Type | Owner-occupied | Renter-occupied |
| Utility Gas | 217 (41.8%) | 190 (22.6%) |
| Bottled, Tank, or LP Gas | 0 (0.0%) | 5 (0.6%) |
| Electricity | 302 (58.2%) | 647 (76.8%) |
| Fuel Oil or Kerosene | 0 (0.0%) | 0 (0.0%) |
| Coal or Coke | 0 (0.0%) | 0 (0.0%) |
| All other Fuels | 0 (0.0%) | 0 (0.0%) |
| No Fuel Used | 0 (0.0%) | 0 (0.0%) |
| Total | 519 (100.0%) | 842 (100.0%) |
Household Vehicle Usage in Ozark
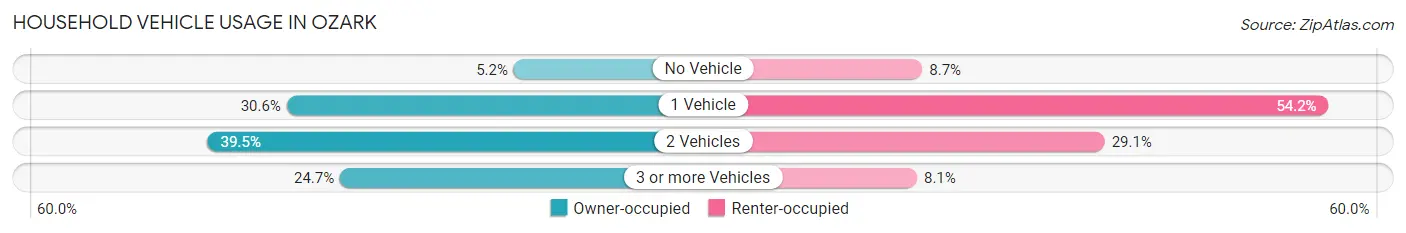
| Vehicles per Household | Owner-occupied | Renter-occupied |
| No Vehicle | 27 (5.2%) | 73 (8.7%) |
| 1 Vehicle | 159 (30.6%) | 456 (54.2%) |
| 2 Vehicles | 205 (39.5%) | 245 (29.1%) |
| 3 or more Vehicles | 128 (24.7%) | 68 (8.1%) |
| Total | 519 (100.0%) | 842 (100.0%) |
Real Estate & Mortgages in Ozark
Real Estate and Mortgage Overview in Ozark
| Characteristic | Without Mortgage | With Mortgage |
| Housing Units | 163 | 356 |
| Median Property Value | $106,000 | $99,300 |
| Median Household Income | - | - |
| Monthly Housing Costs | $389 | $0 |
| Real Estate Taxes | $754 | $0 |
Property Value by Mortgage Status in Ozark
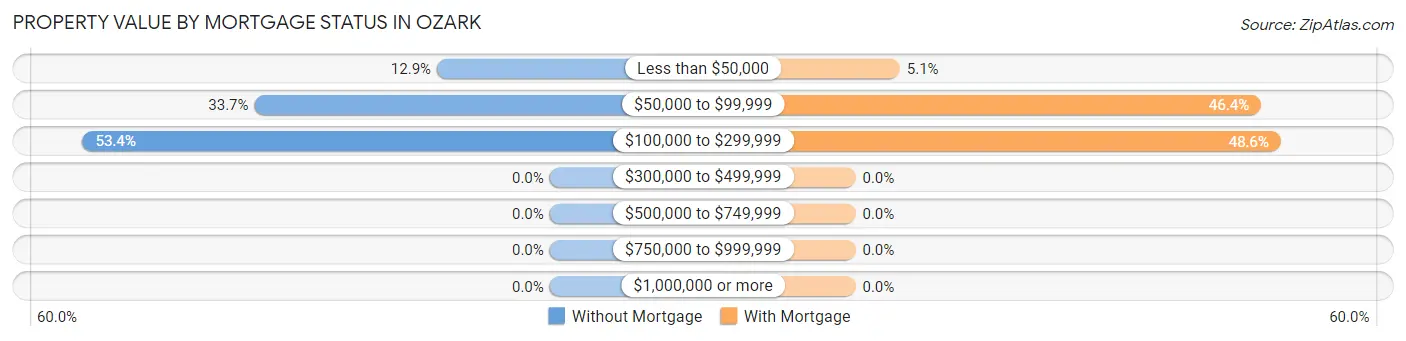
| Property Value | Without Mortgage | With Mortgage |
| Less than $50,000 | 21 (12.9%) | 18 (5.1%) |
| $50,000 to $99,999 | 55 (33.7%) | 165 (46.4%) |
| $100,000 to $299,999 | 87 (53.4%) | 173 (48.6%) |
| $300,000 to $499,999 | 0 (0.0%) | 0 (0.0%) |
| $500,000 to $749,999 | 0 (0.0%) | 0 (0.0%) |
| $750,000 to $999,999 | 0 (0.0%) | 0 (0.0%) |
| $1,000,000 or more | 0 (0.0%) | 0 (0.0%) |
| Total | 163 (100.0%) | 356 (100.0%) |
Household Income by Mortgage Status in Ozark
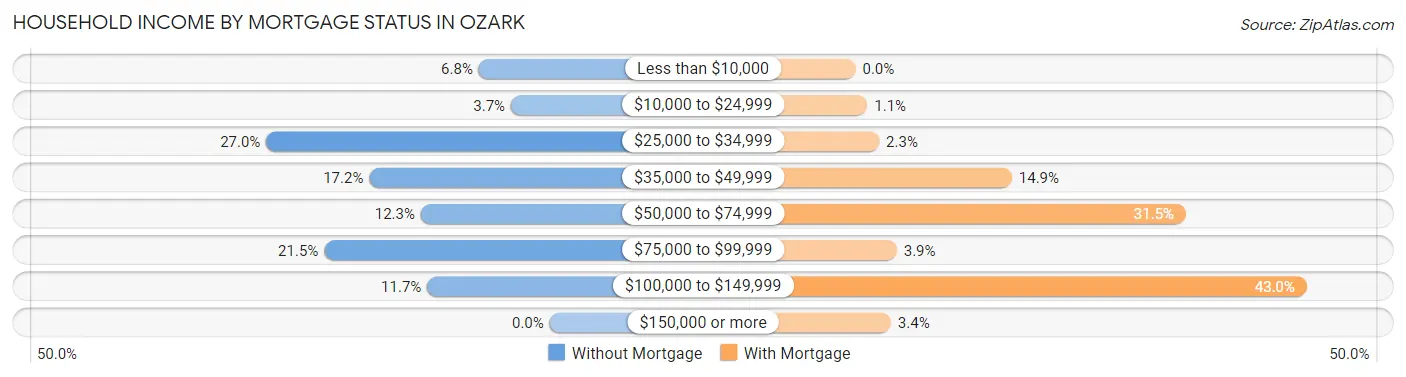
| Household Income | Without Mortgage | With Mortgage |
| Less than $10,000 | 11 (6.8%) | 0 (0.0%) |
| $10,000 to $24,999 | 6 (3.7%) | 4 (1.1%) |
| $25,000 to $34,999 | 44 (27.0%) | 8 (2.2%) |
| $35,000 to $49,999 | 28 (17.2%) | 53 (14.9%) |
| $50,000 to $74,999 | 20 (12.3%) | 112 (31.5%) |
| $75,000 to $99,999 | 35 (21.5%) | 14 (3.9%) |
| $100,000 to $149,999 | 19 (11.7%) | 153 (43.0%) |
| $150,000 or more | 0 (0.0%) | 12 (3.4%) |
| Total | 163 (100.0%) | 356 (100.0%) |
Property Value to Household Income Ratio in Ozark
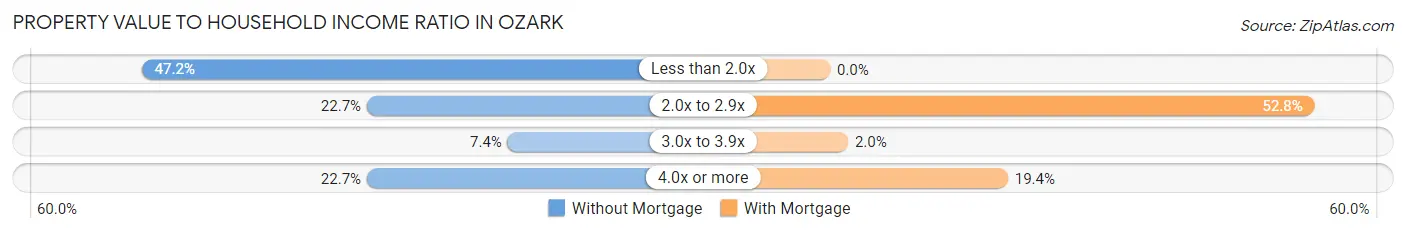
| Value-to-Income Ratio | Without Mortgage | With Mortgage |
| Less than 2.0x | 77 (47.2%) | 0 (0.0%) |
| 2.0x to 2.9x | 37 (22.7%) | 188 (52.8%) |
| 3.0x to 3.9x | 12 (7.4%) | 7 (2.0%) |
| 4.0x or more | 37 (22.7%) | 69 (19.4%) |
| Total | 163 (100.0%) | 356 (100.0%) |
Real Estate Taxes by Mortgage Status in Ozark
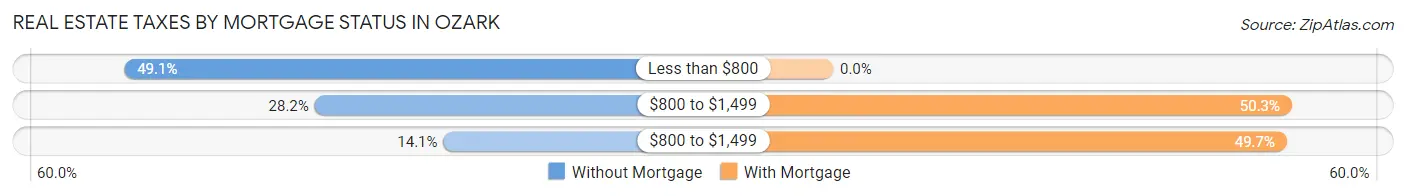
| Property Taxes | Without Mortgage | With Mortgage |
| Less than $800 | 80 (49.1%) | 0 (0.0%) |
| $800 to $1,499 | 46 (28.2%) | 179 (50.3%) |
| $800 to $1,499 | 23 (14.1%) | 177 (49.7%) |
| Total | 163 (100.0%) | 356 (100.0%) |
Health & Disability in Ozark
Health Insurance Coverage by Age in Ozark
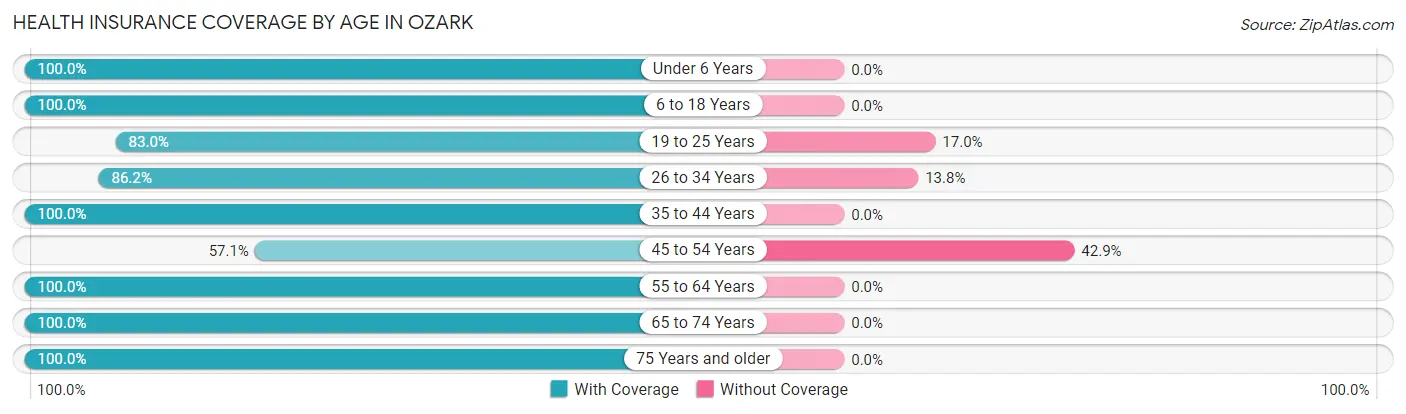
| Age Bracket | With Coverage | Without Coverage |
| Under 6 Years | 384 (100.0%) | 0 (0.0%) |
| 6 to 18 Years | 340 (100.0%) | 0 (0.0%) |
| 19 to 25 Years | 303 (83.0%) | 62 (17.0%) |
| 26 to 34 Years | 644 (86.2%) | 103 (13.8%) |
| 35 to 44 Years | 317 (100.0%) | 0 (0.0%) |
| 45 to 54 Years | 290 (57.1%) | 218 (42.9%) |
| 55 to 64 Years | 260 (100.0%) | 0 (0.0%) |
| 65 to 74 Years | 351 (100.0%) | 0 (0.0%) |
| 75 Years and older | 157 (100.0%) | 0 (0.0%) |
| Total | 3,046 (88.8%) | 383 (11.2%) |
Health Insurance Coverage by Citizenship Status in Ozark
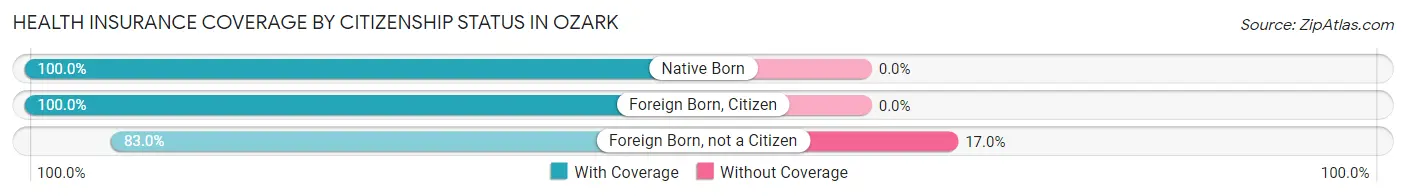
| Citizenship Status | With Coverage | Without Coverage |
| Native Born | 384 (100.0%) | 0 (0.0%) |
| Foreign Born, Citizen | 340 (100.0%) | 0 (0.0%) |
| Foreign Born, not a Citizen | 303 (83.0%) | 62 (17.0%) |
Health Insurance Coverage by Household Income in Ozark
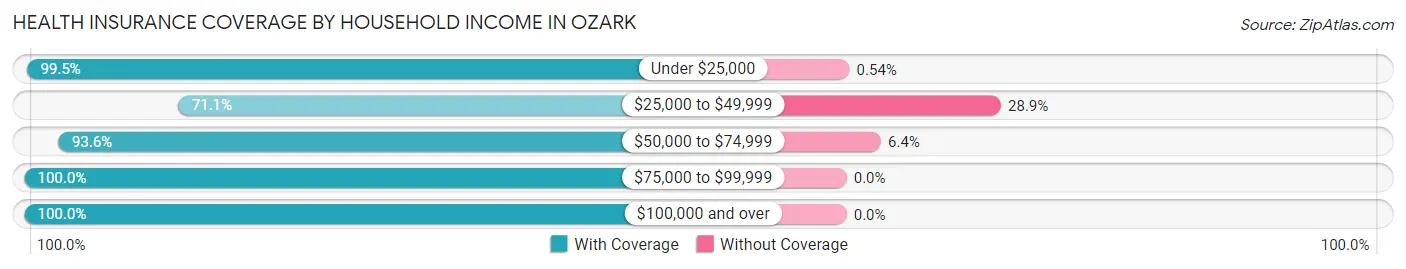
| Household Income | With Coverage | Without Coverage |
| Under $25,000 | 551 (99.5%) | 3 (0.5%) |
| $25,000 to $49,999 | 846 (71.1%) | 344 (28.9%) |
| $50,000 to $74,999 | 524 (93.6%) | 36 (6.4%) |
| $75,000 to $99,999 | 1,007 (100.0%) | 0 (0.0%) |
| $100,000 and over | 107 (100.0%) | 0 (0.0%) |
Public vs Private Health Insurance Coverage by Age in Ozark
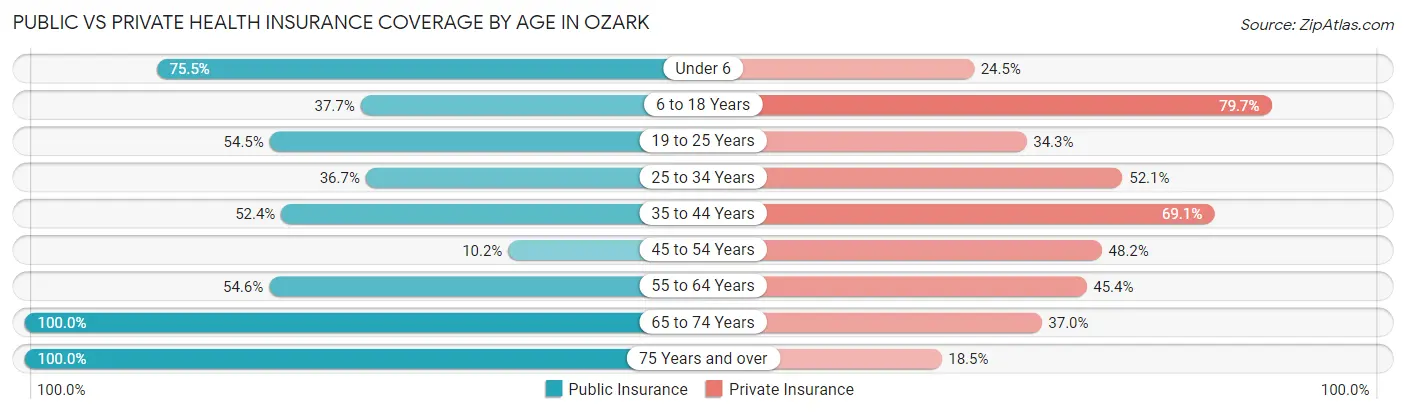
| Age Bracket | Public Insurance | Private Insurance |
| Under 6 | 290 (75.5%) | 94 (24.5%) |
| 6 to 18 Years | 128 (37.7%) | 271 (79.7%) |
| 19 to 25 Years | 199 (54.5%) | 125 (34.3%) |
| 25 to 34 Years | 274 (36.7%) | 389 (52.1%) |
| 35 to 44 Years | 166 (52.4%) | 219 (69.1%) |
| 45 to 54 Years | 52 (10.2%) | 245 (48.2%) |
| 55 to 64 Years | 142 (54.6%) | 118 (45.4%) |
| 65 to 74 Years | 351 (100.0%) | 130 (37.0%) |
| 75 Years and over | 157 (100.0%) | 29 (18.5%) |
| Total | 1,759 (51.3%) | 1,620 (47.2%) |
Disability Status by Sex by Age in Ozark
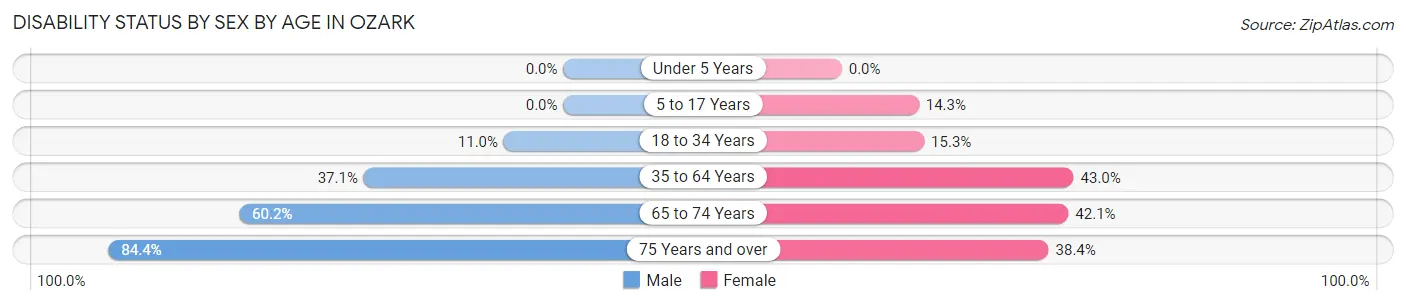
| Age Bracket | Male | Female |
| Under 5 Years | 0 (0.0%) | 0 (0.0%) |
| 5 to 17 Years | 0 (0.0%) | 30 (14.3%) |
| 18 to 34 Years | 54 (11.0%) | 96 (15.3%) |
| 35 to 64 Years | 216 (37.0%) | 216 (43.0%) |
| 65 to 74 Years | 71 (60.2%) | 98 (42.1%) |
| 75 Years and over | 38 (84.4%) | 43 (38.4%) |
Disability Class by Sex by Age in Ozark
Disability Class: Hearing Difficulty
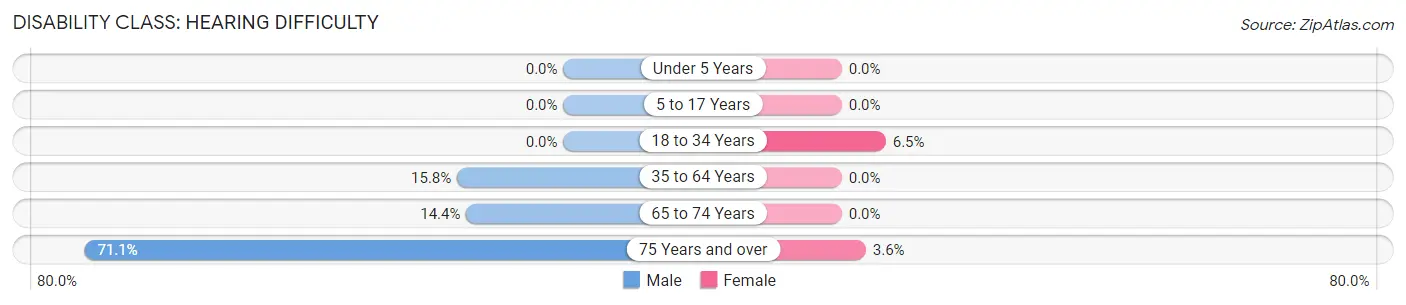
| Age Bracket | Male | Female |
| Under 5 Years | 0 (0.0%) | 0 (0.0%) |
| 5 to 17 Years | 0 (0.0%) | 0 (0.0%) |
| 18 to 34 Years | 0 (0.0%) | 41 (6.5%) |
| 35 to 64 Years | 92 (15.8%) | 0 (0.0%) |
| 65 to 74 Years | 17 (14.4%) | 0 (0.0%) |
| 75 Years and over | 32 (71.1%) | 4 (3.6%) |
Disability Class: Vision Difficulty
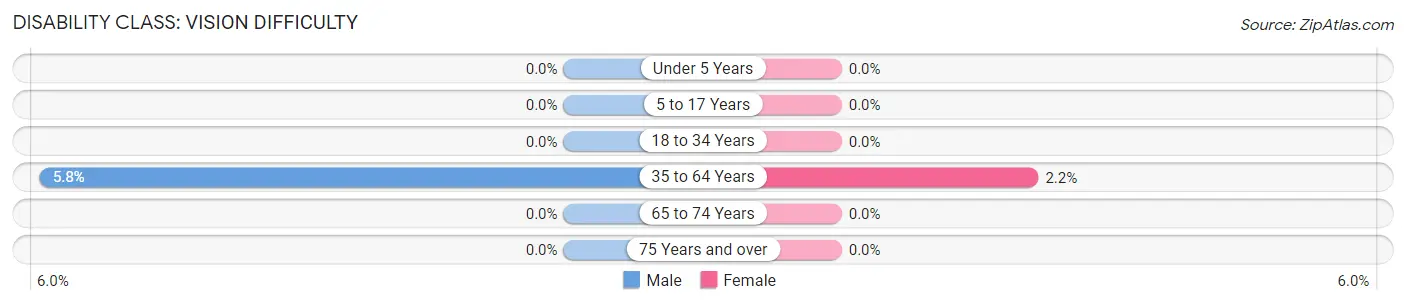
| Age Bracket | Male | Female |
| Under 5 Years | 0 (0.0%) | 0 (0.0%) |
| 5 to 17 Years | 0 (0.0%) | 0 (0.0%) |
| 18 to 34 Years | 0 (0.0%) | 0 (0.0%) |
| 35 to 64 Years | 34 (5.8%) | 11 (2.2%) |
| 65 to 74 Years | 0 (0.0%) | 0 (0.0%) |
| 75 Years and over | 0 (0.0%) | 0 (0.0%) |
Disability Class: Cognitive Difficulty
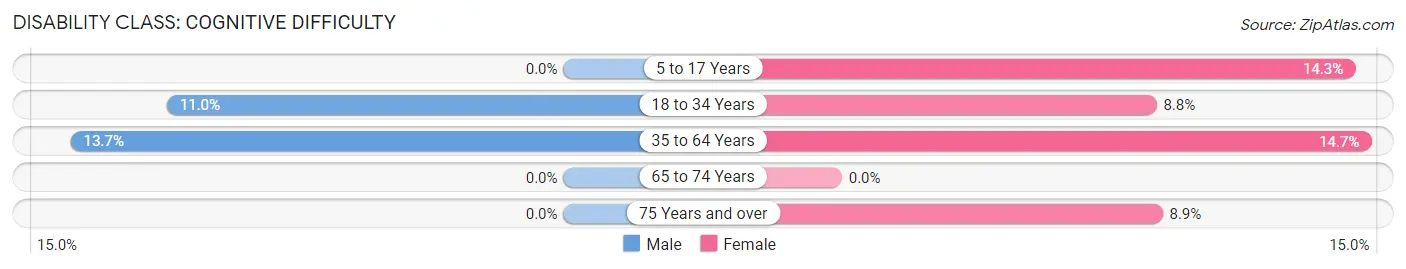
| Age Bracket | Male | Female |
| 5 to 17 Years | 0 (0.0%) | 30 (14.3%) |
| 18 to 34 Years | 54 (11.0%) | 55 (8.8%) |
| 35 to 64 Years | 80 (13.7%) | 74 (14.7%) |
| 65 to 74 Years | 0 (0.0%) | 0 (0.0%) |
| 75 Years and over | 0 (0.0%) | 10 (8.9%) |
Disability Class: Ambulatory Difficulty
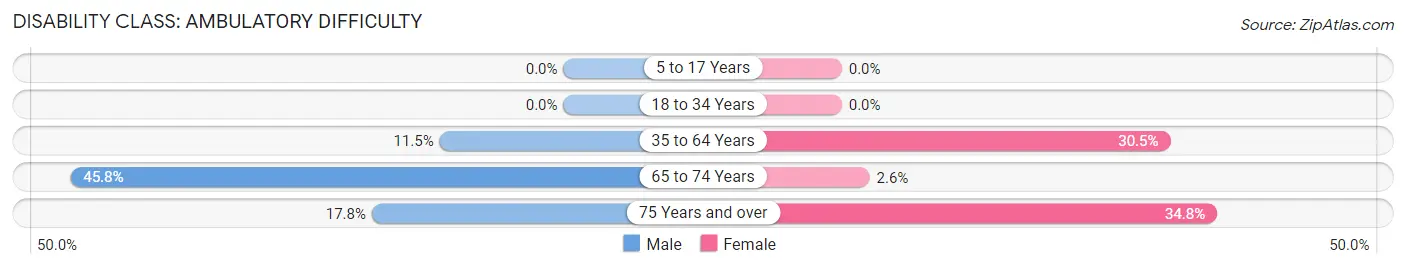
| Age Bracket | Male | Female |
| 5 to 17 Years | 0 (0.0%) | 0 (0.0%) |
| 18 to 34 Years | 0 (0.0%) | 0 (0.0%) |
| 35 to 64 Years | 67 (11.5%) | 153 (30.5%) |
| 65 to 74 Years | 54 (45.8%) | 6 (2.6%) |
| 75 Years and over | 8 (17.8%) | 39 (34.8%) |
Disability Class: Self-Care Difficulty
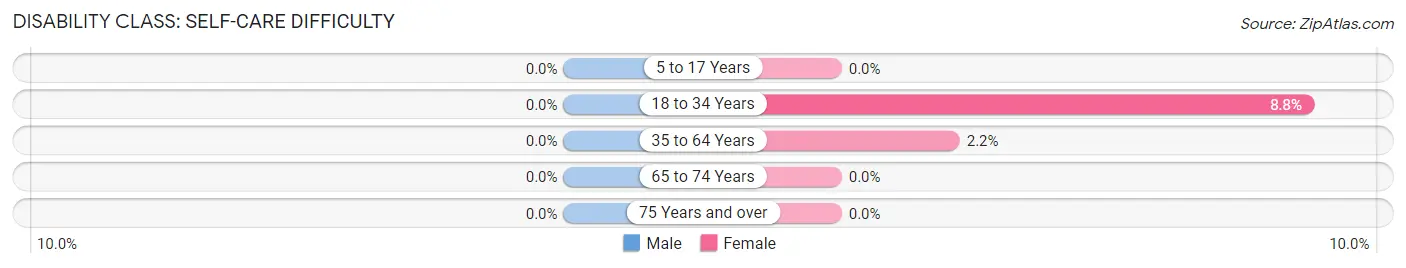
| Age Bracket | Male | Female |
| 5 to 17 Years | 0 (0.0%) | 0 (0.0%) |
| 18 to 34 Years | 0 (0.0%) | 55 (8.8%) |
| 35 to 64 Years | 0 (0.0%) | 11 (2.2%) |
| 65 to 74 Years | 0 (0.0%) | 0 (0.0%) |
| 75 Years and over | 0 (0.0%) | 0 (0.0%) |
Technology Access in Ozark
Computing Device Access in Ozark
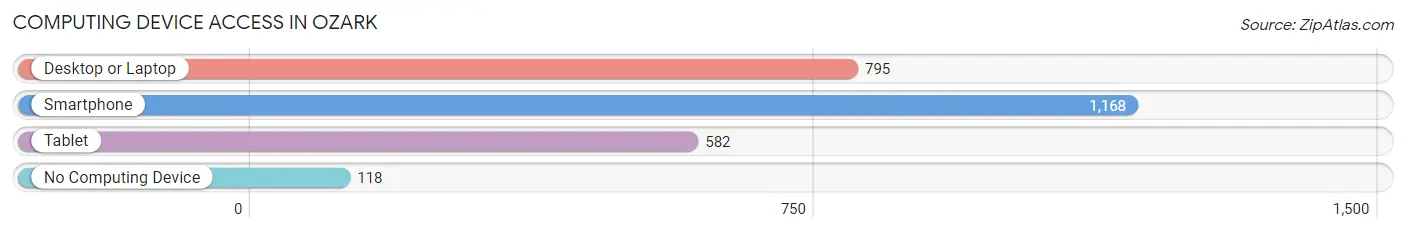
| Device Type | # Households | % Households |
| Desktop or Laptop | 795 | 58.4% |
| Smartphone | 1,168 | 85.8% |
| Tablet | 582 | 42.8% |
| No Computing Device | 118 | 8.7% |
| Total | 1,361 | 100.0% |
Internet Access in Ozark
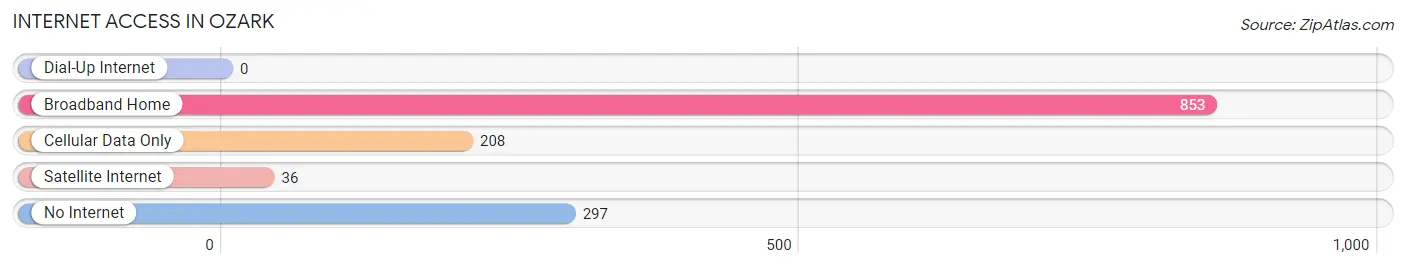
| Internet Type | # Households | % Households |
| Dial-Up Internet | 0 | 0.0% |
| Broadband Home | 853 | 62.7% |
| Cellular Data Only | 208 | 15.3% |
| Satellite Internet | 36 | 2.6% |
| No Internet | 297 | 21.8% |
| Total | 1,361 | 100.0% |
Ozark Summary
Ozark, Arkansas is a small city located in Franklin County in the northwest corner of the state. It is situated on the Arkansas River, and is the county seat of Franklin County. The city has a population of approximately 4,000 people, and is part of the Fort Smith metropolitan area.
History
Ozark was founded in 1836 by settlers from Tennessee and Kentucky. The city was named after the Ozark Mountains, which are located in the nearby region. The city was incorporated in 1872, and was the first city in Franklin County.
In the late 19th century, Ozark was a thriving river port, and was the largest city in the county. The city was home to a number of businesses, including a cotton gin, a sawmill, a grist mill, and a brickyard. The city also had a number of churches, schools, and a newspaper.
In the early 20th century, the city experienced a period of decline. The Great Depression and the Dust Bowl caused many of the businesses to close, and the population of the city decreased.
Geography
Ozark is located in the northwest corner of Arkansas, in Franklin County. The city is situated on the Arkansas River, and is surrounded by the Ozark Mountains. The city is located approximately 30 miles south of Fort Smith, and is part of the Fort Smith metropolitan area.
The city has a total area of 4.2 square miles, all of which is land. The city has a humid subtropical climate, with hot, humid summers and mild winters.
Economy
Ozark’s economy is largely based on agriculture and tourism. The city is home to a number of farms, and is a popular destination for hunters and fishermen. The city is also home to a number of small businesses, including restaurants, retail stores, and service providers.
The city is also home to a number of manufacturing companies, including a furniture factory, a plastics factory, and a metal fabrication plant. The city is also home to a number of government offices, including the Franklin County Courthouse and the Ozark Police Department.
Demographics
As of the 2010 census, the population of Ozark was 4,039. The racial makeup of the city was 92.3% White, 4.2% African American, 0.7% Native American, 0.3% Asian, 0.1% Pacific Islander, 0.7% from other races, and 1.9% from two or more races. Hispanic or Latino of any race were 2.2% of the population.
The median income for a household in the city was $30,938, and the median income for a family was $37,917. The per capita income for the city was $17,845. About 17.2% of the population was below the poverty line.
Conclusion
Ozark, Arkansas is a small city located in Franklin County in the northwest corner of the state. It is situated on the Arkansas River, and is the county seat of Franklin County. The city has a population of approximately 4,000 people, and is part of the Fort Smith metropolitan area. The city’s economy is largely based on agriculture and tourism, and is home to a number of small businesses, manufacturing companies, and government offices. The population of the city is predominantly white, with a small percentage of African Americans, Native Americans, Asians, and other races. The median income for a household in the city is $30,938, and the per capita income is $17,845.
Common Questions
What is the Total Population of Ozark?
Total Population of Ozark is 3,546.
What is the Total Male Population of Ozark?
Total Male Population of Ozark is 1,617.
What is the Total Female Population of Ozark?
Total Female Population of Ozark is 1,929.
What is the Ratio of Males per 100 Females in Ozark?
There are 83.83 Males per 100 Females in Ozark.
What is the Ratio of Females per 100 Males in Ozark?
There are 119.29 Females per 100 Males in Ozark.
What is the Median Population Age in Ozark?
Median Population Age in Ozark is 33.4 Years.
What is the Average Family Size in Ozark
Average Family Size in Ozark is 3.0 People.
What is the Average Household Size in Ozark
Average Household Size in Ozark is 2.5 People.
What is Per Capita Income in Ozark?
Per Capita income in Ozark is $19,220.
What is the Median Family Income in Ozark?
Median Family Income in Ozark is $49,429.
What is the Median Household income in Ozark?
Median Household Income in Ozark is $41,816.
What is Income or Wage Gap in Ozark?
Income or Wage Gap in Ozark is 9.6%.
Women in Ozark earn 90.4 cents for every dollar earned by a man.
What is Family Income Deficit in Ozark?
Family Income Deficit in Ozark is $10,833.
Families that are below poverty line in Ozark earn $10,833 less on average than the poverty threshold level.
What is Inequality or Gini Index in Ozark?
Inequality or Gini Index in Ozark is 0.37.
How Large is the Labor Force in Ozark?
There are 1,389 People in the Labor Forcein in Ozark.
What is the Percentage of People in the Labor Force in Ozark?
49.1% of People are in the Labor Force in Ozark.
What is the Unemployment Rate in Ozark?
Unemployment Rate in Ozark is 11.7%.