Zip Codes with the Highest Percentage of Population Employed in Arts, Entertainment & Recreation in North Little Rock, AR
RELATED REPORTS & OPTIONS
Arts, Entertainment & Recreation
North Little Rock
Compare Zip Codes
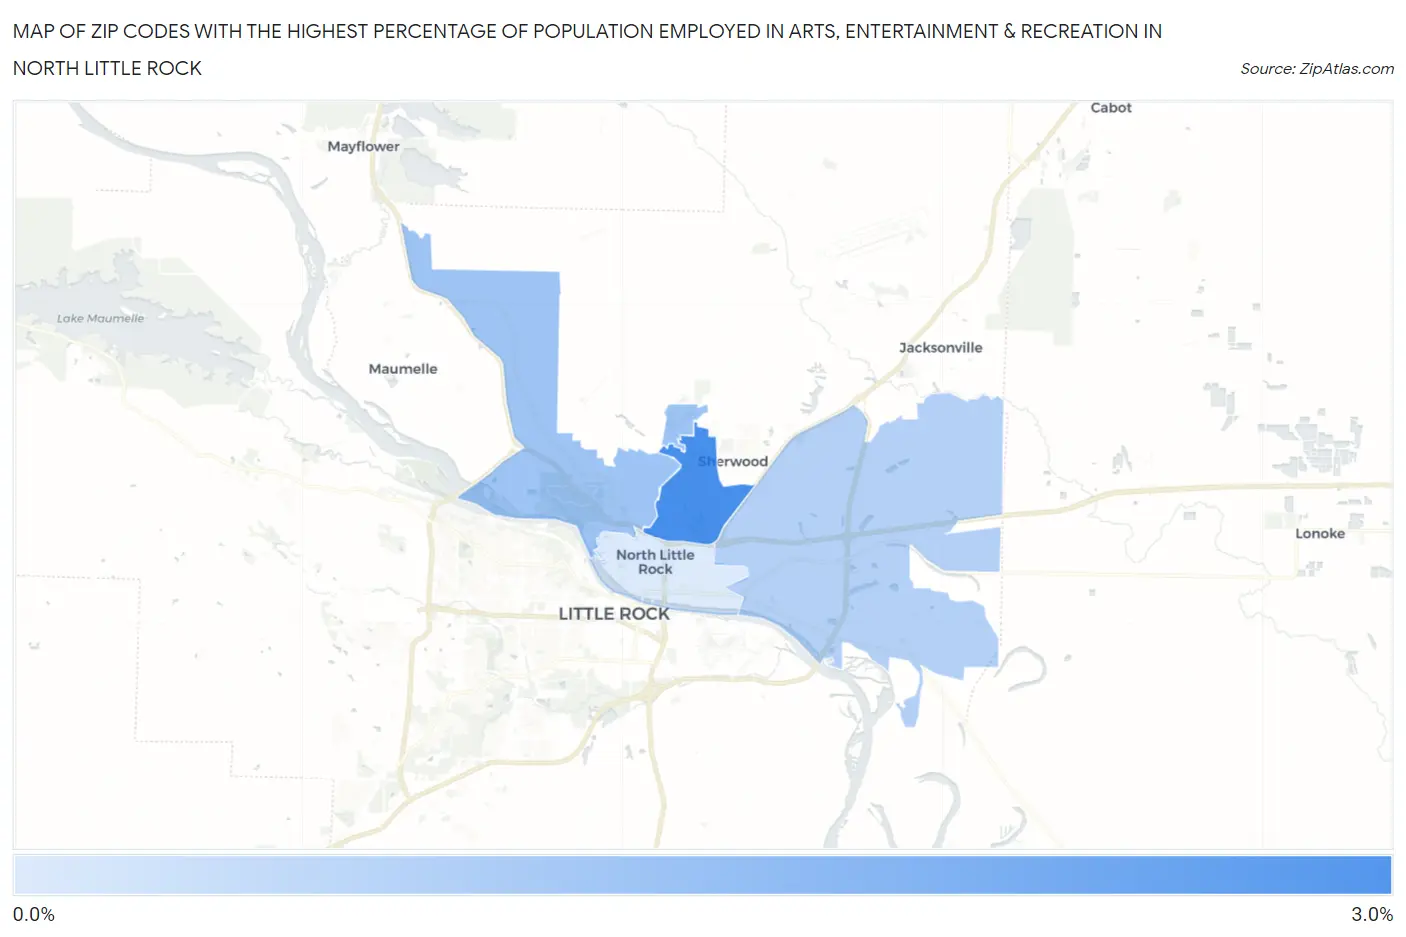
Map of Zip Codes with the Highest Percentage of Population Employed in Arts, Entertainment & Recreation in North Little Rock
0.0%
3.0%
Zip Codes with the Highest Percentage of Population Employed in Arts, Entertainment & Recreation in North Little Rock, AR
| Zip Code | % Employed | vs State | vs National | |
| 1. | 72116 | 2.6% | 1.3%(+1.26)#73 | 2.1%(+0.470)#6,945 |
| 2. | 72118 | 1.2% | 1.3%(-0.120)#158 | 2.1%(-0.906)#15,642 |
| 3. | 72117 | 0.88% | 1.3%(-0.421)#189 | 2.1%(-1.21)#17,876 |
| 4. | 72114 | 0.22% | 1.3%(-1.08)#268 | 2.1%(-1.86)#22,109 |
1
Common Questions
What are the Top 3 Zip Codes with the Highest Percentage of Population Employed in Arts, Entertainment & Recreation in North Little Rock, AR?
Top 3 Zip Codes with the Highest Percentage of Population Employed in Arts, Entertainment & Recreation in North Little Rock, AR are:
What zip code has the Highest Percentage of Population Employed in Arts, Entertainment & Recreation in North Little Rock, AR?
72116 has the Highest Percentage of Population Employed in Arts, Entertainment & Recreation in North Little Rock, AR with 2.6%.
What is the Percentage of Population Employed in Arts, Entertainment & Recreation in North Little Rock, AR?
Percentage of Population Employed in Arts, Entertainment & Recreation in North Little Rock is 1.8%.
What is the Percentage of Population Employed in Arts, Entertainment & Recreation in Arkansas?
Percentage of Population Employed in Arts, Entertainment & Recreation in Arkansas is 1.3%.
What is the Percentage of Population Employed in Arts, Entertainment & Recreation in the United States?
Percentage of Population Employed in Arts, Entertainment & Recreation in the United States is 2.1%.