Zip Codes with the Highest Percentage of Renter-Occupied Units in North Little Rock, AR
RELATED REPORTS & OPTIONS
Highest Renter-Occupied
North Little Rock
Compare Zip Codes
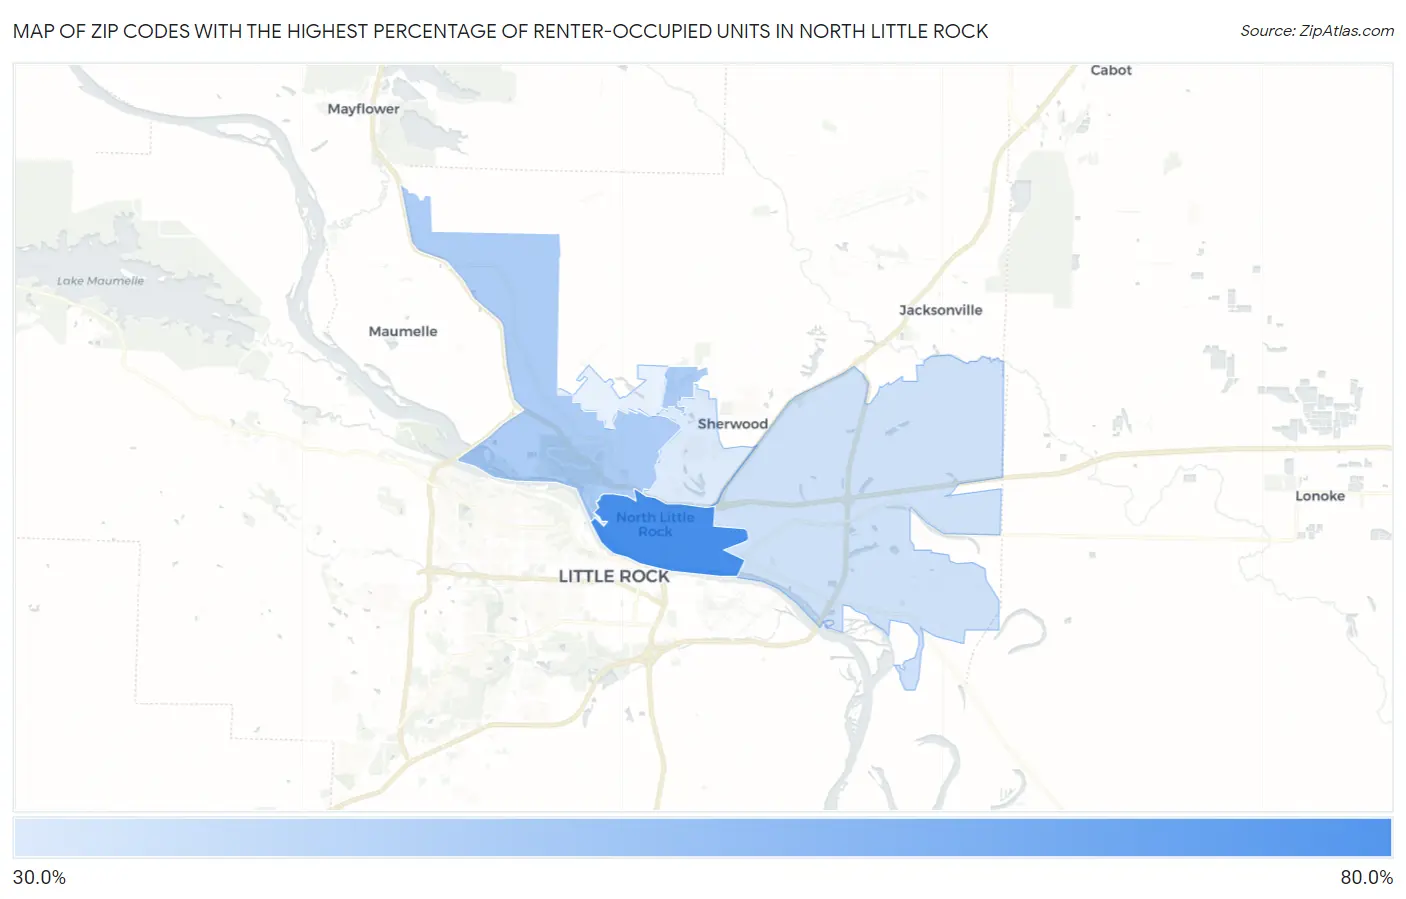
Map of Zip Codes with the Highest Percentage of Renter-Occupied Units in North Little Rock
0.0%
80.0%
Zip Codes with the Highest Percentage of Renter-Occupied Units in North Little Rock, AR
| Zip Code | % Renter-Occupied | vs State | vs National | |
| 1. | 72114 | 70.7% | 33.8%(+37.0)#12 | 35.2%(+35.5)#1,027 |
| 2. | 72118 | 45.1% | 33.8%(+11.3)#55 | 35.2%(+9.93)#4,031 |
| 3. | 72117 | 37.5% | 33.8%(+3.77)#98 | 35.2%(+2.36)#6,250 |
| 4. | 72116 | 34.4% | 33.8%(+0.635)#133 | 35.2%(-0.774)#7,658 |
1
Common Questions
What are the Top 3 Zip Codes with the Highest Percentage of Renter-Occupied Units in North Little Rock, AR?
Top 3 Zip Codes with the Highest Percentage of Renter-Occupied Units in North Little Rock, AR are:
What zip code has the Highest Percentage of Renter-Occupied Units in North Little Rock, AR?
72114 has the Highest Percentage of Renter-Occupied Units in North Little Rock, AR with 70.7%.
What is the Percentage of Renter-Occupied Units in North Little Rock, AR?
Percentage of Renter-Occupied Units in North Little Rock is 52.4%.
What is the Percentage of Renter-Occupied Units in Arkansas?
Percentage of Renter-Occupied Units in Arkansas is 33.8%.
What is the Percentage of Renter-Occupied Units in the United States?
Percentage of Renter-Occupied Units in the United States is 35.2%.