Heber Springs, AR Map & Demographics
Heber Springs Map
Heber Springs Overview
$30,995
PER CAPITA INCOME
$58,442
AVG FAMILY INCOME
$50,472
AVG HOUSEHOLD INCOME
43.5%
WAGE / INCOME GAP [ % ]
56.5¢/ $1
WAGE / INCOME GAP [ $ ]
0.45
INEQUALITY / GINI INDEX
7,066
TOTAL POPULATION
3,698
MALE POPULATION
3,368
FEMALE POPULATION
109.80
MALES / 100 FEMALES
91.08
FEMALES / 100 MALES
43.1
MEDIAN AGE
2.9
AVG FAMILY SIZE
2.2
AVG HOUSEHOLD SIZE
2,972
LABOR FORCE [ PEOPLE ]
49.8%
PERCENT IN LABOR FORCE
5.6%
UNEMPLOYMENT RATE
Heber Springs Zip Codes
Heber Springs Area Codes
Income in Heber Springs
Income Overview in Heber Springs
Per Capita Income in Heber Springs is $30,995, while median incomes of families and households are $58,442 and $50,472 respectively.
| Characteristic | Number | Measure |
| Per Capita Income | 7,066 | $30,995 |
| Median Family Income | 1,827 | $58,442 |
| Mean Family Income | 1,827 | $64,855 |
| Median Household Income | 3,084 | $50,472 |
| Mean Household Income | 3,084 | $68,272 |
| Income Deficit | 1,827 | $0 |
| Wage / Income Gap (%) | 7,066 | 43.46% |
| Wage / Income Gap ($) | 7,066 | 56.54¢ per $1 |
| Gini / Inequality Index | 7,066 | 0.45 |
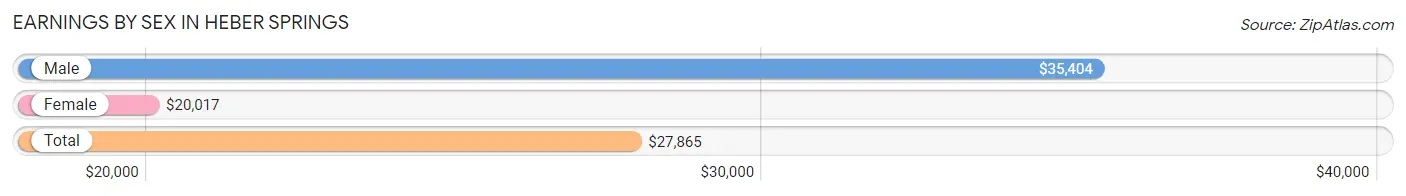
Earnings by Sex in Heber Springs
Average Earnings in Heber Springs are $27,865, $35,404 for men and $20,017 for women, a difference of 43.5%.
| Sex | Number | Average Earnings |
| Male | 1,746 (55.2%) | $35,404 |
| Female | 1,416 (44.8%) | $20,017 |
| Total | 3,162 (100.0%) | $27,865 |
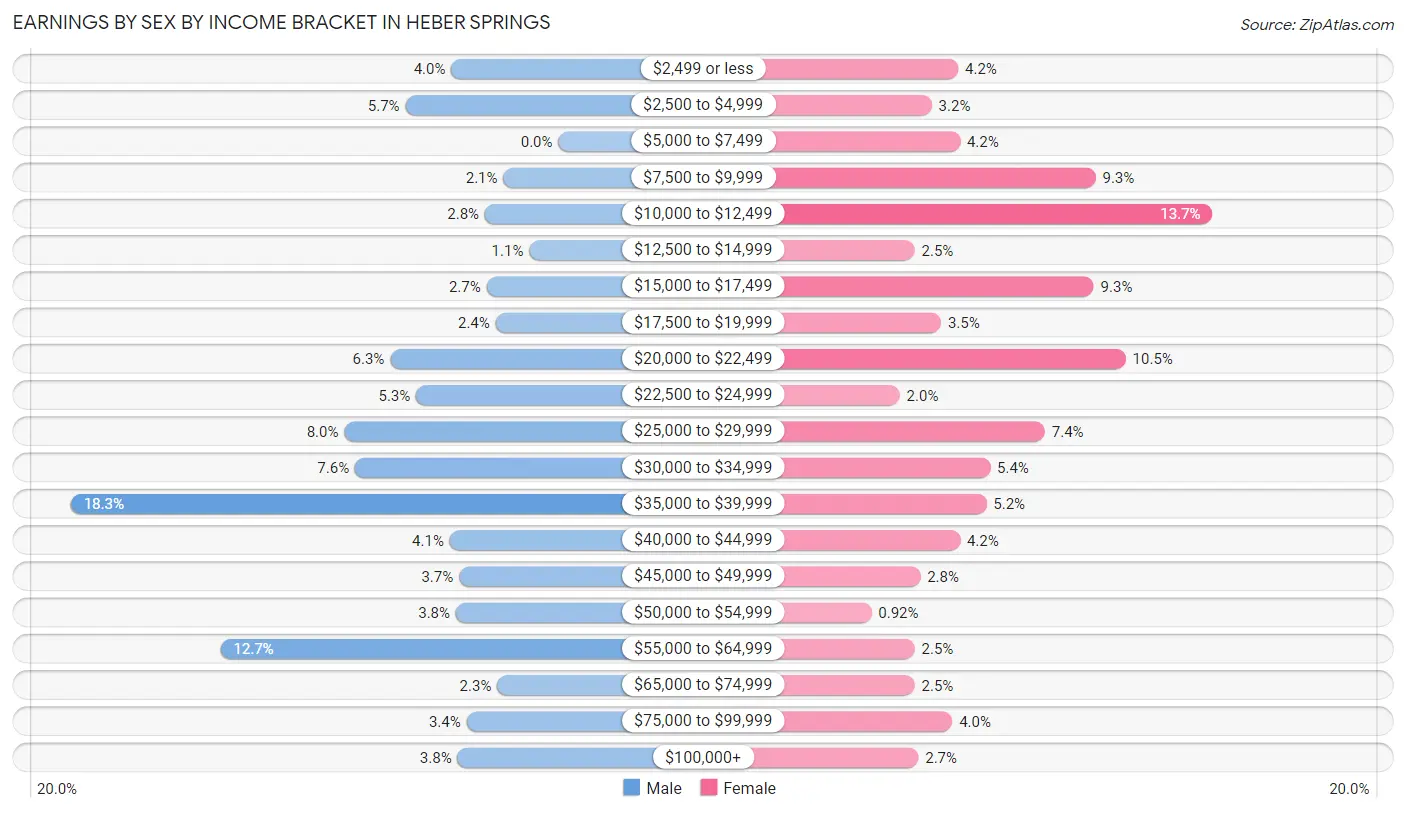
Earnings by Sex by Income Bracket in Heber Springs
The most common earnings brackets in Heber Springs are $35,000 to $39,999 for men (319 | 18.3%) and $10,000 to $12,499 for women (194 | 13.7%).
| Income | Male | Female |
| $2,499 or less | 70 (4.0%) | 59 (4.2%) |
| $2,500 to $4,999 | 100 (5.7%) | 45 (3.2%) |
| $5,000 to $7,499 | 0 (0.0%) | 60 (4.2%) |
| $7,500 to $9,999 | 36 (2.1%) | 132 (9.3%) |
| $10,000 to $12,499 | 48 (2.8%) | 194 (13.7%) |
| $12,500 to $14,999 | 19 (1.1%) | 36 (2.5%) |
| $15,000 to $17,499 | 47 (2.7%) | 131 (9.2%) |
| $17,500 to $19,999 | 41 (2.4%) | 50 (3.5%) |
| $20,000 to $22,499 | 110 (6.3%) | 148 (10.4%) |
| $22,500 to $24,999 | 93 (5.3%) | 28 (2.0%) |
| $25,000 to $29,999 | 140 (8.0%) | 105 (7.4%) |
| $30,000 to $34,999 | 133 (7.6%) | 76 (5.4%) |
| $35,000 to $39,999 | 319 (18.3%) | 74 (5.2%) |
| $40,000 to $44,999 | 71 (4.1%) | 60 (4.2%) |
| $45,000 to $49,999 | 65 (3.7%) | 39 (2.8%) |
| $50,000 to $54,999 | 67 (3.8%) | 13 (0.9%) |
| $55,000 to $64,999 | 221 (12.7%) | 36 (2.5%) |
| $65,000 to $74,999 | 40 (2.3%) | 36 (2.5%) |
| $75,000 to $99,999 | 60 (3.4%) | 56 (4.0%) |
| $100,000+ | 66 (3.8%) | 38 (2.7%) |
| Total | 1,746 (100.0%) | 1,416 (100.0%) |
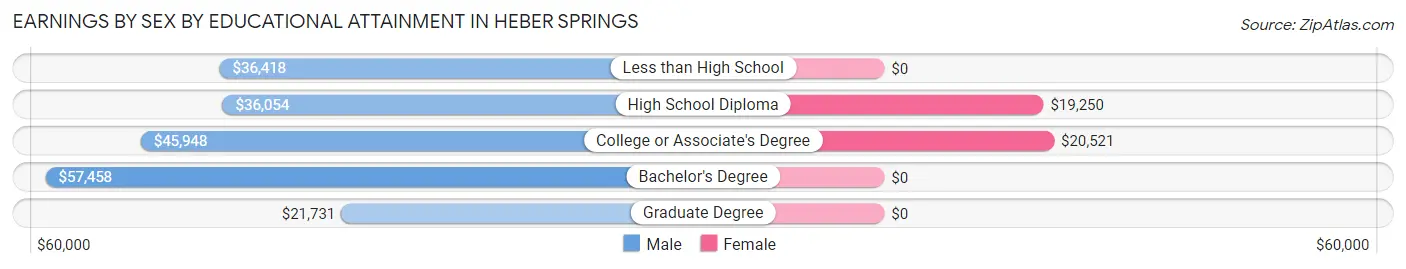
Earnings by Sex by Educational Attainment in Heber Springs
Average earnings in Heber Springs are $36,928 for men and $20,350 for women, a difference of 44.9%. Men with an educational attainment of bachelor's degree enjoy the highest average annual earnings of $57,458, while those with graduate degree education earn the least with $21,731. Women with an educational attainment of college or associate's degree earn the most with the average annual earnings of $20,521, while those with high school diploma education have the smallest earnings of $19,250.
| Educational Attainment | Male Income | Female Income |
| Less than High School | $36,418 | $0 |
| High School Diploma | $36,054 | $19,250 |
| College or Associate's Degree | $45,948 | $20,521 |
| Bachelor's Degree | $57,458 | $0 |
| Graduate Degree | $21,731 | $0 |
| Total | $36,928 | $20,350 |
Family Income in Heber Springs
Family Income Brackets in Heber Springs
According to the Heber Springs family income data, there are 479 families falling into the $50,000 to $74,999 income range, which is the most common income bracket and makes up 26.2% of all families. Conversely, the less than $10,000 income bracket is the least frequent group with only 26 families (1.4%) belonging to this category.
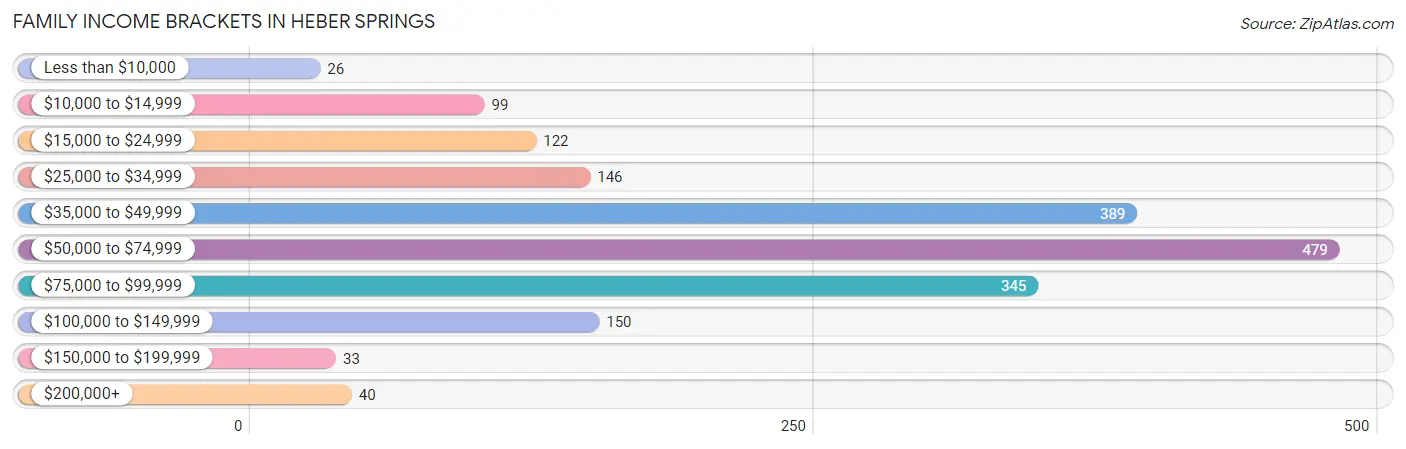
| Income Bracket | # Families | % Families |
| Less than $10,000 | 26 | 1.4% |
| $10,000 to $14,999 | 99 | 5.4% |
| $15,000 to $24,999 | 122 | 6.7% |
| $25,000 to $34,999 | 146 | 8.0% |
| $35,000 to $49,999 | 389 | 21.3% |
| $50,000 to $74,999 | 479 | 26.2% |
| $75,000 to $99,999 | 345 | 18.9% |
| $100,000 to $149,999 | 150 | 8.2% |
| $150,000 to $199,999 | 33 | 1.8% |
| $200,000+ | 40 | 2.2% |
Family Income by Famaliy Size in Heber Springs
4-person families (285 | 15.6%) account for the highest median family income in Heber Springs with $61,090 per family, while 2-person families (993 | 54.3%) have the highest median income of $27,996 per family member.
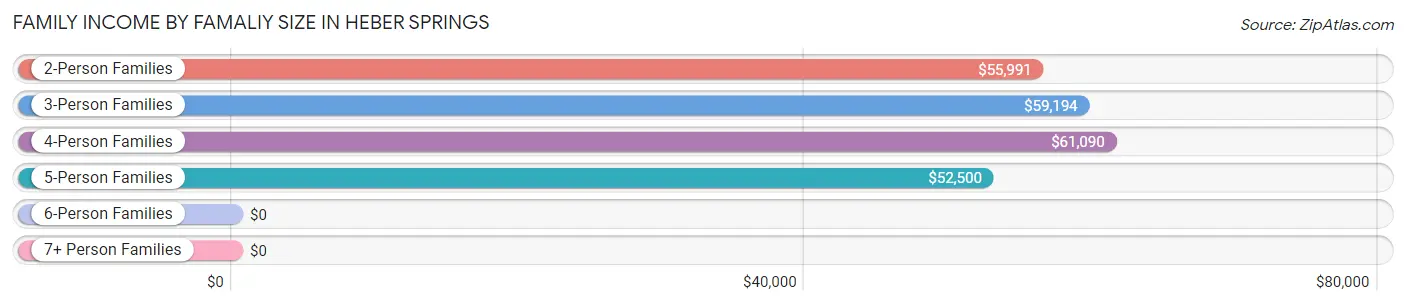
| Income Bracket | # Families | Median Income |
| 2-Person Families | 993 (54.3%) | $55,991 |
| 3-Person Families | 386 (21.1%) | $59,194 |
| 4-Person Families | 285 (15.6%) | $61,090 |
| 5-Person Families | 160 (8.8%) | $52,500 |
| 6-Person Families | 3 (0.2%) | $0 |
| 7+ Person Families | 0 (0.0%) | $0 |
| Total | 1,827 (100.0%) | $58,442 |
Family Income by Number of Earners in Heber Springs
The median family income in Heber Springs is $58,442, with families comprising 3+ earners (95) having the highest median family income of $87,250, while families with no earners (477) have the lowest median family income of $41,815, accounting for 5.2% and 26.1% of families, respectively.
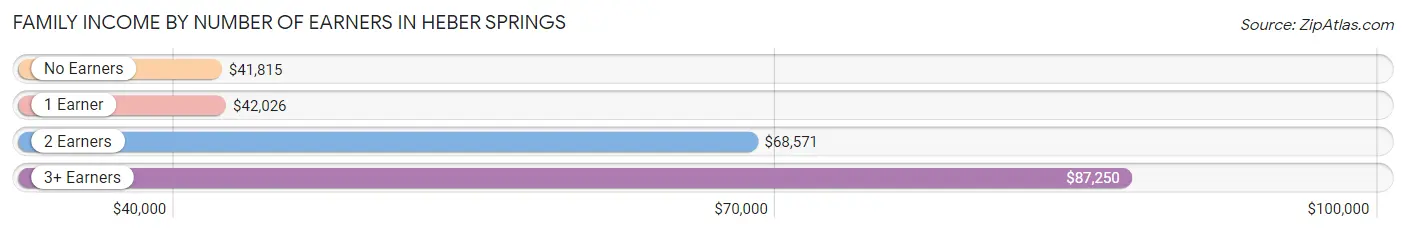
| Number of Earners | # Families | Median Income |
| No Earners | 477 (26.1%) | $41,815 |
| 1 Earner | 557 (30.5%) | $42,026 |
| 2 Earners | 698 (38.2%) | $68,571 |
| 3+ Earners | 95 (5.2%) | $87,250 |
| Total | 1,827 (100.0%) | $58,442 |
Household Income in Heber Springs
Household Income Brackets in Heber Springs
With 734 households falling in the category, the $50,000 to $74,999 income range is the most frequent in Heber Springs, accounting for 23.8% of all households. In contrast, only 31 households (1.0%) fall into the $150,000 to $199,999 income bracket, making it the least populous group.
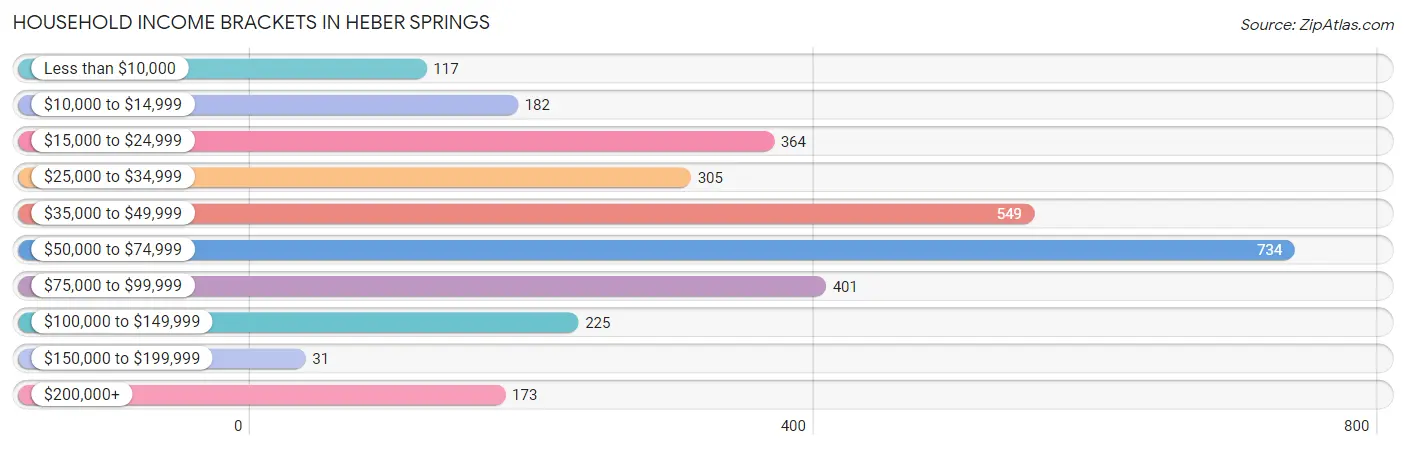
| Income Bracket | # Households | % Households |
| Less than $10,000 | 117 | 3.8% |
| $10,000 to $14,999 | 182 | 5.9% |
| $15,000 to $24,999 | 364 | 11.8% |
| $25,000 to $34,999 | 305 | 9.9% |
| $35,000 to $49,999 | 549 | 17.8% |
| $50,000 to $74,999 | 734 | 23.8% |
| $75,000 to $99,999 | 401 | 13.0% |
| $100,000 to $149,999 | 225 | 7.3% |
| $150,000 to $199,999 | 31 | 1.0% |
| $200,000+ | 173 | 5.6% |
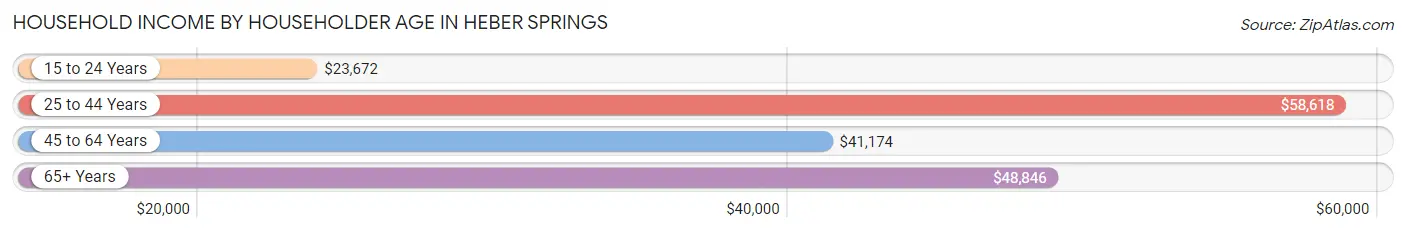
Household Income by Householder Age in Heber Springs
The median household income in Heber Springs is $50,472, with the highest median household income of $58,618 found in the 25 to 44 years age bracket for the primary householder. A total of 877 households (28.4%) fall into this category. Meanwhile, the 15 to 24 years age bracket for the primary householder has the lowest median household income of $23,672, with 58 households (1.9%) in this group.
| Income Bracket | # Households | Median Income |
| 15 to 24 Years | 58 (1.9%) | $23,672 |
| 25 to 44 Years | 877 (28.4%) | $58,618 |
| 45 to 64 Years | 1,129 (36.6%) | $41,174 |
| 65+ Years | 1,020 (33.1%) | $48,846 |
| Total | 3,084 (100.0%) | $50,472 |
Poverty in Heber Springs
Income Below Poverty by Sex and Age in Heber Springs
With 15.9% poverty level for males and 9.9% for females among the residents of Heber Springs, 45 to 54 year old males and 6 to 11 year old females are the most vulnerable to poverty, with 83 males (31.1%) and 51 females (32.3%) in their respective age groups living below the poverty level.
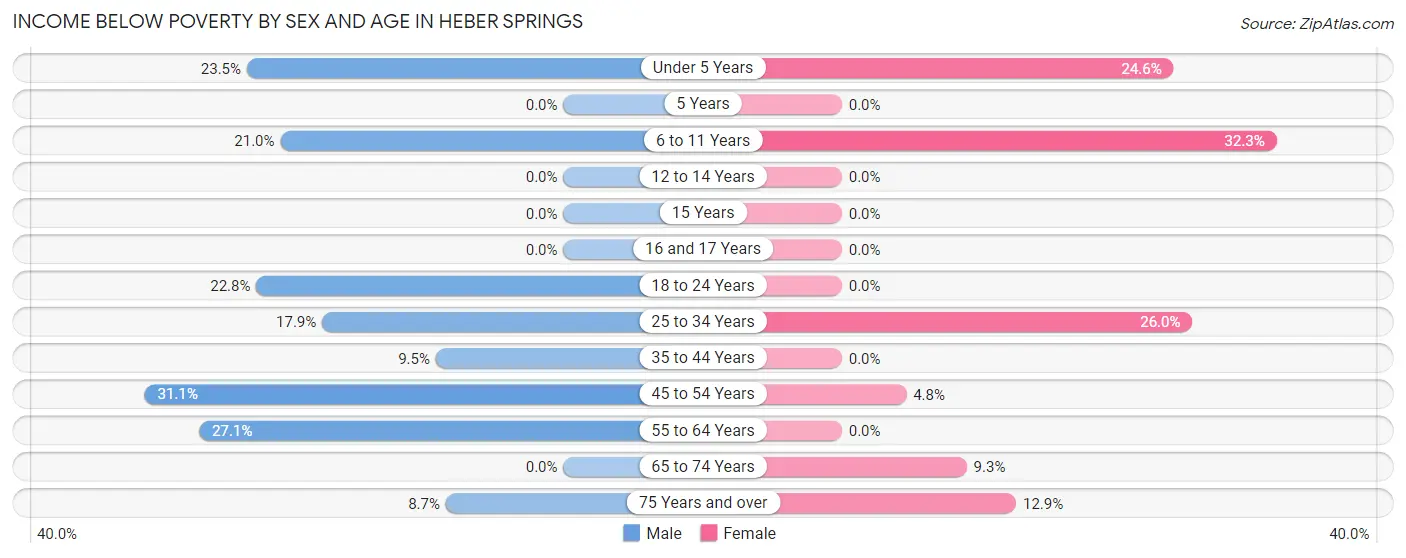
| Age Bracket | Male | Female |
| Under 5 Years | 55 (23.5%) | 33 (24.6%) |
| 5 Years | 0 (0.0%) | 0 (0.0%) |
| 6 to 11 Years | 58 (21.0%) | 51 (32.3%) |
| 12 to 14 Years | 0 (0.0%) | 0 (0.0%) |
| 15 Years | 0 (0.0%) | 0 (0.0%) |
| 16 and 17 Years | 0 (0.0%) | 0 (0.0%) |
| 18 to 24 Years | 70 (22.8%) | 0 (0.0%) |
| 25 to 34 Years | 108 (17.9%) | 108 (26.0%) |
| 35 to 44 Years | 46 (9.5%) | 0 (0.0%) |
| 45 to 54 Years | 83 (31.1%) | 17 (4.8%) |
| 55 to 64 Years | 119 (27.1%) | 0 (0.0%) |
| 65 to 74 Years | 0 (0.0%) | 28 (9.3%) |
| 75 Years and over | 29 (8.7%) | 77 (12.9%) |
| Total | 568 (15.9%) | 314 (9.9%) |
Income Above Poverty by Sex and Age in Heber Springs
According to the poverty statistics in Heber Springs, males aged 5 years and females aged 5 years are the age groups that are most secure financially, with 100.0% of males and 100.0% of females in these age groups living above the poverty line.
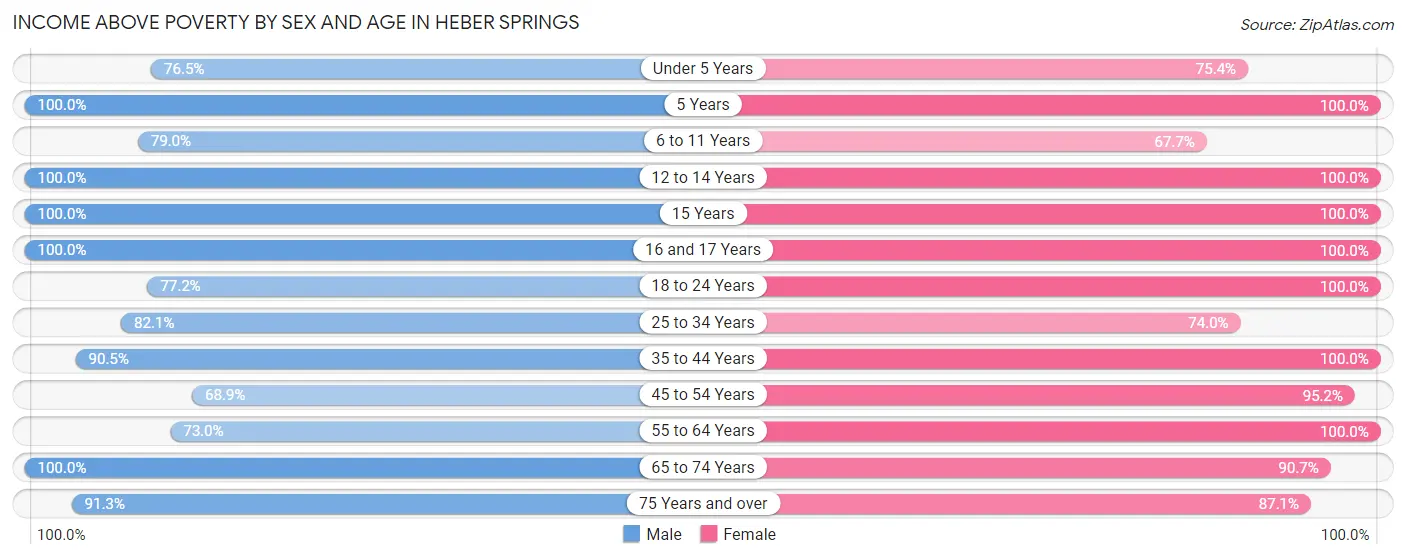
| Age Bracket | Male | Female |
| Under 5 Years | 179 (76.5%) | 101 (75.4%) |
| 5 Years | 42 (100.0%) | 53 (100.0%) |
| 6 to 11 Years | 218 (79.0%) | 107 (67.7%) |
| 12 to 14 Years | 92 (100.0%) | 20 (100.0%) |
| 15 Years | 55 (100.0%) | 26 (100.0%) |
| 16 and 17 Years | 170 (100.0%) | 29 (100.0%) |
| 18 to 24 Years | 237 (77.2%) | 258 (100.0%) |
| 25 to 34 Years | 495 (82.1%) | 307 (74.0%) |
| 35 to 44 Years | 440 (90.5%) | 296 (100.0%) |
| 45 to 54 Years | 184 (68.9%) | 339 (95.2%) |
| 55 to 64 Years | 321 (73.0%) | 544 (100.0%) |
| 65 to 74 Years | 264 (100.0%) | 274 (90.7%) |
| 75 Years and over | 303 (91.3%) | 518 (87.1%) |
| Total | 3,000 (84.1%) | 2,872 (90.1%) |
Income Below Poverty Among Married-Couple Families in Heber Springs
The poverty statistics for married-couple families in Heber Springs show that 6.5% or 90 of the total 1,378 families live below the poverty line. Families with 3 or 4 children have the highest poverty rate of 44.5%, comprising of 61 families. On the other hand, families with 1 or 2 children have the lowest poverty rate of 0.0%, which includes 0 families.
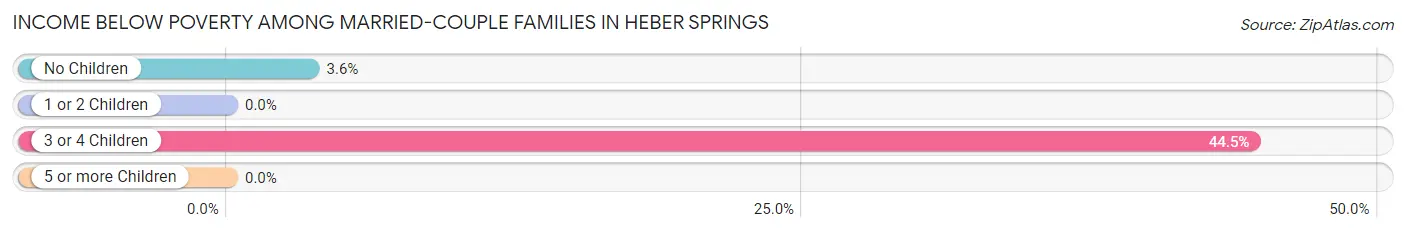
| Children | Above Poverty | Below Poverty |
| No Children | 788 (96.5%) | 29 (3.5%) |
| 1 or 2 Children | 424 (100.0%) | 0 (0.0%) |
| 3 or 4 Children | 76 (55.5%) | 61 (44.5%) |
| 5 or more Children | 0 (0.0%) | 0 (0.0%) |
| Total | 1,288 (93.5%) | 90 (6.5%) |
Income Below Poverty Among Single-Parent Households in Heber Springs
According to the poverty data in Heber Springs, 37.8% or 91 single-father households and 12.0% or 25 single-mother households are living below the poverty line. Among single-father households, those with no children have the highest poverty rate, with 91 households (49.2%) experiencing poverty. Likewise, among single-mother households, those with 3 or 4 children have the highest poverty rate, with 12 households (100.0%) falling below the poverty line.
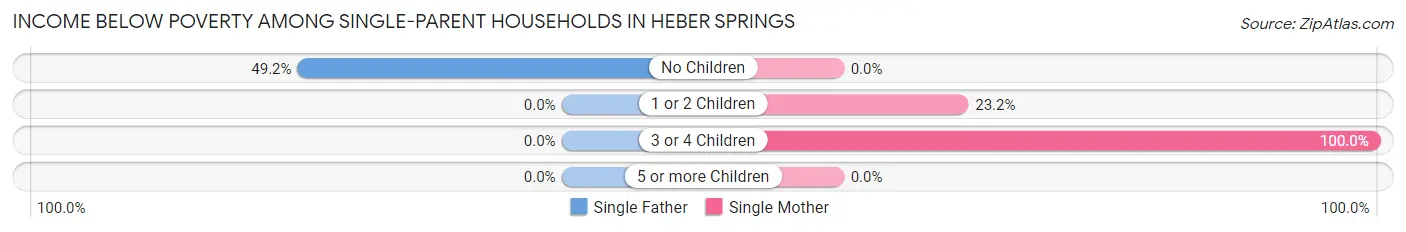
| Children | Single Father | Single Mother |
| No Children | 91 (49.2%) | 0 (0.0%) |
| 1 or 2 Children | 0 (0.0%) | 13 (23.2%) |
| 3 or 4 Children | 0 (0.0%) | 12 (100.0%) |
| 5 or more Children | 0 (0.0%) | 0 (0.0%) |
| Total | 91 (37.8%) | 25 (12.0%) |
Income Below Poverty Among Married-Couple vs Single-Parent Households in Heber Springs
The poverty data for Heber Springs shows that 90 of the married-couple family households (6.5%) and 116 of the single-parent households (25.8%) are living below the poverty level. Within the married-couple family households, those with 3 or 4 children have the highest poverty rate, with 61 households (44.5%) falling below the poverty line. Among the single-parent households, those with 3 or 4 children have the highest poverty rate, with 12 household (30.0%) living below poverty.
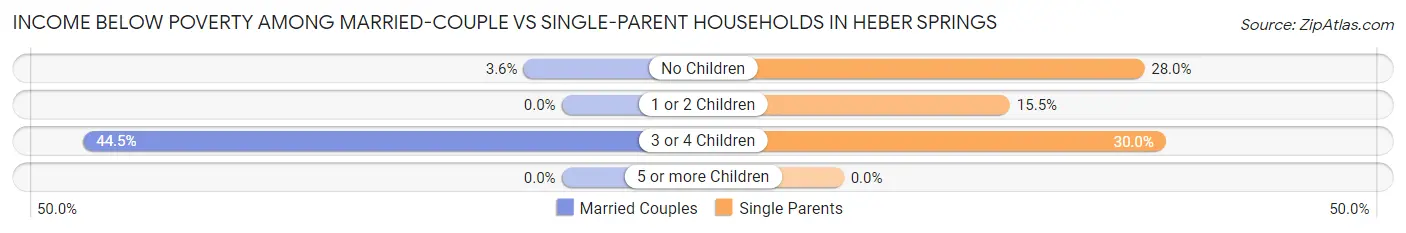
| Children | Married-Couple Families | Single-Parent Households |
| No Children | 29 (3.5%) | 91 (28.0%) |
| 1 or 2 Children | 0 (0.0%) | 13 (15.5%) |
| 3 or 4 Children | 61 (44.5%) | 12 (30.0%) |
| 5 or more Children | 0 (0.0%) | 0 (0.0%) |
| Total | 90 (6.5%) | 116 (25.8%) |
Race in Heber Springs
The most populous races in Heber Springs are White / Caucasian (6,736 | 95.3%), Two or more Races (229 | 3.2%), and Hispanic or Latino (204 | 2.9%).
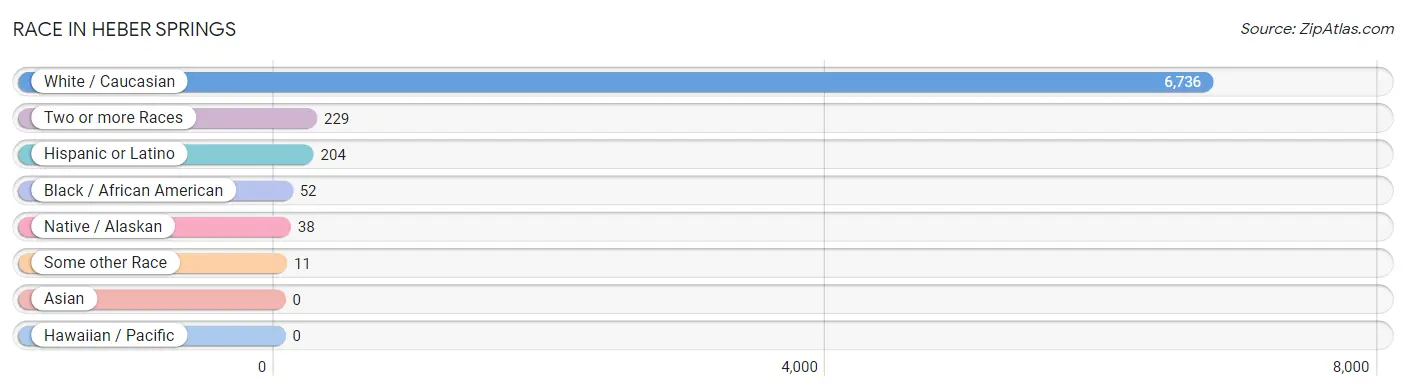
| Race | # Population | % Population |
| Asian | 0 | 0.0% |
| Black / African American | 52 | 0.7% |
| Hawaiian / Pacific | 0 | 0.0% |
| Hispanic or Latino | 204 | 2.9% |
| Native / Alaskan | 38 | 0.5% |
| White / Caucasian | 6,736 | 95.3% |
| Two or more Races | 229 | 3.2% |
| Some other Race | 11 | 0.2% |
| Total | 7,066 | 100.0% |
Ancestry in Heber Springs
The most populous ancestries reported in Heber Springs are English (1,572 | 22.3%), Irish (1,108 | 15.7%), German (972 | 13.8%), American (440 | 6.2%), and Scottish (228 | 3.2%), together accounting for 61.1% of all Heber Springs residents.
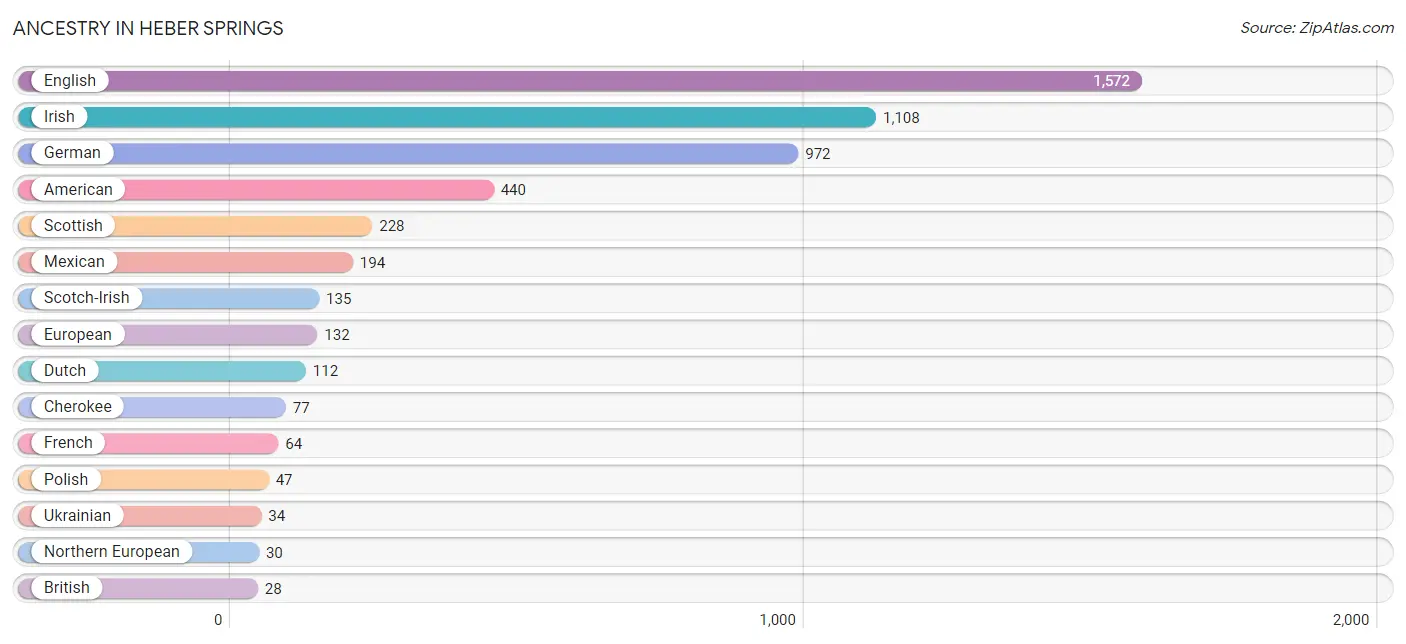
| Ancestry | # Population | % Population |
| American | 440 | 6.2% |
| Apache | 10 | 0.1% |
| British | 28 | 0.4% |
| Cherokee | 77 | 1.1% |
| Choctaw | 22 | 0.3% |
| Czech | 15 | 0.2% |
| Dutch | 112 | 1.6% |
| English | 1,572 | 22.3% |
| European | 132 | 1.9% |
| French | 64 | 0.9% |
| French Canadian | 8 | 0.1% |
| German | 972 | 13.8% |
| Irish | 1,108 | 15.7% |
| Italian | 27 | 0.4% |
| Mexican | 194 | 2.8% |
| Navajo | 14 | 0.2% |
| Northern European | 30 | 0.4% |
| Norwegian | 12 | 0.2% |
| Polish | 47 | 0.7% |
| Puerto Rican | 10 | 0.1% |
| Scandinavian | 7 | 0.1% |
| Scotch-Irish | 135 | 1.9% |
| Scottish | 228 | 3.2% |
| Swedish | 20 | 0.3% |
| Ukrainian | 34 | 0.5% |
| Welsh | 27 | 0.4% | View All 26 Rows |
Immigrants in Heber Springs
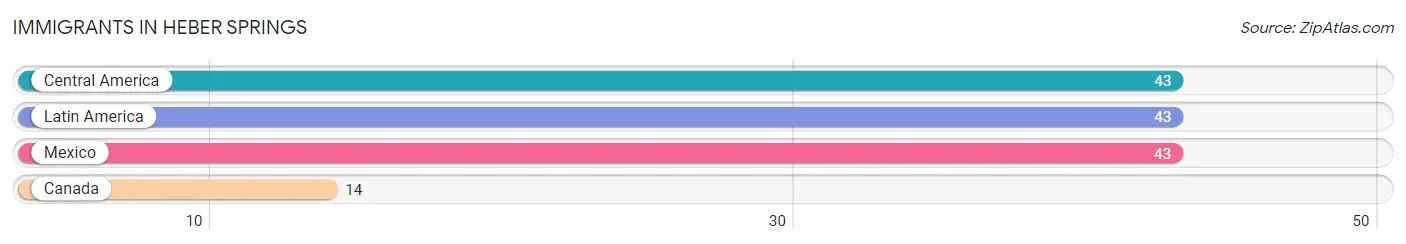
The most numerous immigrant groups reported in Heber Springs came from Central America (43 | 0.6%), Latin America (43 | 0.6%), Mexico (43 | 0.6%), and Canada (14 | 0.2%), together accounting for 2.0% of all Heber Springs residents.
| Immigration Origin | # Population | % Population |
| Canada | 14 | 0.2% |
| Central America | 43 | 0.6% |
| Latin America | 43 | 0.6% |
| Mexico | 43 | 0.6% | View All 4 Rows |
Sex and Age in Heber Springs
Sex and Age in Heber Springs
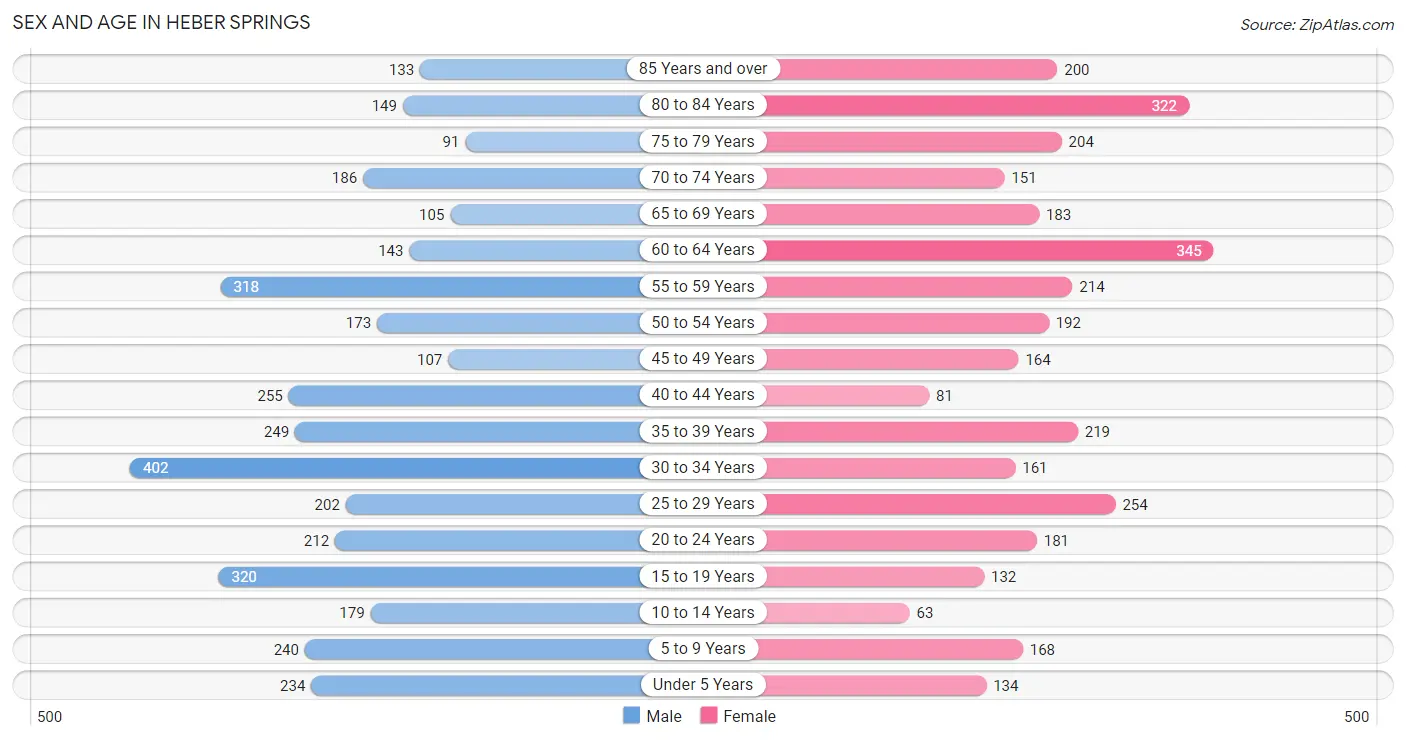
The most populous age groups in Heber Springs are 30 to 34 Years (402 | 10.9%) for men and 60 to 64 Years (345 | 10.2%) for women.
| Age Bracket | Male | Female |
| Under 5 Years | 234 (6.3%) | 134 (4.0%) |
| 5 to 9 Years | 240 (6.5%) | 168 (5.0%) |
| 10 to 14 Years | 179 (4.8%) | 63 (1.9%) |
| 15 to 19 Years | 320 (8.6%) | 132 (3.9%) |
| 20 to 24 Years | 212 (5.7%) | 181 (5.4%) |
| 25 to 29 Years | 202 (5.5%) | 254 (7.5%) |
| 30 to 34 Years | 402 (10.9%) | 161 (4.8%) |
| 35 to 39 Years | 249 (6.7%) | 219 (6.5%) |
| 40 to 44 Years | 255 (6.9%) | 81 (2.4%) |
| 45 to 49 Years | 107 (2.9%) | 164 (4.9%) |
| 50 to 54 Years | 173 (4.7%) | 192 (5.7%) |
| 55 to 59 Years | 318 (8.6%) | 214 (6.4%) |
| 60 to 64 Years | 143 (3.9%) | 345 (10.2%) |
| 65 to 69 Years | 105 (2.8%) | 183 (5.4%) |
| 70 to 74 Years | 186 (5.0%) | 151 (4.5%) |
| 75 to 79 Years | 91 (2.5%) | 204 (6.1%) |
| 80 to 84 Years | 149 (4.0%) | 322 (9.6%) |
| 85 Years and over | 133 (3.6%) | 200 (5.9%) |
| Total | 3,698 (100.0%) | 3,368 (100.0%) |
Families and Households in Heber Springs
Median Family Size in Heber Springs
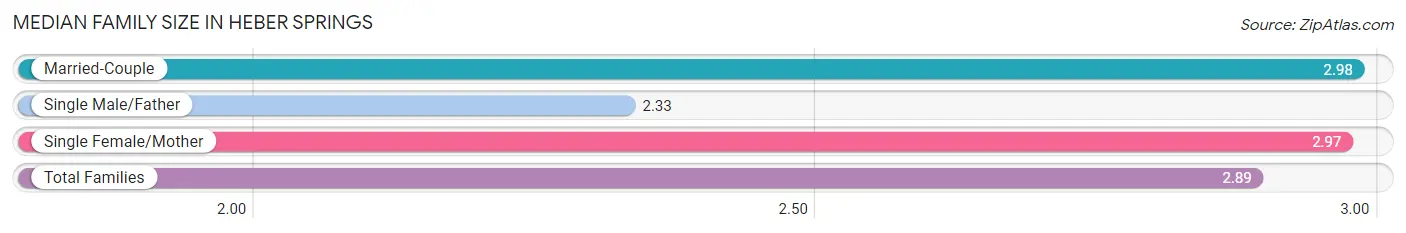
The median family size in Heber Springs is 2.89 persons per family, with married-couple families (1,378 | 75.4%) accounting for the largest median family size of 2.98 persons per family. On the other hand, single male/father families (241 | 13.2%) represent the smallest median family size with 2.33 persons per family.
| Family Type | # Families | Family Size |
| Married-Couple | 1,378 (75.4%) | 2.98 |
| Single Male/Father | 241 (13.2%) | 2.33 |
| Single Female/Mother | 208 (11.4%) | 2.97 |
| Total Families | 1,827 (100.0%) | 2.89 |
Median Household Size in Heber Springs
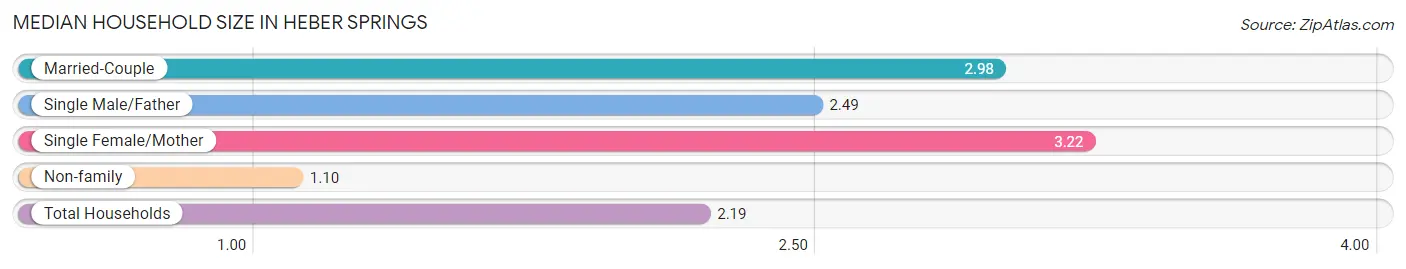
The median household size in Heber Springs is 2.19 persons per household, with single female/mother households (208 | 6.7%) accounting for the largest median household size of 3.22 persons per household. non-family households (1,257 | 40.8%) represent the smallest median household size with 1.10 persons per household.
| Household Type | # Households | Household Size |
| Married-Couple | 1,378 (44.7%) | 2.98 |
| Single Male/Father | 241 (7.8%) | 2.49 |
| Single Female/Mother | 208 (6.7%) | 3.22 |
| Non-family | 1,257 (40.8%) | 1.10 |
| Total Households | 3,084 (100.0%) | 2.19 |
Household Size by Marriage Status in Heber Springs
Out of a total of 3,084 households in Heber Springs, 1,827 (59.2%) are family households, while 1,257 (40.8%) are nonfamily households. The most numerous type of family households are 2-person households, comprising 966, and the most common type of nonfamily households are 1-person households, comprising 1,164.
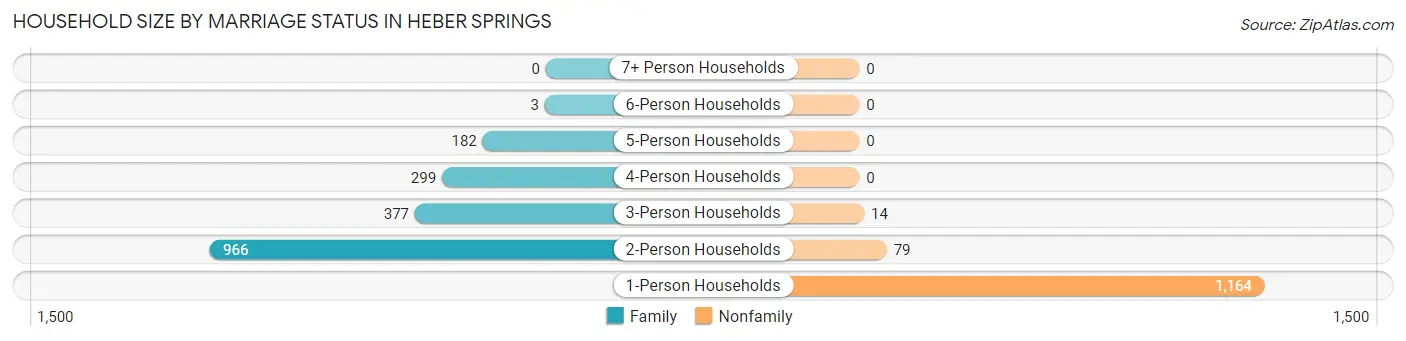
| Household Size | Family Households | Nonfamily Households |
| 1-Person Households | - | 1,164 (37.7%) |
| 2-Person Households | 966 (31.3%) | 79 (2.6%) |
| 3-Person Households | 377 (12.2%) | 14 (0.4%) |
| 4-Person Households | 299 (9.7%) | 0 (0.0%) |
| 5-Person Households | 182 (5.9%) | 0 (0.0%) |
| 6-Person Households | 3 (0.1%) | 0 (0.0%) |
| 7+ Person Households | 0 (0.0%) | 0 (0.0%) |
| Total | 1,827 (59.2%) | 1,257 (40.8%) |
Female Fertility in Heber Springs
Fertility by Age in Heber Springs
Average fertility rate in Heber Springs is 80.0 births per 1,000 women. Women in the age bracket of 20 to 34 years have the highest fertility rate with 159.0 births per 1,000 women. Women in the age bracket of 20 to 34 years acount for 100.0% of all women with births.
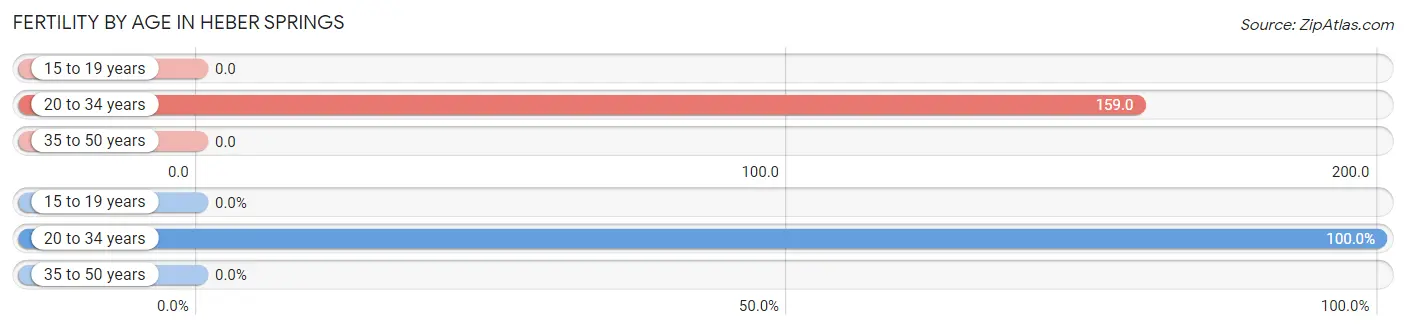
| Age Bracket | Women with Births | Births / 1,000 Women |
| 15 to 19 years | 0 (0.0%) | 0.0 |
| 20 to 34 years | 95 (100.0%) | 159.0 |
| 35 to 50 years | 0 (0.0%) | 0.0 |
| Total | 95 (100.0%) | 80.0 |
Fertility by Age by Marriage Status in Heber Springs
87.4% of women with births (95) in Heber Springs are married. The highest percentage of unmarried women with births falls into 20 to 34 years age bracket with 12.6% of them unmarried at the time of birth, while the lowest percentage of unmarried women with births belong to 20 to 34 years age bracket with 12.6% of them unmarried.
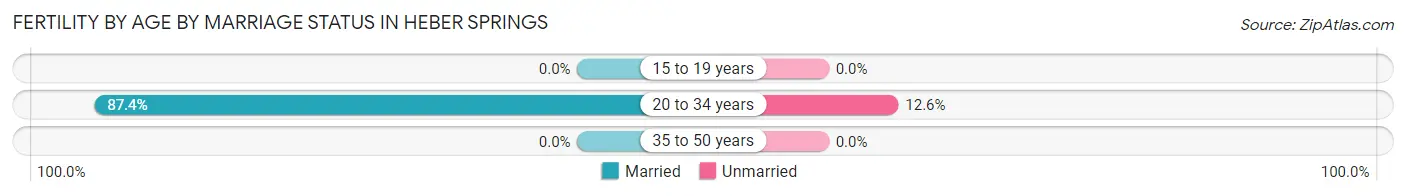
| Age Bracket | Married | Unmarried |
| 15 to 19 years | 0 (0.0%) | 0 (0.0%) |
| 20 to 34 years | 83 (87.4%) | 12 (12.6%) |
| 35 to 50 years | 0 (0.0%) | 0 (0.0%) |
| Total | 83 (87.4%) | 12 (12.6%) |
Fertility by Education in Heber Springs
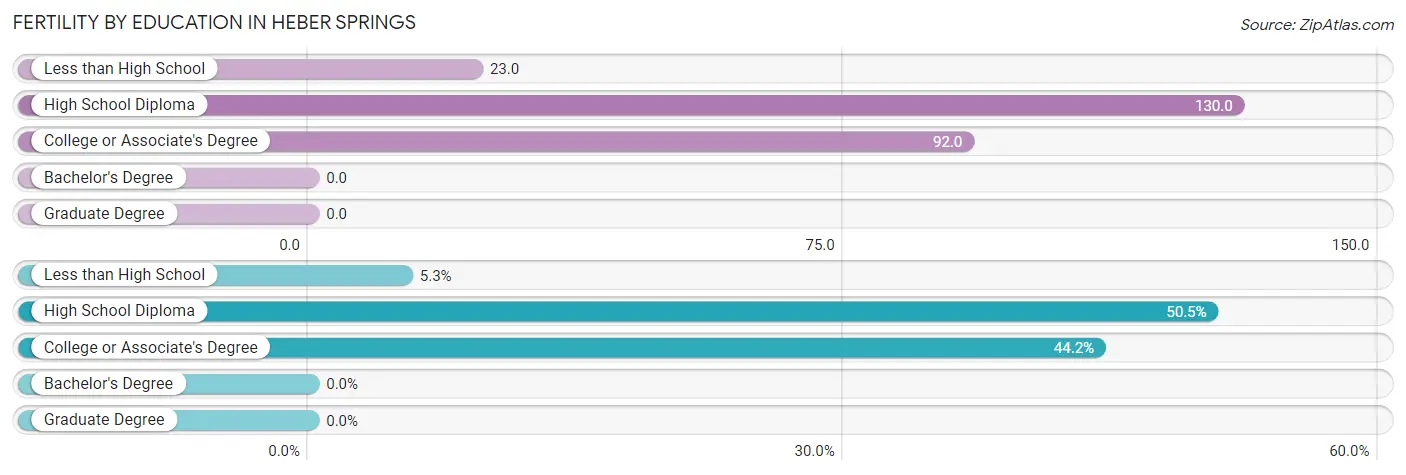
| Educational Attainment | Women with Births | Births / 1,000 Women |
| Less than High School | 5 (5.3%) | 23.0 |
| High School Diploma | 48 (50.5%) | 130.0 |
| College or Associate's Degree | 42 (44.2%) | 92.0 |
| Bachelor's Degree | 0 (0.0%) | 0.0 |
| Graduate Degree | 0 (0.0%) | 0.0 |
| Total | 95 (100.0%) | 80.0 |
Fertility by Education by Marriage Status in Heber Springs
12.6% of women with births in Heber Springs are unmarried. Women with the educational attainment of high school diploma are most likely to be married with 100.0% of them married at childbirth, while women with the educational attainment of less than high school are least likely to be married with 100.0% of them unmarried at childbirth.
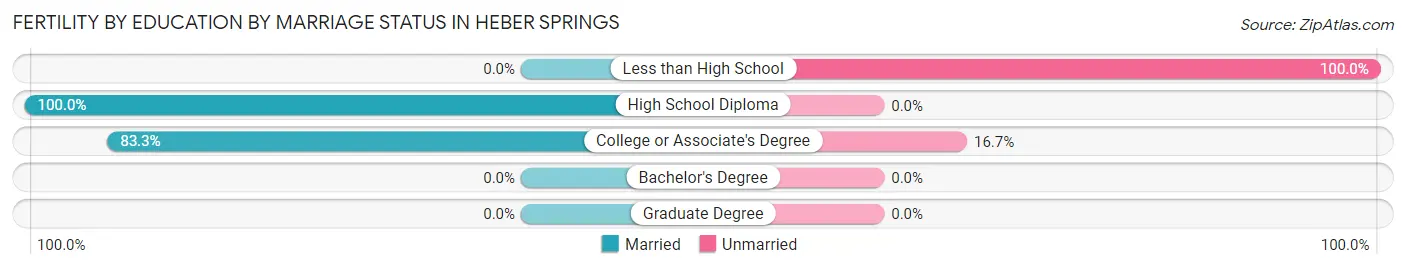
| Educational Attainment | Married | Unmarried |
| Less than High School | 0 (0.0%) | 5 (100.0%) |
| High School Diploma | 48 (100.0%) | 0 (0.0%) |
| College or Associate's Degree | 35 (83.3%) | 7 (16.7%) |
| Bachelor's Degree | 0 (0.0%) | 0 (0.0%) |
| Graduate Degree | 0 (0.0%) | 0 (0.0%) |
| Total | 83 (87.4%) | 12 (12.6%) |
Employment Characteristics in Heber Springs
Employment by Class of Employer in Heber Springs
Among the 2,803 employed individuals in Heber Springs, private company employees (2,241 | 79.9%), self-employed (not incorporated) (273 | 9.7%), and not-for-profit organizations (98 | 3.5%) make up the most common classes of employment.
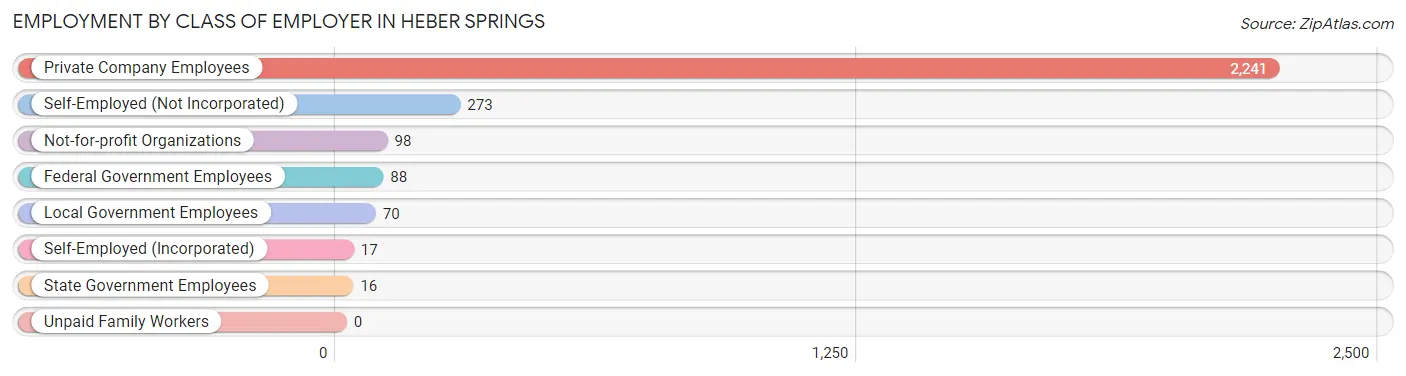
| Employer Class | # Employees | % Employees |
| Private Company Employees | 2,241 | 79.9% |
| Self-Employed (Incorporated) | 17 | 0.6% |
| Self-Employed (Not Incorporated) | 273 | 9.7% |
| Not-for-profit Organizations | 98 | 3.5% |
| Local Government Employees | 70 | 2.5% |
| State Government Employees | 16 | 0.6% |
| Federal Government Employees | 88 | 3.1% |
| Unpaid Family Workers | 0 | 0.0% |
| Total | 2,803 | 100.0% |
Employment Status by Age in Heber Springs
According to the labor force statistics for Heber Springs, out of the total population over 16 years of age (5,967), 49.8% or 2,972 individuals are in the labor force, with 5.6% or 166 of them unemployed. The age group with the highest labor force participation rate is 20 to 24 years, with 94.7% or 372 individuals in the labor force. Within the labor force, the 20 to 24 years age range has the highest percentage of unemployed individuals, with 23.9% or 89 of them being unemployed.
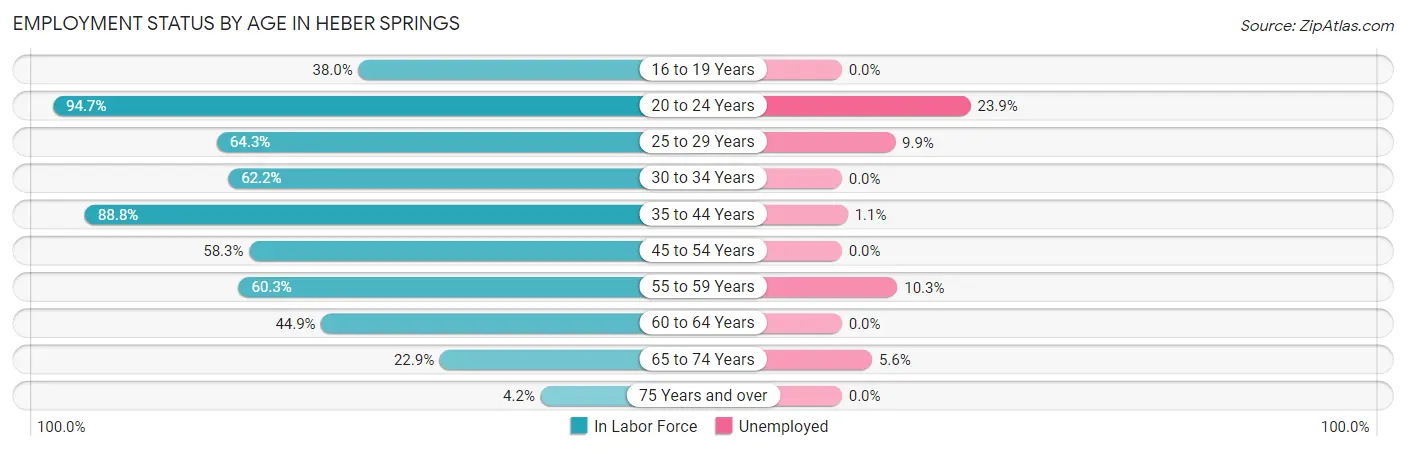
| Age Bracket | In Labor Force | Unemployed |
| 16 to 19 Years | 141 (38.0%) | 0 (0.0%) |
| 20 to 24 Years | 372 (94.7%) | 89 (23.9%) |
| 25 to 29 Years | 293 (64.3%) | 29 (9.9%) |
| 30 to 34 Years | 350 (62.2%) | 0 (0.0%) |
| 35 to 44 Years | 714 (88.8%) | 8 (1.1%) |
| 45 to 54 Years | 371 (58.3%) | 0 (0.0%) |
| 55 to 59 Years | 321 (60.3%) | 33 (10.3%) |
| 60 to 64 Years | 219 (44.9%) | 0 (0.0%) |
| 65 to 74 Years | 143 (22.9%) | 8 (5.6%) |
| 75 Years and over | 46 (4.2%) | 0 (0.0%) |
| Total | 2,972 (49.8%) | 166 (5.6%) |
Employment Status by Educational Attainment in Heber Springs
According to labor force statistics for Heber Springs, 65.2% of individuals (2,268) out of the total population between 25 and 64 years of age (3,479) are in the labor force, with 3.1% or 70 of them being unemployed. The group with the highest labor force participation rate are those with the educational attainment of college / associate degree, with 81.8% or 894 individuals in the labor force. Within the labor force, individuals with bachelor's degree or higher education have the highest percentage of unemployment, with 5.7% or 15 of them being unemployed.
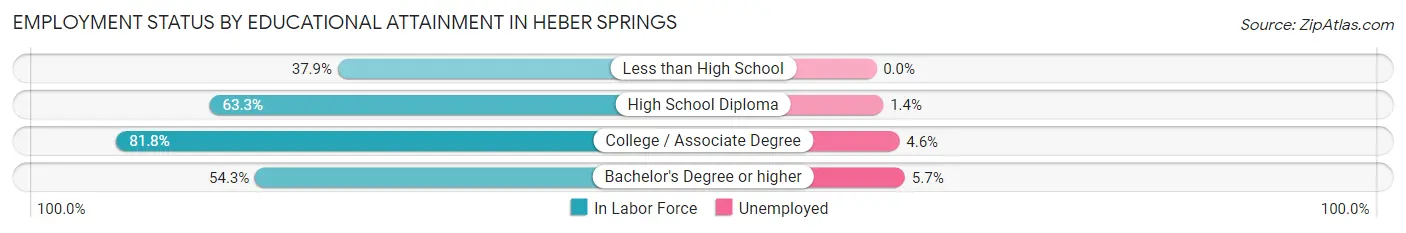
| Educational Attainment | In Labor Force | Unemployed |
| Less than High School | 138 (37.9%) | 0 (0.0%) |
| High School Diploma | 971 (63.3%) | 21 (1.4%) |
| College / Associate Degree | 894 (81.8%) | 50 (4.6%) |
| Bachelor's Degree or higher | 265 (54.3%) | 28 (5.7%) |
| Total | 2,268 (65.2%) | 108 (3.1%) |
Employment Occupations by Sex in Heber Springs
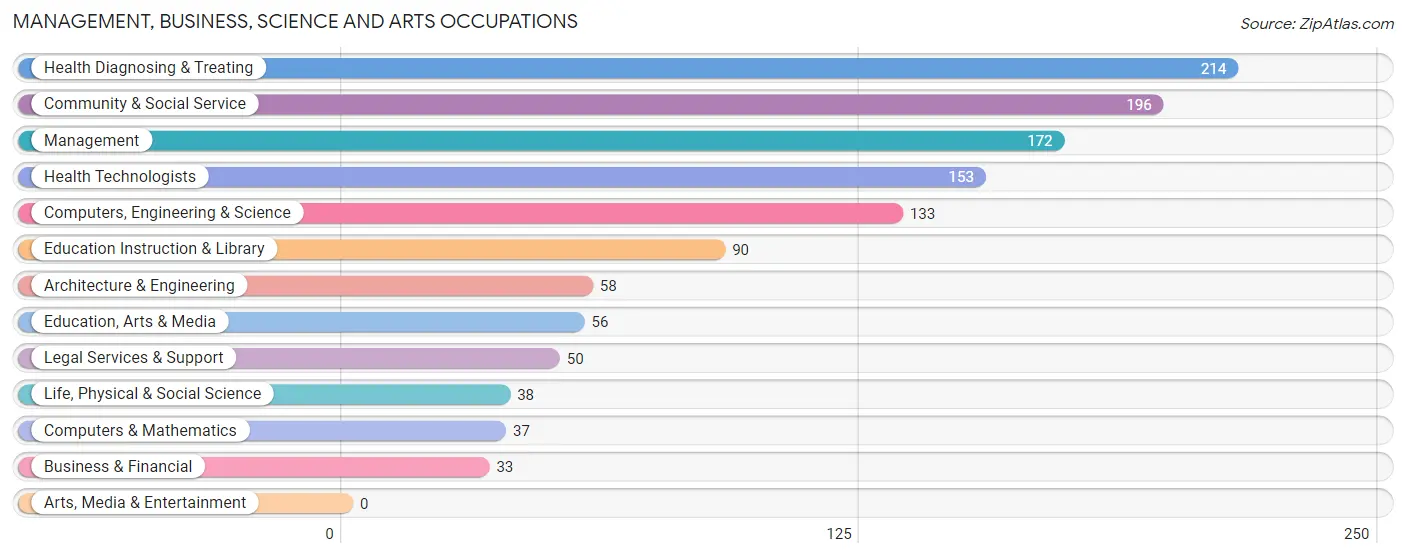
Management, Business, Science and Arts Occupations
The most common Management, Business, Science and Arts occupations in Heber Springs are Health Diagnosing & Treating (214 | 7.6%), Community & Social Service (196 | 7.0%), Management (172 | 6.1%), Health Technologists (153 | 5.5%), and Computers, Engineering & Science (133 | 4.7%).
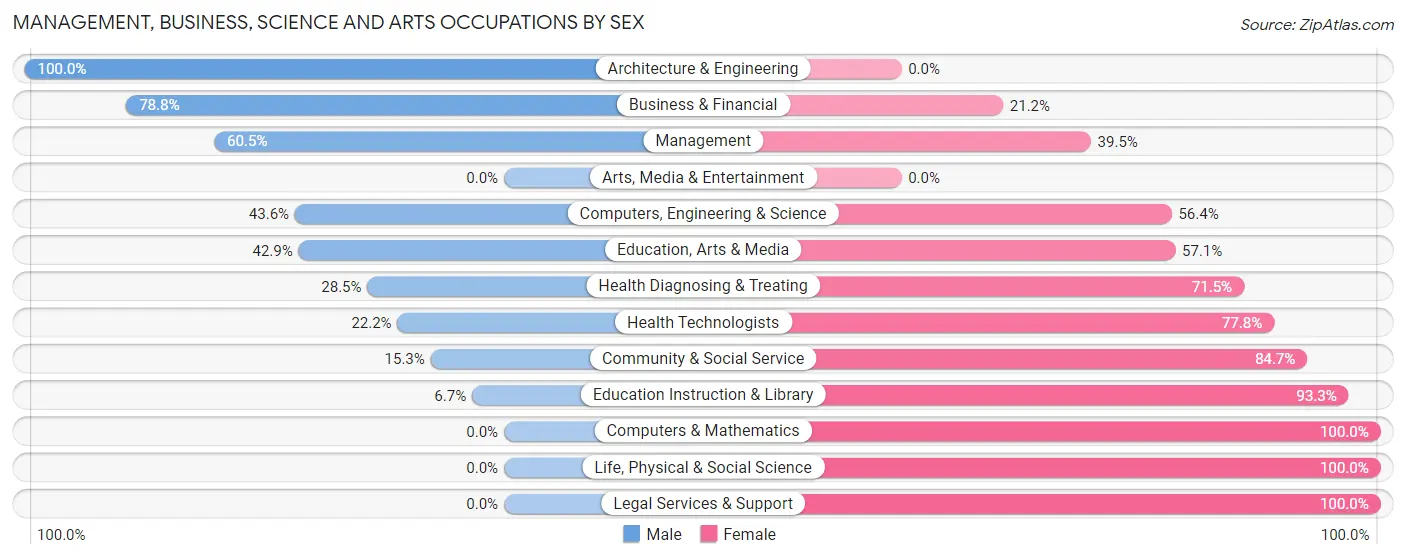
Management, Business, Science and Arts Occupations by Sex
Within the Management, Business, Science and Arts occupations in Heber Springs, the most male-oriented occupations are Architecture & Engineering (100.0%), Business & Financial (78.8%), and Management (60.5%), while the most female-oriented occupations are Computers & Mathematics (100.0%), Life, Physical & Social Science (100.0%), and Legal Services & Support (100.0%).
| Occupation | Male | Female |
| Management | 104 (60.5%) | 68 (39.5%) |
| Business & Financial | 26 (78.8%) | 7 (21.2%) |
| Computers, Engineering & Science | 58 (43.6%) | 75 (56.4%) |
| Computers & Mathematics | 0 (0.0%) | 37 (100.0%) |
| Architecture & Engineering | 58 (100.0%) | 0 (0.0%) |
| Life, Physical & Social Science | 0 (0.0%) | 38 (100.0%) |
| Community & Social Service | 30 (15.3%) | 166 (84.7%) |
| Education, Arts & Media | 24 (42.9%) | 32 (57.1%) |
| Legal Services & Support | 0 (0.0%) | 50 (100.0%) |
| Education Instruction & Library | 6 (6.7%) | 84 (93.3%) |
| Arts, Media & Entertainment | 0 (0.0%) | 0 (0.0%) |
| Health Diagnosing & Treating | 61 (28.5%) | 153 (71.5%) |
| Health Technologists | 34 (22.2%) | 119 (77.8%) |
| Total (Category) | 279 (37.3%) | 469 (62.7%) |
| Total (Overall) | 1,623 (57.9%) | 1,180 (42.1%) |
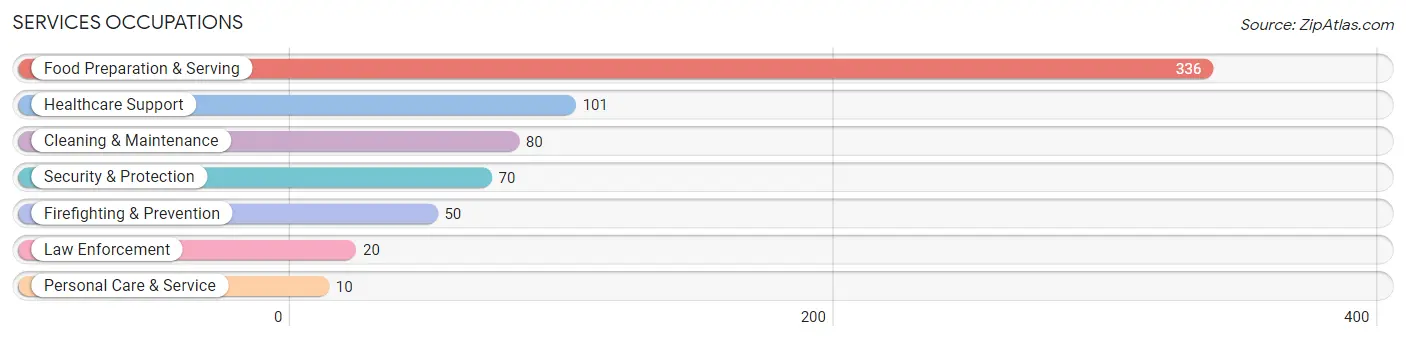
Services Occupations
The most common Services occupations in Heber Springs are Food Preparation & Serving (336 | 12.0%), Healthcare Support (101 | 3.6%), Cleaning & Maintenance (80 | 2.9%), Security & Protection (70 | 2.5%), and Firefighting & Prevention (50 | 1.8%).
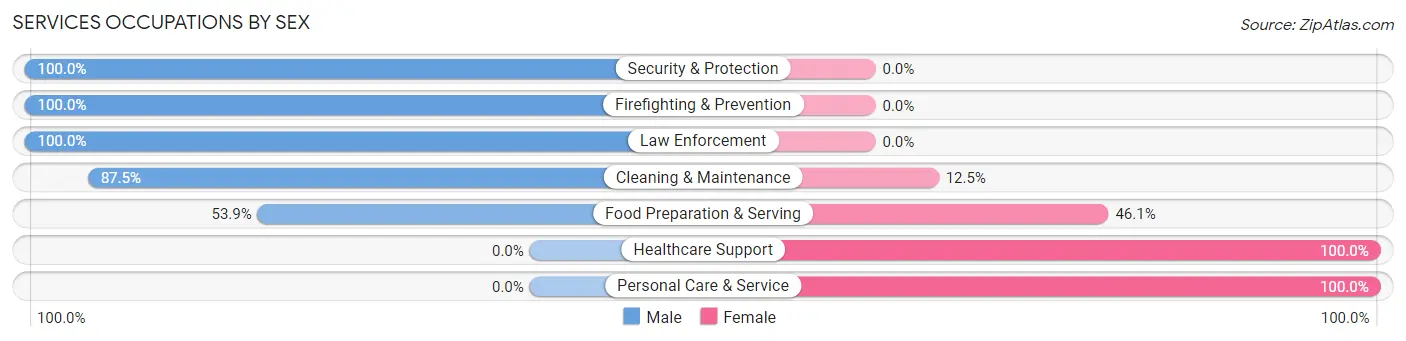
Services Occupations by Sex
Within the Services occupations in Heber Springs, the most male-oriented occupations are Security & Protection (100.0%), Firefighting & Prevention (100.0%), and Law Enforcement (100.0%), while the most female-oriented occupations are Healthcare Support (100.0%), Personal Care & Service (100.0%), and Food Preparation & Serving (46.1%).
| Occupation | Male | Female |
| Healthcare Support | 0 (0.0%) | 101 (100.0%) |
| Security & Protection | 70 (100.0%) | 0 (0.0%) |
| Firefighting & Prevention | 50 (100.0%) | 0 (0.0%) |
| Law Enforcement | 20 (100.0%) | 0 (0.0%) |
| Food Preparation & Serving | 181 (53.9%) | 155 (46.1%) |
| Cleaning & Maintenance | 70 (87.5%) | 10 (12.5%) |
| Personal Care & Service | 0 (0.0%) | 10 (100.0%) |
| Total (Category) | 321 (53.8%) | 276 (46.2%) |
| Total (Overall) | 1,623 (57.9%) | 1,180 (42.1%) |
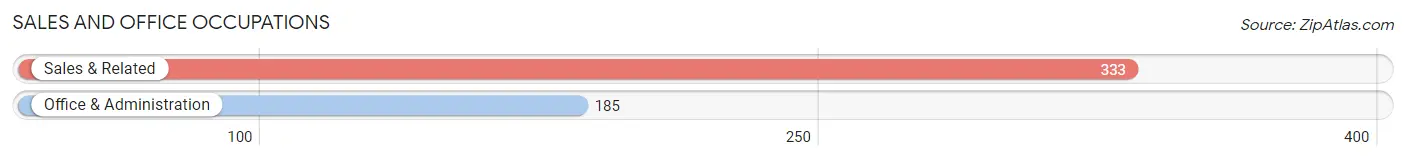
Sales and Office Occupations
The most common Sales and Office occupations in Heber Springs are Sales & Related (333 | 11.9%), and Office & Administration (185 | 6.6%).
Sales and Office Occupations by Sex
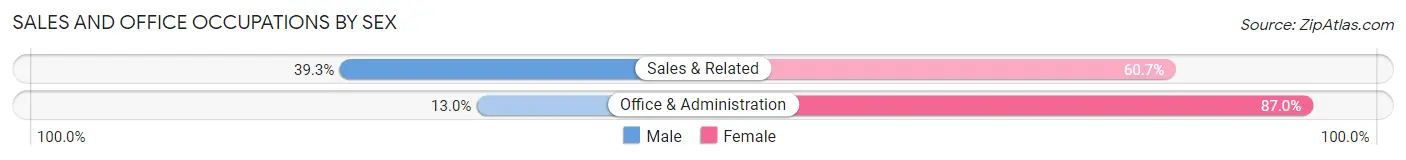
| Occupation | Male | Female |
| Sales & Related | 131 (39.3%) | 202 (60.7%) |
| Office & Administration | 24 (13.0%) | 161 (87.0%) |
| Total (Category) | 155 (29.9%) | 363 (70.1%) |
| Total (Overall) | 1,623 (57.9%) | 1,180 (42.1%) |
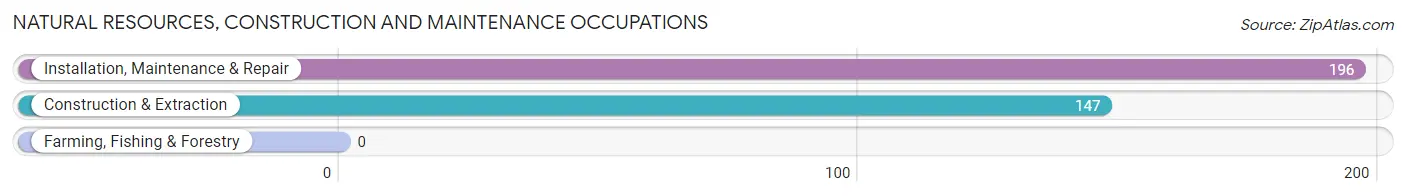
Natural Resources, Construction and Maintenance Occupations
The most common Natural Resources, Construction and Maintenance occupations in Heber Springs are Installation, Maintenance & Repair (196 | 7.0%), and Construction & Extraction (147 | 5.2%).
Natural Resources, Construction and Maintenance Occupations by Sex
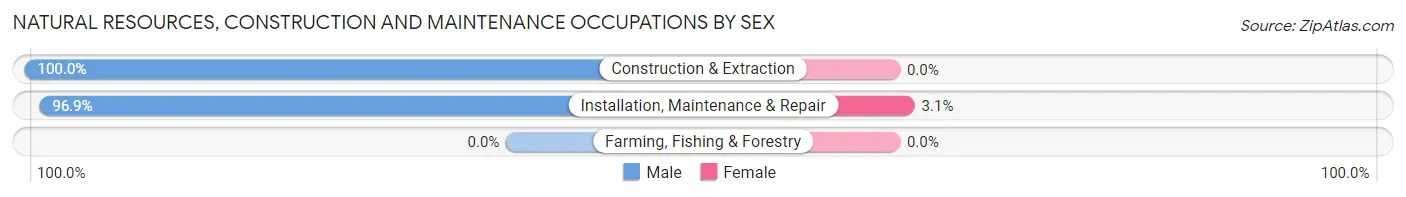
| Occupation | Male | Female |
| Farming, Fishing & Forestry | 0 (0.0%) | 0 (0.0%) |
| Construction & Extraction | 147 (100.0%) | 0 (0.0%) |
| Installation, Maintenance & Repair | 190 (96.9%) | 6 (3.1%) |
| Total (Category) | 337 (98.3%) | 6 (1.8%) |
| Total (Overall) | 1,623 (57.9%) | 1,180 (42.1%) |
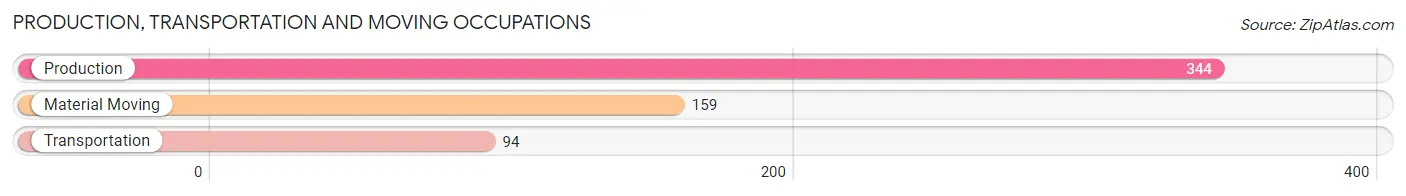
Production, Transportation and Moving Occupations
The most common Production, Transportation and Moving occupations in Heber Springs are Production (344 | 12.3%), Material Moving (159 | 5.7%), and Transportation (94 | 3.4%).
Production, Transportation and Moving Occupations by Sex
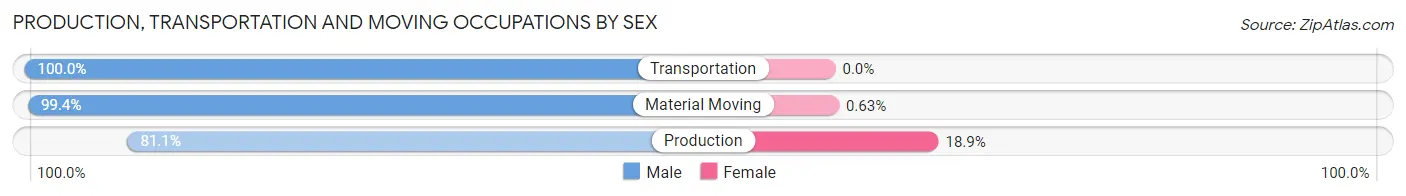
| Occupation | Male | Female |
| Production | 279 (81.1%) | 65 (18.9%) |
| Transportation | 94 (100.0%) | 0 (0.0%) |
| Material Moving | 158 (99.4%) | 1 (0.6%) |
| Total (Category) | 531 (88.9%) | 66 (11.1%) |
| Total (Overall) | 1,623 (57.9%) | 1,180 (42.1%) |
Employment Industries by Sex in Heber Springs
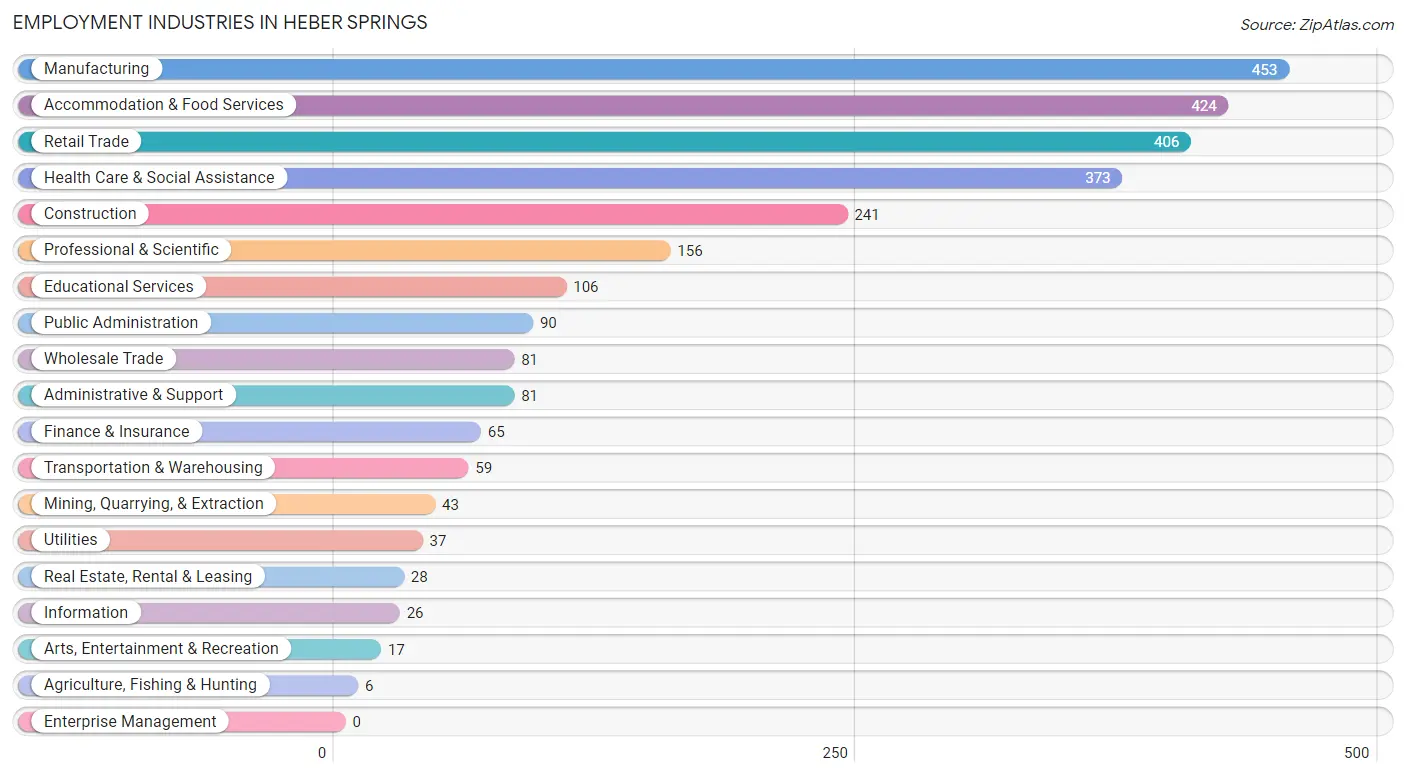
Employment Industries in Heber Springs
The major employment industries in Heber Springs include Manufacturing (453 | 16.2%), Accommodation & Food Services (424 | 15.1%), Retail Trade (406 | 14.5%), Health Care & Social Assistance (373 | 13.3%), and Construction (241 | 8.6%).
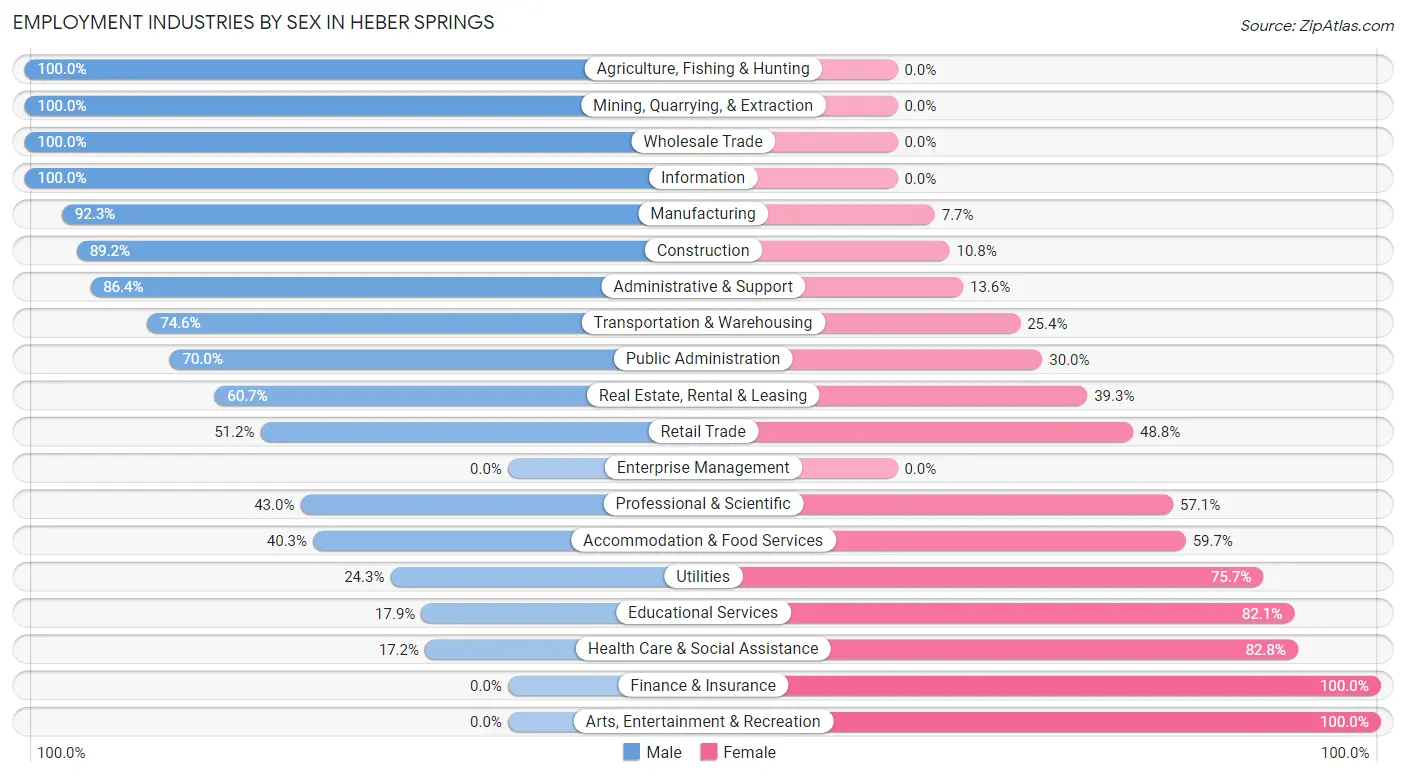
Employment Industries by Sex in Heber Springs
The Heber Springs industries that see more men than women are Agriculture, Fishing & Hunting (100.0%), Mining, Quarrying, & Extraction (100.0%), and Wholesale Trade (100.0%), whereas the industries that tend to have a higher number of women are Finance & Insurance (100.0%), Arts, Entertainment & Recreation (100.0%), and Health Care & Social Assistance (82.8%).
| Industry | Male | Female |
| Agriculture, Fishing & Hunting | 6 (100.0%) | 0 (0.0%) |
| Mining, Quarrying, & Extraction | 43 (100.0%) | 0 (0.0%) |
| Construction | 215 (89.2%) | 26 (10.8%) |
| Manufacturing | 418 (92.3%) | 35 (7.7%) |
| Wholesale Trade | 81 (100.0%) | 0 (0.0%) |
| Retail Trade | 208 (51.2%) | 198 (48.8%) |
| Transportation & Warehousing | 44 (74.6%) | 15 (25.4%) |
| Utilities | 9 (24.3%) | 28 (75.7%) |
| Information | 26 (100.0%) | 0 (0.0%) |
| Finance & Insurance | 0 (0.0%) | 65 (100.0%) |
| Real Estate, Rental & Leasing | 17 (60.7%) | 11 (39.3%) |
| Professional & Scientific | 67 (42.9%) | 89 (57.1%) |
| Enterprise Management | 0 (0.0%) | 0 (0.0%) |
| Administrative & Support | 70 (86.4%) | 11 (13.6%) |
| Educational Services | 19 (17.9%) | 87 (82.1%) |
| Health Care & Social Assistance | 64 (17.2%) | 309 (82.8%) |
| Arts, Entertainment & Recreation | 0 (0.0%) | 17 (100.0%) |
| Accommodation & Food Services | 171 (40.3%) | 253 (59.7%) |
| Public Administration | 63 (70.0%) | 27 (30.0%) |
| Total | 1,623 (57.9%) | 1,180 (42.1%) |
Education in Heber Springs
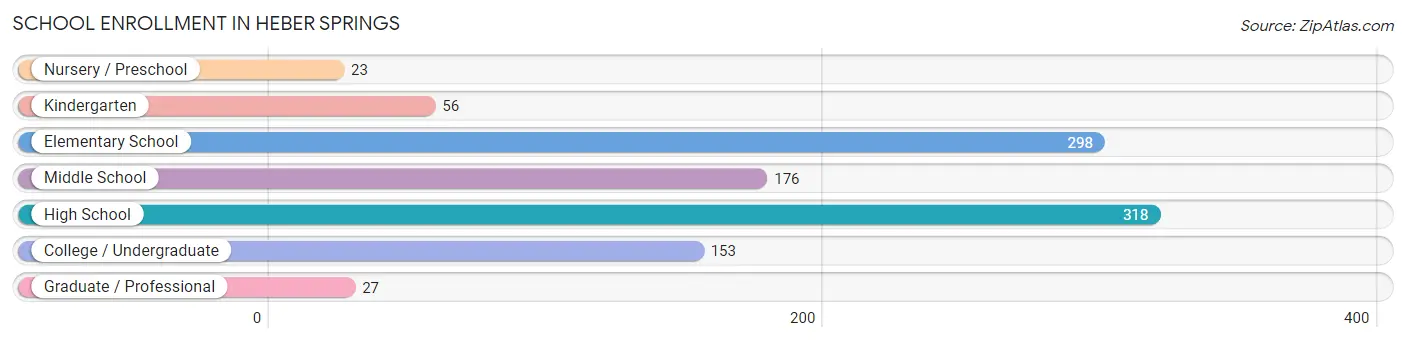
School Enrollment in Heber Springs
The most common levels of schooling among the 1,051 students in Heber Springs are high school (318 | 30.3%), elementary school (298 | 28.3%), and middle school (176 | 16.8%).
| School Level | # Students | % Students |
| Nursery / Preschool | 23 | 2.2% |
| Kindergarten | 56 | 5.3% |
| Elementary School | 298 | 28.3% |
| Middle School | 176 | 16.8% |
| High School | 318 | 30.3% |
| College / Undergraduate | 153 | 14.6% |
| Graduate / Professional | 27 | 2.6% |
| Total | 1,051 | 100.0% |
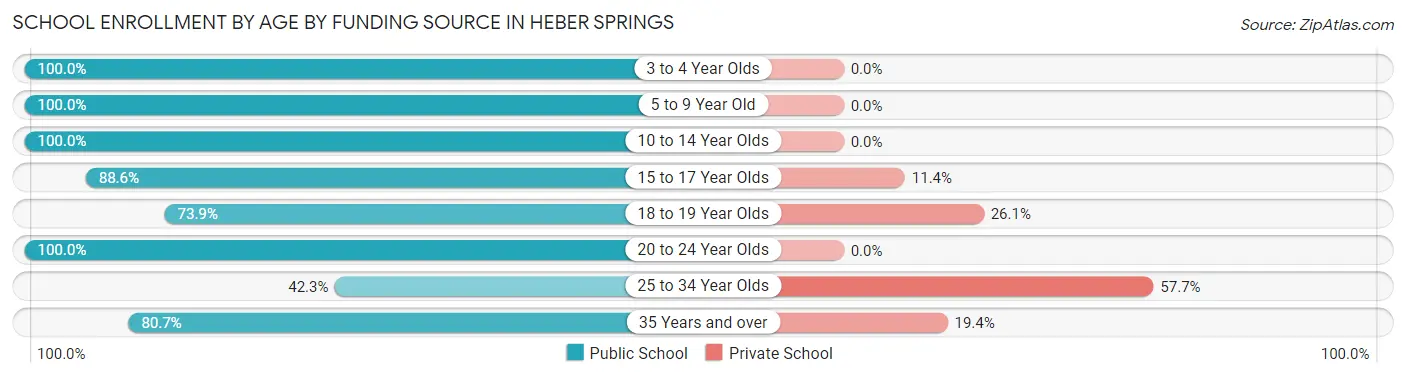
School Enrollment by Age by Funding Source in Heber Springs
Out of a total of 1,051 students who are enrolled in schools in Heber Springs, 104 (9.9%) attend a private institution, while the remaining 947 (90.1%) are enrolled in public schools. The age group of 25 to 34 year olds has the highest likelihood of being enrolled in private schools, with 30 (57.7% in the age bracket) enrolled. Conversely, the age group of 3 to 4 year olds has the lowest likelihood of being enrolled in a private school, with 23 (100.0% in the age bracket) attending a public institution.
| Age Bracket | Public School | Private School |
| 3 to 4 Year Olds | 23 (100.0%) | 0 (0.0%) |
| 5 to 9 Year Old | 288 (100.0%) | 0 (0.0%) |
| 10 to 14 Year Olds | 242 (100.0%) | 0 (0.0%) |
| 15 to 17 Year Olds | 202 (88.6%) | 26 (11.4%) |
| 18 to 19 Year Olds | 102 (73.9%) | 36 (26.1%) |
| 20 to 24 Year Olds | 18 (100.0%) | 0 (0.0%) |
| 25 to 34 Year Olds | 22 (42.3%) | 30 (57.7%) |
| 35 Years and over | 50 (80.6%) | 12 (19.4%) |
| Total | 947 (90.1%) | 104 (9.9%) |
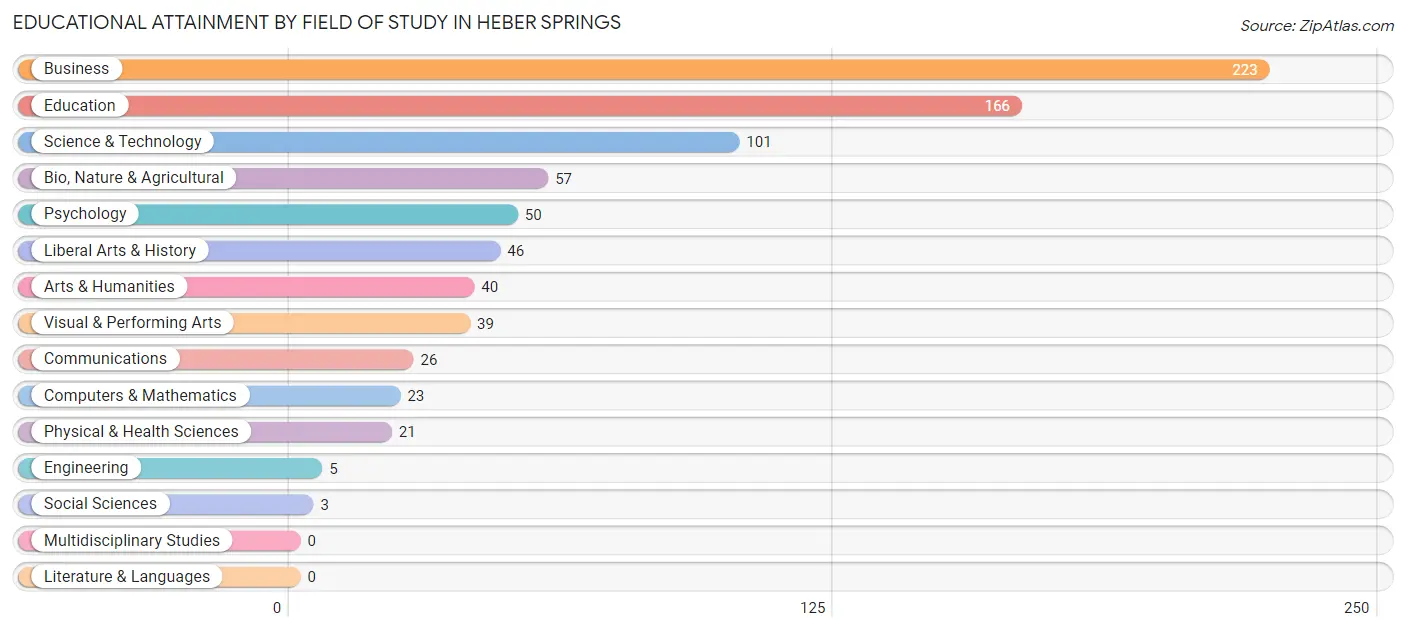
Educational Attainment by Field of Study in Heber Springs
Business (223 | 27.9%), education (166 | 20.7%), science & technology (101 | 12.6%), bio, nature & agricultural (57 | 7.1%), and psychology (50 | 6.2%) are the most common fields of study among 800 individuals in Heber Springs who have obtained a bachelor's degree or higher.
| Field of Study | # Graduates | % Graduates |
| Computers & Mathematics | 23 | 2.9% |
| Bio, Nature & Agricultural | 57 | 7.1% |
| Physical & Health Sciences | 21 | 2.6% |
| Psychology | 50 | 6.2% |
| Social Sciences | 3 | 0.4% |
| Engineering | 5 | 0.6% |
| Multidisciplinary Studies | 0 | 0.0% |
| Science & Technology | 101 | 12.6% |
| Business | 223 | 27.9% |
| Education | 166 | 20.7% |
| Literature & Languages | 0 | 0.0% |
| Liberal Arts & History | 46 | 5.8% |
| Visual & Performing Arts | 39 | 4.9% |
| Communications | 26 | 3.3% |
| Arts & Humanities | 40 | 5.0% |
| Total | 800 | 100.0% |
Transportation & Commute in Heber Springs
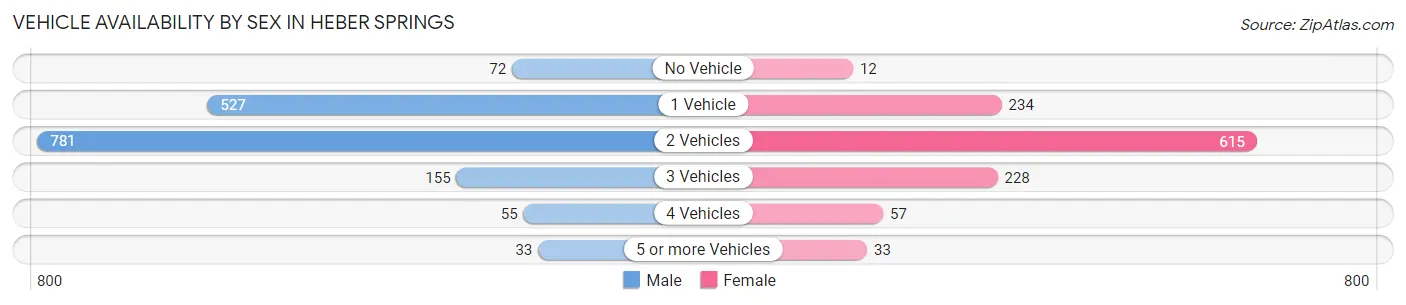
Vehicle Availability by Sex in Heber Springs
The most prevalent vehicle ownership categories in Heber Springs are males with 2 vehicles (781, accounting for 48.1%) and females with 2 vehicles (615, making up 66.2%).
| Vehicles Available | Male | Female |
| No Vehicle | 72 (4.4%) | 12 (1.0%) |
| 1 Vehicle | 527 (32.5%) | 234 (19.9%) |
| 2 Vehicles | 781 (48.1%) | 615 (52.2%) |
| 3 Vehicles | 155 (9.6%) | 228 (19.3%) |
| 4 Vehicles | 55 (3.4%) | 57 (4.8%) |
| 5 or more Vehicles | 33 (2.0%) | 33 (2.8%) |
| Total | 1,623 (100.0%) | 1,179 (100.0%) |
Commute Time in Heber Springs
The most frequently occuring commute durations in Heber Springs are 10 to 14 minutes (721 commuters, 28.6%), 5 to 9 minutes (558 commuters, 22.1%), and 15 to 19 minutes (249 commuters, 9.9%).
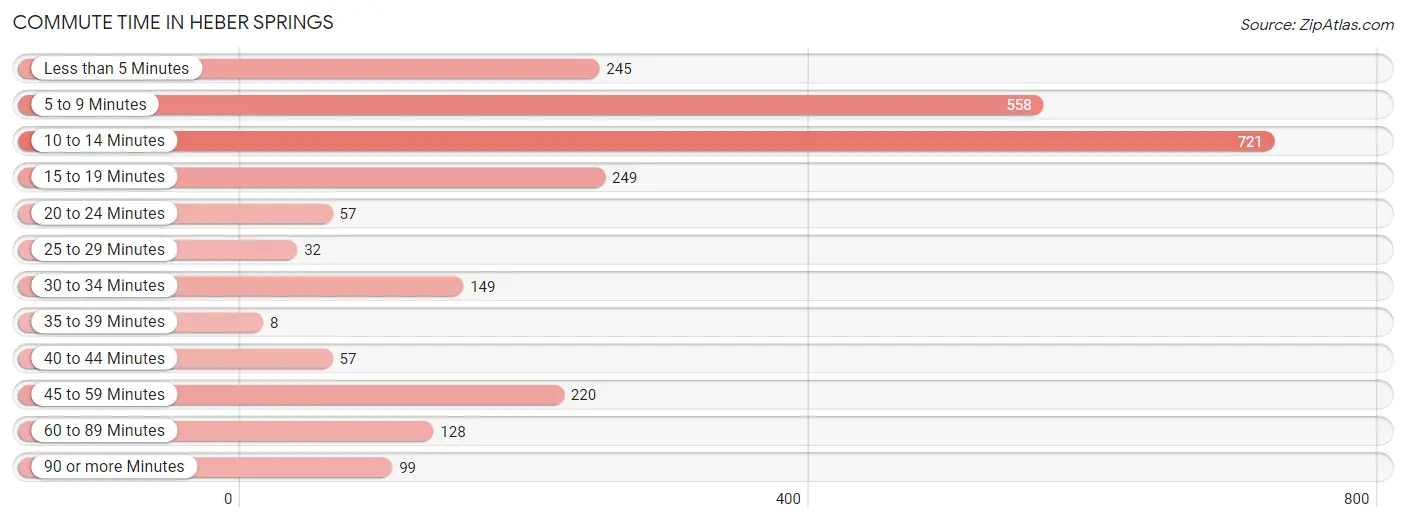
| Commute Time | # Commuters | % Commuters |
| Less than 5 Minutes | 245 | 9.7% |
| 5 to 9 Minutes | 558 | 22.1% |
| 10 to 14 Minutes | 721 | 28.6% |
| 15 to 19 Minutes | 249 | 9.9% |
| 20 to 24 Minutes | 57 | 2.3% |
| 25 to 29 Minutes | 32 | 1.3% |
| 30 to 34 Minutes | 149 | 5.9% |
| 35 to 39 Minutes | 8 | 0.3% |
| 40 to 44 Minutes | 57 | 2.3% |
| 45 to 59 Minutes | 220 | 8.7% |
| 60 to 89 Minutes | 128 | 5.1% |
| 90 or more Minutes | 99 | 3.9% |
Commute Time by Sex in Heber Springs
The most common commute times in Heber Springs are 10 to 14 minutes (418 commuters, 26.4%) for males and 10 to 14 minutes (303 commuters, 32.3%) for females.
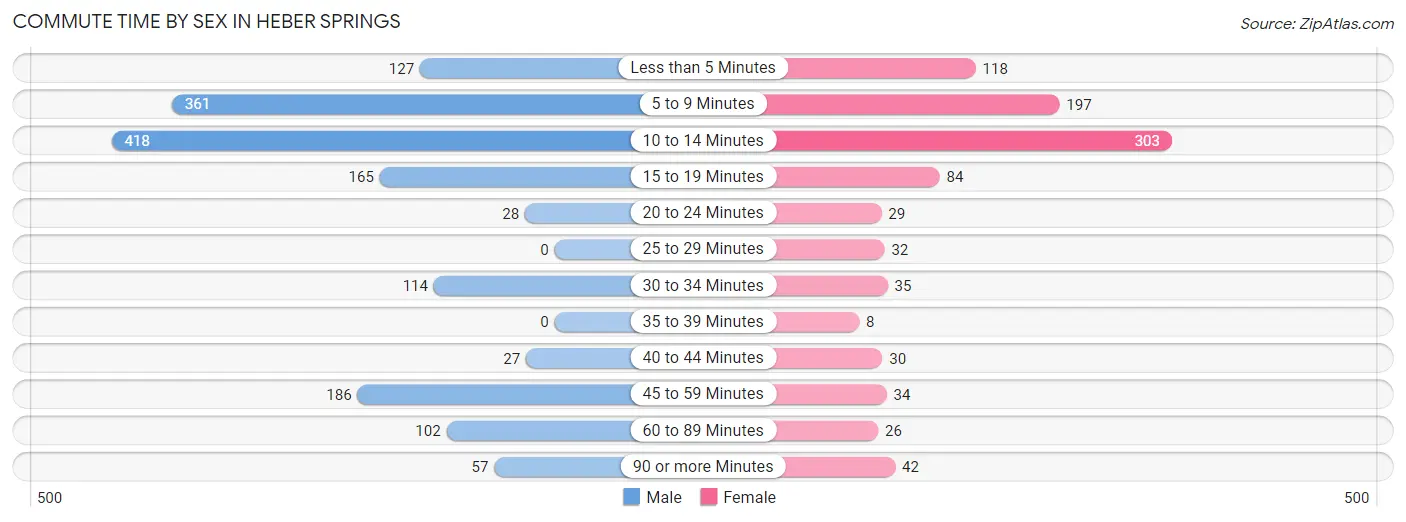
| Commute Time | Male | Female |
| Less than 5 Minutes | 127 (8.0%) | 118 (12.6%) |
| 5 to 9 Minutes | 361 (22.8%) | 197 (21.0%) |
| 10 to 14 Minutes | 418 (26.4%) | 303 (32.3%) |
| 15 to 19 Minutes | 165 (10.4%) | 84 (9.0%) |
| 20 to 24 Minutes | 28 (1.8%) | 29 (3.1%) |
| 25 to 29 Minutes | 0 (0.0%) | 32 (3.4%) |
| 30 to 34 Minutes | 114 (7.2%) | 35 (3.7%) |
| 35 to 39 Minutes | 0 (0.0%) | 8 (0.9%) |
| 40 to 44 Minutes | 27 (1.7%) | 30 (3.2%) |
| 45 to 59 Minutes | 186 (11.7%) | 34 (3.6%) |
| 60 to 89 Minutes | 102 (6.4%) | 26 (2.8%) |
| 90 or more Minutes | 57 (3.6%) | 42 (4.5%) |
Time of Departure to Work by Sex in Heber Springs
The most frequent times of departure to work in Heber Springs are 6:00 AM to 6:29 AM (416, 26.3%) for males and 7:30 AM to 7:59 AM (160, 17.1%) for females.
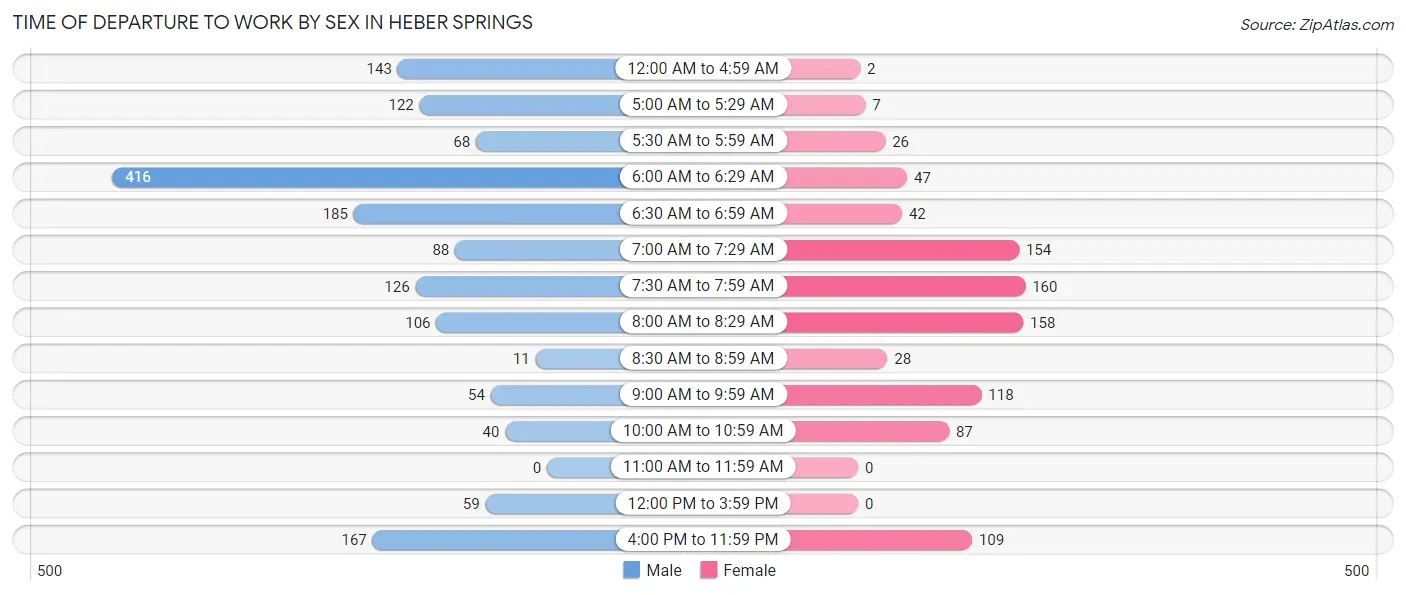
| Time of Departure | Male | Female |
| 12:00 AM to 4:59 AM | 143 (9.0%) | 2 (0.2%) |
| 5:00 AM to 5:29 AM | 122 (7.7%) | 7 (0.7%) |
| 5:30 AM to 5:59 AM | 68 (4.3%) | 26 (2.8%) |
| 6:00 AM to 6:29 AM | 416 (26.3%) | 47 (5.0%) |
| 6:30 AM to 6:59 AM | 185 (11.7%) | 42 (4.5%) |
| 7:00 AM to 7:29 AM | 88 (5.6%) | 154 (16.4%) |
| 7:30 AM to 7:59 AM | 126 (8.0%) | 160 (17.1%) |
| 8:00 AM to 8:29 AM | 106 (6.7%) | 158 (16.8%) |
| 8:30 AM to 8:59 AM | 11 (0.7%) | 28 (3.0%) |
| 9:00 AM to 9:59 AM | 54 (3.4%) | 118 (12.6%) |
| 10:00 AM to 10:59 AM | 40 (2.5%) | 87 (9.3%) |
| 11:00 AM to 11:59 AM | 0 (0.0%) | 0 (0.0%) |
| 12:00 PM to 3:59 PM | 59 (3.7%) | 0 (0.0%) |
| 4:00 PM to 11:59 PM | 167 (10.5%) | 109 (11.6%) |
| Total | 1,585 (100.0%) | 938 (100.0%) |
Housing Occupancy in Heber Springs
Occupancy by Ownership in Heber Springs
Of the total 3,084 dwellings in Heber Springs, owner-occupied units account for 2,039 (66.1%), while renter-occupied units make up 1,045 (33.9%).
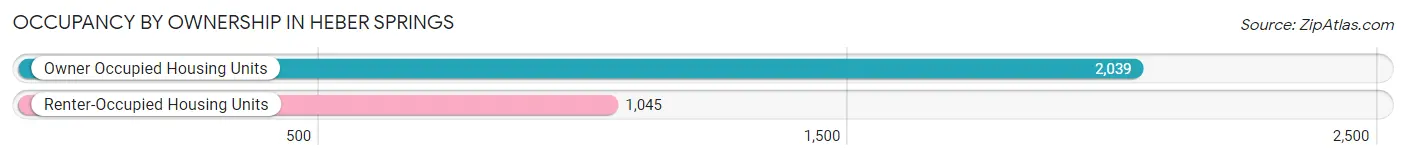
| Occupancy | # Housing Units | % Housing Units |
| Owner Occupied Housing Units | 2,039 | 66.1% |
| Renter-Occupied Housing Units | 1,045 | 33.9% |
| Total Occupied Housing Units | 3,084 | 100.0% |
Occupancy by Household Size in Heber Springs
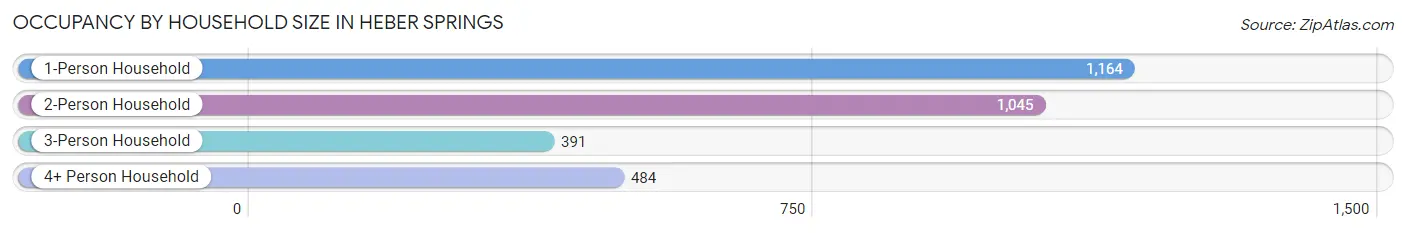
| Household Size | # Housing Units | % Housing Units |
| 1-Person Household | 1,164 | 37.7% |
| 2-Person Household | 1,045 | 33.9% |
| 3-Person Household | 391 | 12.7% |
| 4+ Person Household | 484 | 15.7% |
| Total Housing Units | 3,084 | 100.0% |
Occupancy by Ownership by Household Size in Heber Springs
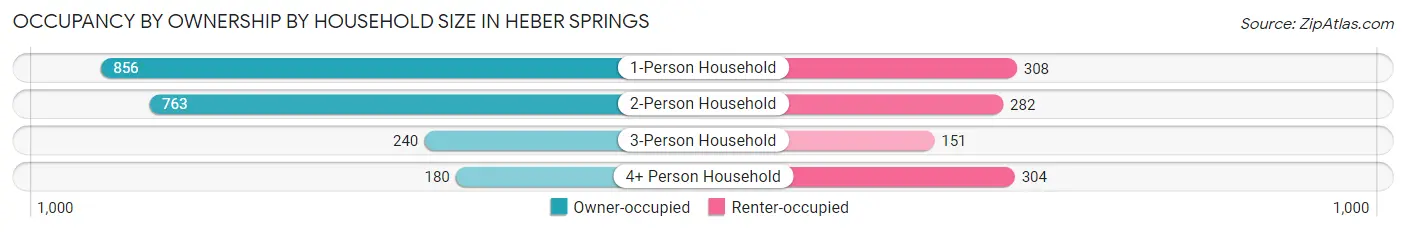
| Household Size | Owner-occupied | Renter-occupied |
| 1-Person Household | 856 (73.5%) | 308 (26.5%) |
| 2-Person Household | 763 (73.0%) | 282 (27.0%) |
| 3-Person Household | 240 (61.4%) | 151 (38.6%) |
| 4+ Person Household | 180 (37.2%) | 304 (62.8%) |
| Total Housing Units | 2,039 (66.1%) | 1,045 (33.9%) |
Occupancy by Educational Attainment in Heber Springs
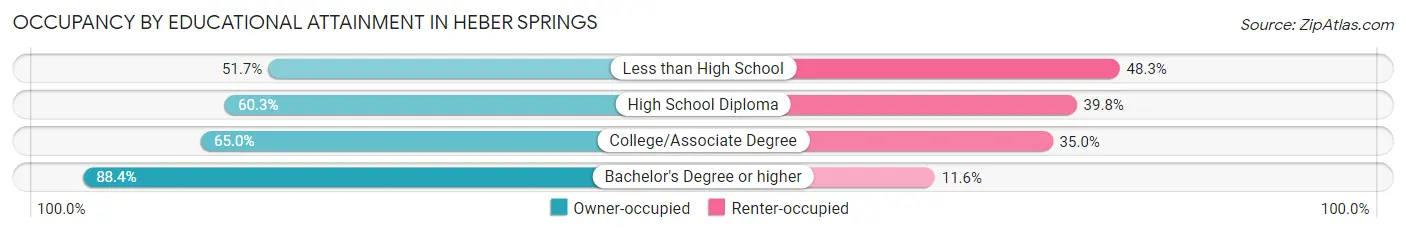
| Household Size | Owner-occupied | Renter-occupied |
| Less than High School | 165 (51.7%) | 154 (48.3%) |
| High School Diploma | 685 (60.3%) | 452 (39.8%) |
| College/Associate Degree | 695 (65.0%) | 374 (35.0%) |
| Bachelor's Degree or higher | 494 (88.4%) | 65 (11.6%) |
Occupancy by Age of Householder in Heber Springs
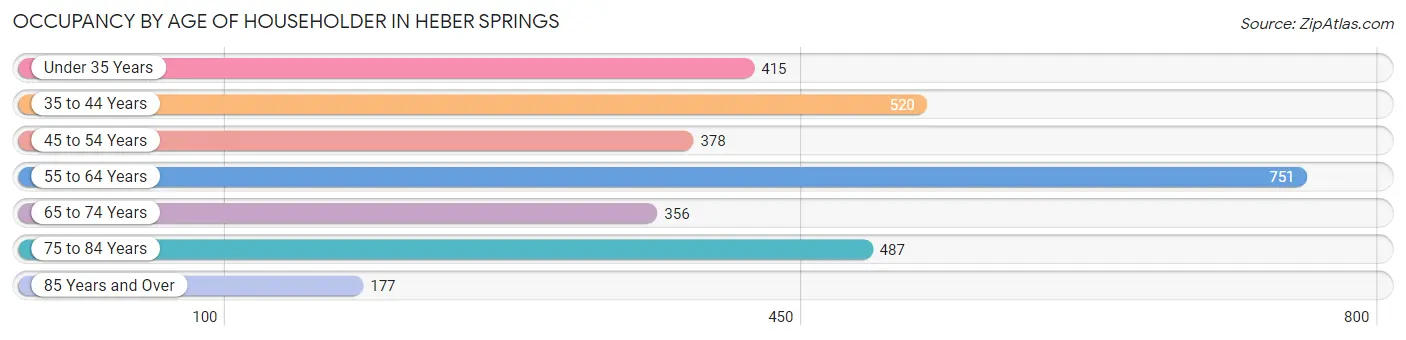
| Age Bracket | # Households | % Households |
| Under 35 Years | 415 | 13.5% |
| 35 to 44 Years | 520 | 16.9% |
| 45 to 54 Years | 378 | 12.3% |
| 55 to 64 Years | 751 | 24.3% |
| 65 to 74 Years | 356 | 11.5% |
| 75 to 84 Years | 487 | 15.8% |
| 85 Years and Over | 177 | 5.7% |
| Total | 3,084 | 100.0% |
Housing Finances in Heber Springs
Median Income by Occupancy in Heber Springs
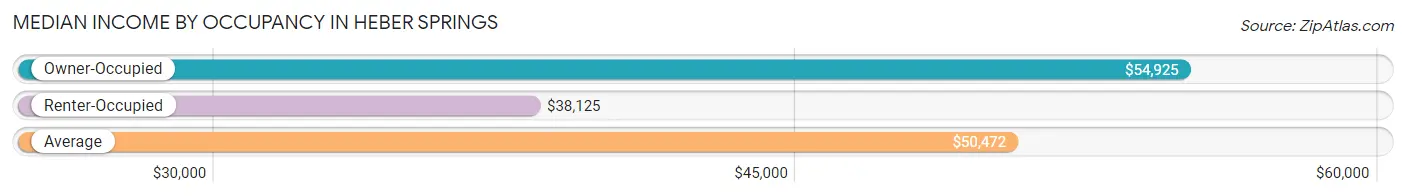
| Occupancy Type | # Households | Median Income |
| Owner-Occupied | 2,039 (66.1%) | $54,925 |
| Renter-Occupied | 1,045 (33.9%) | $38,125 |
| Average | 3,084 (100.0%) | $50,472 |
Occupancy by Householder Income Bracket in Heber Springs
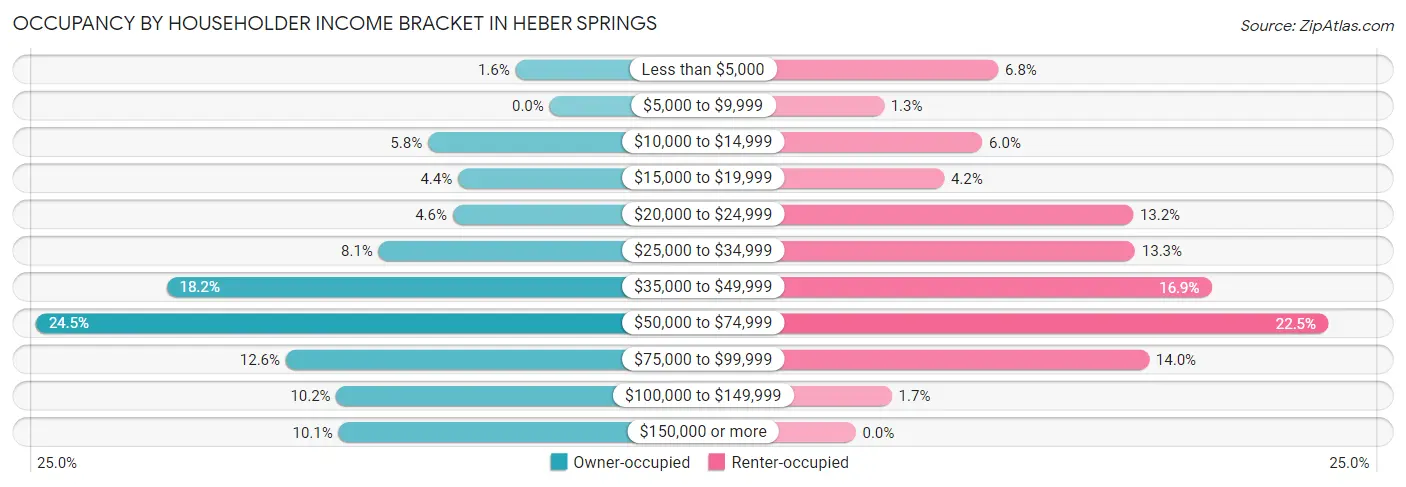
| Income Bracket | Owner-occupied | Renter-occupied |
| Less than $5,000 | 33 (1.6%) | 71 (6.8%) |
| $5,000 to $9,999 | 0 (0.0%) | 14 (1.3%) |
| $10,000 to $14,999 | 118 (5.8%) | 63 (6.0%) |
| $15,000 to $19,999 | 89 (4.4%) | 44 (4.2%) |
| $20,000 to $24,999 | 94 (4.6%) | 138 (13.2%) |
| $25,000 to $34,999 | 166 (8.1%) | 139 (13.3%) |
| $35,000 to $49,999 | 372 (18.2%) | 177 (16.9%) |
| $50,000 to $74,999 | 499 (24.5%) | 235 (22.5%) |
| $75,000 to $99,999 | 256 (12.6%) | 146 (14.0%) |
| $100,000 to $149,999 | 207 (10.2%) | 18 (1.7%) |
| $150,000 or more | 205 (10.1%) | 0 (0.0%) |
| Total | 2,039 (100.0%) | 1,045 (100.0%) |
Monthly Housing Cost Tiers in Heber Springs
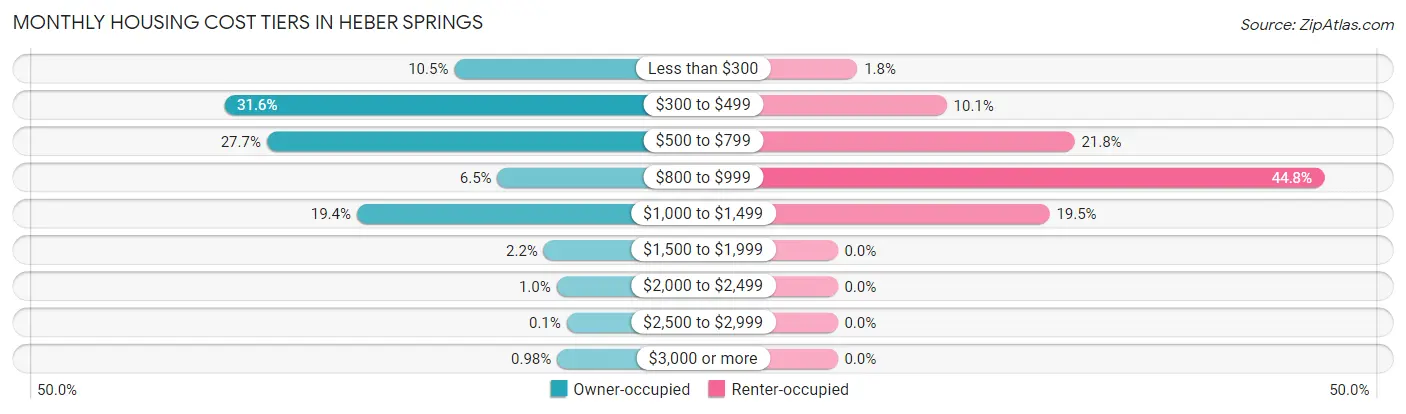
| Monthly Cost | Owner-occupied | Renter-occupied |
| Less than $300 | 213 (10.4%) | 19 (1.8%) |
| $300 to $499 | 645 (31.6%) | 105 (10.1%) |
| $500 to $799 | 565 (27.7%) | 228 (21.8%) |
| $800 to $999 | 132 (6.5%) | 468 (44.8%) |
| $1,000 to $1,499 | 396 (19.4%) | 204 (19.5%) |
| $1,500 to $1,999 | 45 (2.2%) | 0 (0.0%) |
| $2,000 to $2,499 | 21 (1.0%) | 0 (0.0%) |
| $2,500 to $2,999 | 2 (0.1%) | 0 (0.0%) |
| $3,000 or more | 20 (1.0%) | 0 (0.0%) |
| Total | 2,039 (100.0%) | 1,045 (100.0%) |
Physical Housing Characteristics in Heber Springs
Housing Structures in Heber Springs
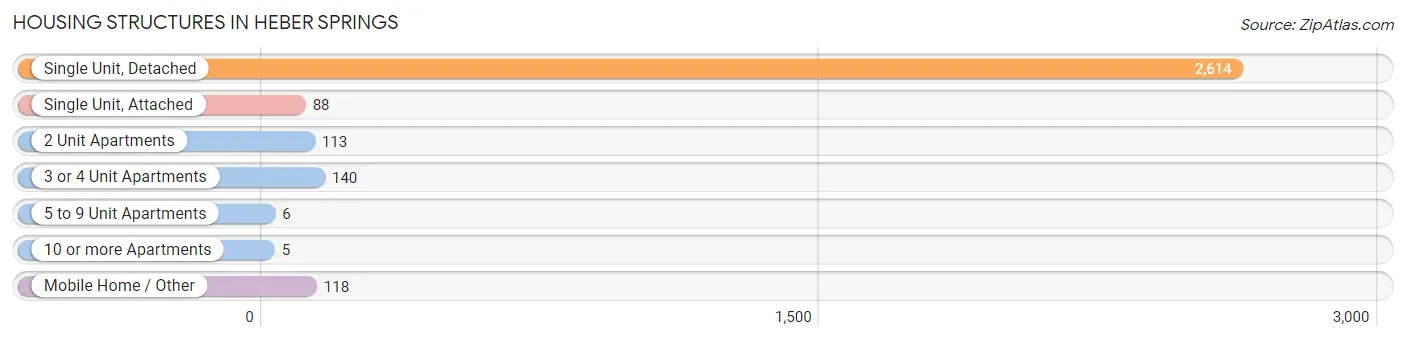
| Structure Type | # Housing Units | % Housing Units |
| Single Unit, Detached | 2,614 | 84.8% |
| Single Unit, Attached | 88 | 2.9% |
| 2 Unit Apartments | 113 | 3.7% |
| 3 or 4 Unit Apartments | 140 | 4.5% |
| 5 to 9 Unit Apartments | 6 | 0.2% |
| 10 or more Apartments | 5 | 0.2% |
| Mobile Home / Other | 118 | 3.8% |
| Total | 3,084 | 100.0% |
Housing Structures by Occupancy in Heber Springs
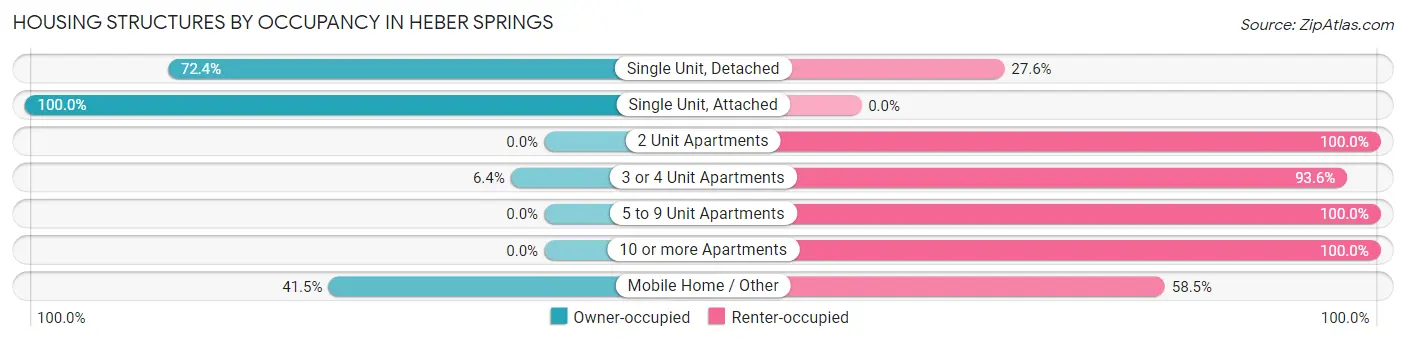
| Structure Type | Owner-occupied | Renter-occupied |
| Single Unit, Detached | 1,893 (72.4%) | 721 (27.6%) |
| Single Unit, Attached | 88 (100.0%) | 0 (0.0%) |
| 2 Unit Apartments | 0 (0.0%) | 113 (100.0%) |
| 3 or 4 Unit Apartments | 9 (6.4%) | 131 (93.6%) |
| 5 to 9 Unit Apartments | 0 (0.0%) | 6 (100.0%) |
| 10 or more Apartments | 0 (0.0%) | 5 (100.0%) |
| Mobile Home / Other | 49 (41.5%) | 69 (58.5%) |
| Total | 2,039 (66.1%) | 1,045 (33.9%) |
Housing Structures by Number of Rooms in Heber Springs
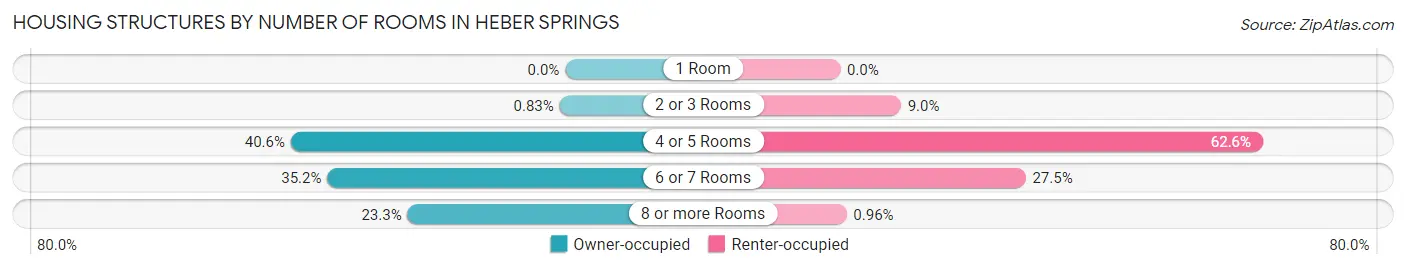
| Number of Rooms | Owner-occupied | Renter-occupied |
| 1 Room | 0 (0.0%) | 0 (0.0%) |
| 2 or 3 Rooms | 17 (0.8%) | 94 (9.0%) |
| 4 or 5 Rooms | 828 (40.6%) | 654 (62.6%) |
| 6 or 7 Rooms | 718 (35.2%) | 287 (27.5%) |
| 8 or more Rooms | 476 (23.3%) | 10 (1.0%) |
| Total | 2,039 (100.0%) | 1,045 (100.0%) |
Housing Structure by Heating Type in Heber Springs
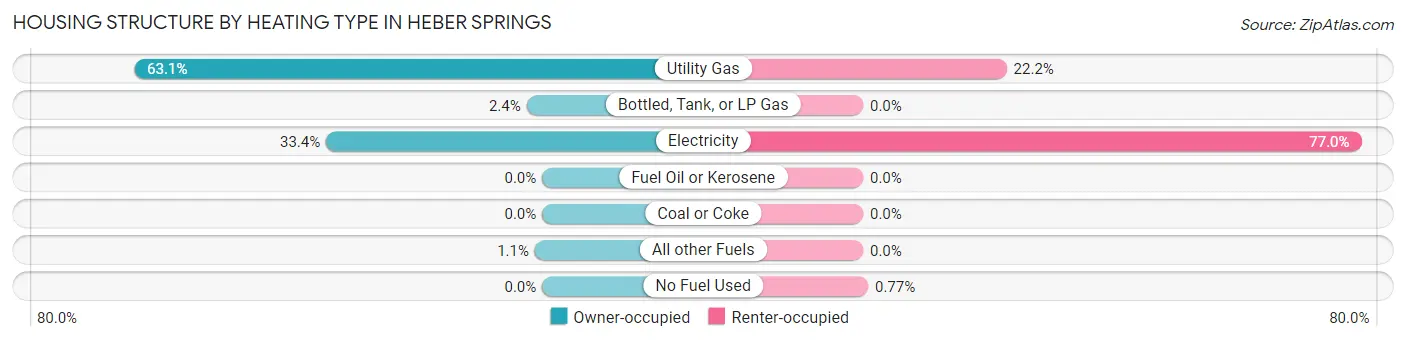
| Heating Type | Owner-occupied | Renter-occupied |
| Utility Gas | 1,286 (63.1%) | 232 (22.2%) |
| Bottled, Tank, or LP Gas | 49 (2.4%) | 0 (0.0%) |
| Electricity | 681 (33.4%) | 805 (77.0%) |
| Fuel Oil or Kerosene | 0 (0.0%) | 0 (0.0%) |
| Coal or Coke | 0 (0.0%) | 0 (0.0%) |
| All other Fuels | 23 (1.1%) | 0 (0.0%) |
| No Fuel Used | 0 (0.0%) | 8 (0.8%) |
| Total | 2,039 (100.0%) | 1,045 (100.0%) |
Household Vehicle Usage in Heber Springs
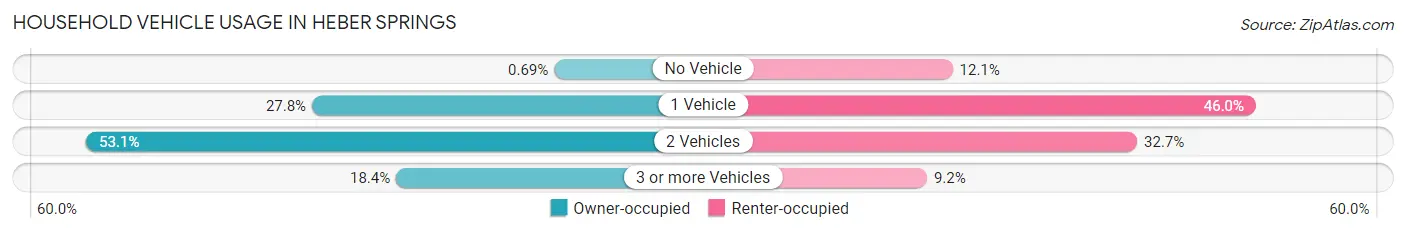
| Vehicles per Household | Owner-occupied | Renter-occupied |
| No Vehicle | 14 (0.7%) | 126 (12.1%) |
| 1 Vehicle | 567 (27.8%) | 481 (46.0%) |
| 2 Vehicles | 1,083 (53.1%) | 342 (32.7%) |
| 3 or more Vehicles | 375 (18.4%) | 96 (9.2%) |
| Total | 2,039 (100.0%) | 1,045 (100.0%) |
Real Estate & Mortgages in Heber Springs
Real Estate and Mortgage Overview in Heber Springs
| Characteristic | Without Mortgage | With Mortgage |
| Housing Units | 1,241 | 798 |
| Median Property Value | $163,000 | $127,500 |
| Median Household Income | $53,275 | $46 |
| Monthly Housing Costs | $398 | $20 |
| Real Estate Taxes | $720 | $55 |
Property Value by Mortgage Status in Heber Springs
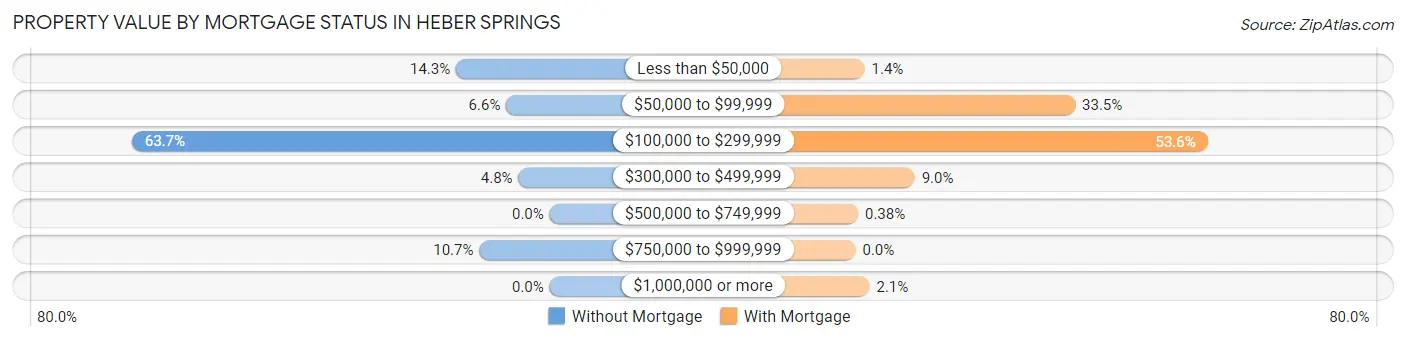
| Property Value | Without Mortgage | With Mortgage |
| Less than $50,000 | 177 (14.3%) | 11 (1.4%) |
| $50,000 to $99,999 | 82 (6.6%) | 267 (33.5%) |
| $100,000 to $299,999 | 790 (63.7%) | 428 (53.6%) |
| $300,000 to $499,999 | 59 (4.8%) | 72 (9.0%) |
| $500,000 to $749,999 | 0 (0.0%) | 3 (0.4%) |
| $750,000 to $999,999 | 133 (10.7%) | 0 (0.0%) |
| $1,000,000 or more | 0 (0.0%) | 17 (2.1%) |
| Total | 1,241 (100.0%) | 798 (100.0%) |
Household Income by Mortgage Status in Heber Springs
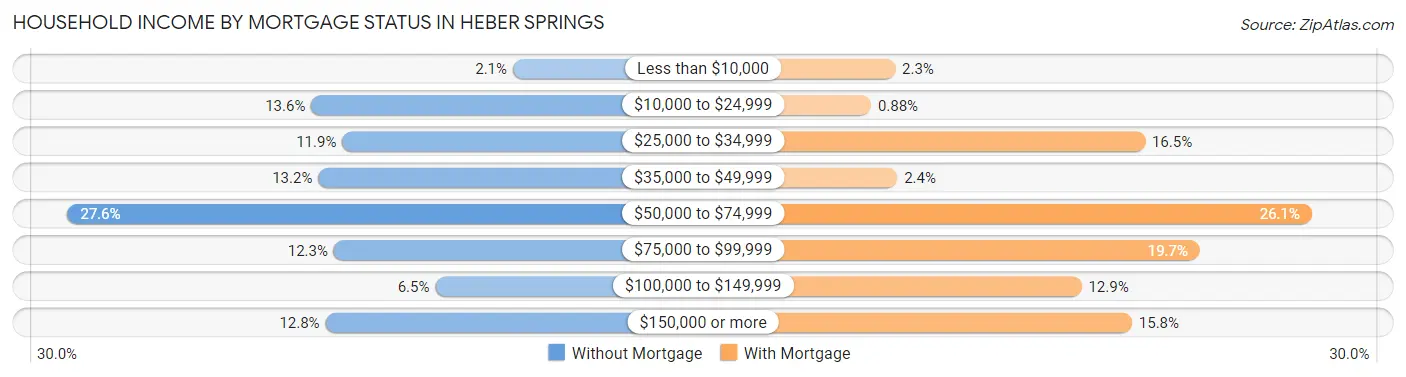
| Household Income | Without Mortgage | With Mortgage |
| Less than $10,000 | 26 (2.1%) | 18 (2.3%) |
| $10,000 to $24,999 | 169 (13.6%) | 7 (0.9%) |
| $25,000 to $34,999 | 147 (11.8%) | 132 (16.5%) |
| $35,000 to $49,999 | 164 (13.2%) | 19 (2.4%) |
| $50,000 to $74,999 | 342 (27.6%) | 208 (26.1%) |
| $75,000 to $99,999 | 153 (12.3%) | 157 (19.7%) |
| $100,000 to $149,999 | 81 (6.5%) | 103 (12.9%) |
| $150,000 or more | 159 (12.8%) | 126 (15.8%) |
| Total | 1,241 (100.0%) | 798 (100.0%) |
Property Value to Household Income Ratio in Heber Springs
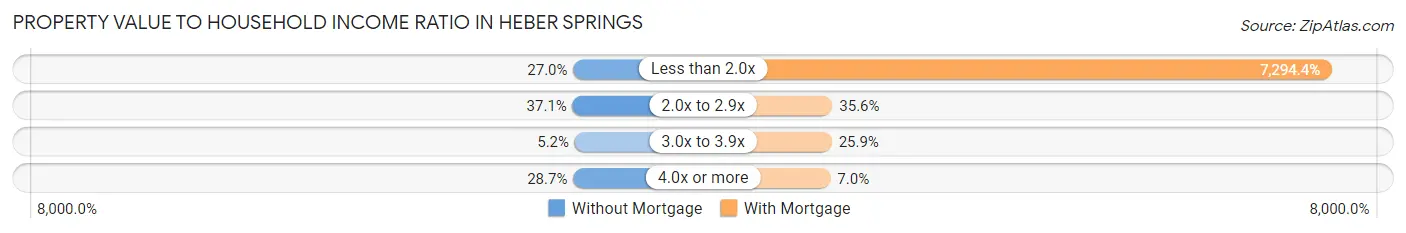
| Value-to-Income Ratio | Without Mortgage | With Mortgage |
| Less than 2.0x | 335 (27.0%) | 58,209 (7,294.4%) |
| 2.0x to 2.9x | 460 (37.1%) | 284 (35.6%) |
| 3.0x to 3.9x | 64 (5.2%) | 207 (25.9%) |
| 4.0x or more | 356 (28.7%) | 56 (7.0%) |
| Total | 1,241 (100.0%) | 798 (100.0%) |
Real Estate Taxes by Mortgage Status in Heber Springs
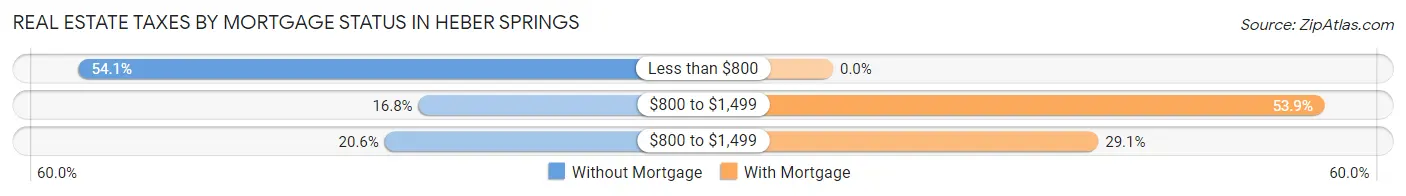
| Property Taxes | Without Mortgage | With Mortgage |
| Less than $800 | 671 (54.1%) | 0 (0.0%) |
| $800 to $1,499 | 209 (16.8%) | 430 (53.9%) |
| $800 to $1,499 | 255 (20.5%) | 232 (29.1%) |
| Total | 1,241 (100.0%) | 798 (100.0%) |
Health & Disability in Heber Springs
Health Insurance Coverage by Age in Heber Springs
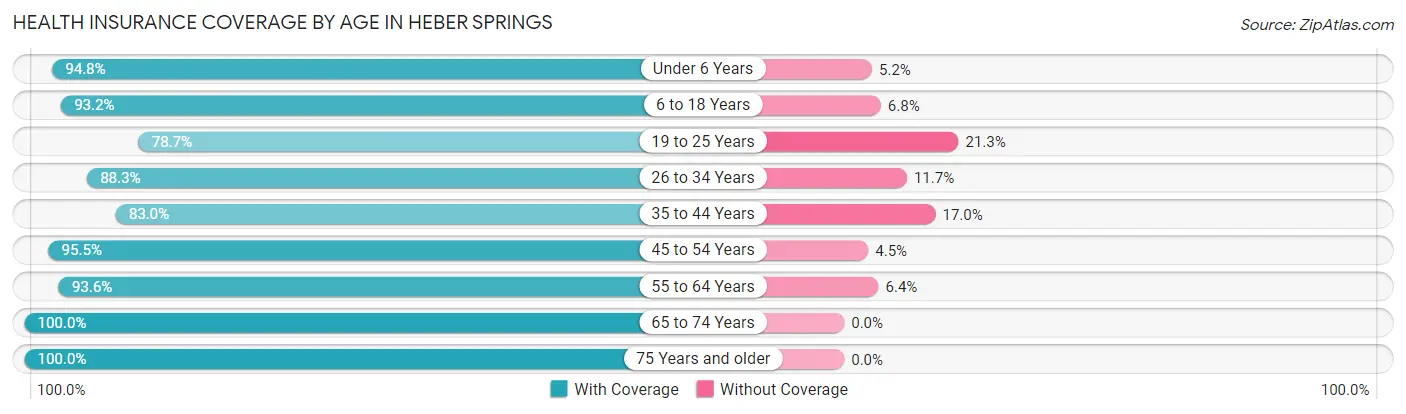
| Age Bracket | With Coverage | Without Coverage |
| Under 6 Years | 439 (94.8%) | 24 (5.2%) |
| 6 to 18 Years | 873 (93.2%) | 64 (6.8%) |
| 19 to 25 Years | 425 (78.7%) | 115 (21.3%) |
| 26 to 34 Years | 831 (88.3%) | 110 (11.7%) |
| 35 to 44 Years | 649 (83.0%) | 133 (17.0%) |
| 45 to 54 Years | 595 (95.5%) | 28 (4.5%) |
| 55 to 64 Years | 921 (93.6%) | 63 (6.4%) |
| 65 to 74 Years | 566 (100.0%) | 0 (0.0%) |
| 75 Years and older | 927 (100.0%) | 0 (0.0%) |
| Total | 6,226 (92.1%) | 537 (7.9%) |
Health Insurance Coverage by Citizenship Status in Heber Springs
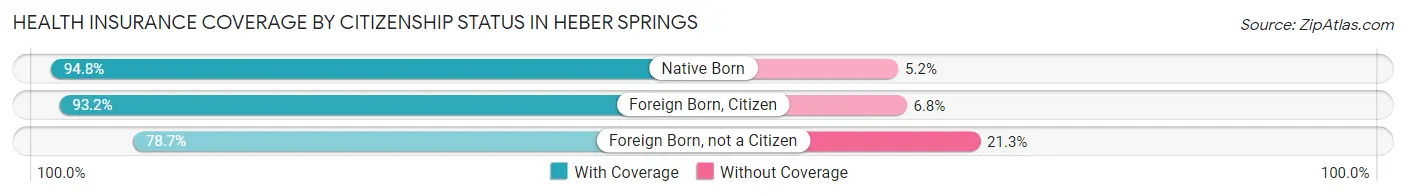
| Citizenship Status | With Coverage | Without Coverage |
| Native Born | 439 (94.8%) | 24 (5.2%) |
| Foreign Born, Citizen | 873 (93.2%) | 64 (6.8%) |
| Foreign Born, not a Citizen | 425 (78.7%) | 115 (21.3%) |
Health Insurance Coverage by Household Income in Heber Springs
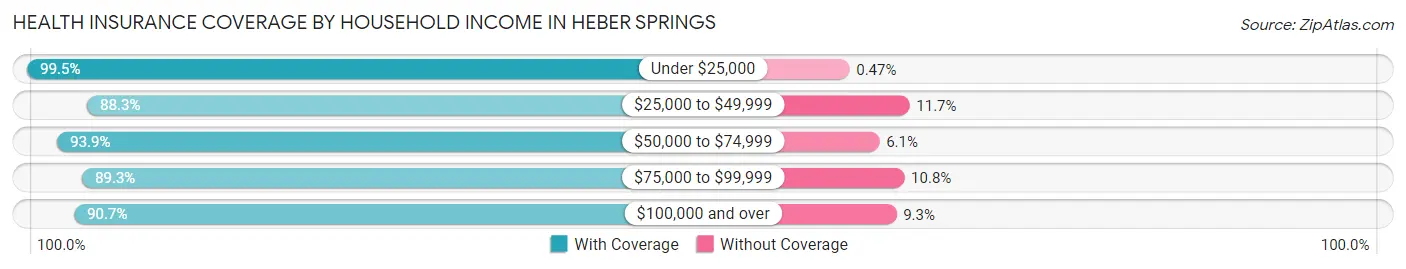
| Household Income | With Coverage | Without Coverage |
| Under $25,000 | 1,058 (99.5%) | 5 (0.5%) |
| $25,000 to $49,999 | 1,604 (88.3%) | 213 (11.7%) |
| $50,000 to $74,999 | 1,685 (93.9%) | 109 (6.1%) |
| $75,000 to $99,999 | 1,021 (89.2%) | 123 (10.7%) |
| $100,000 and over | 853 (90.7%) | 87 (9.3%) |
Public vs Private Health Insurance Coverage by Age in Heber Springs
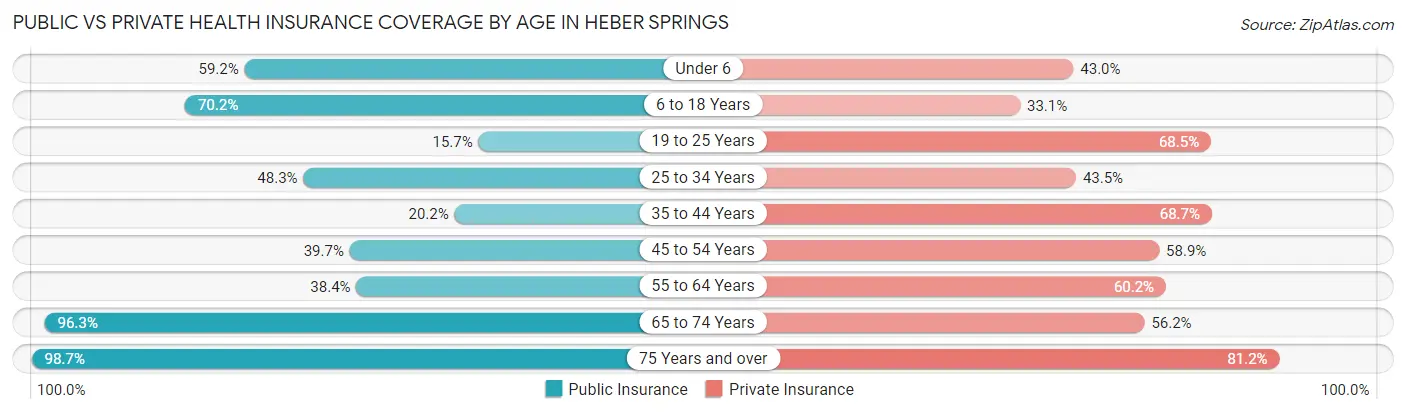
| Age Bracket | Public Insurance | Private Insurance |
| Under 6 | 274 (59.2%) | 199 (43.0%) |
| 6 to 18 Years | 658 (70.2%) | 310 (33.1%) |
| 19 to 25 Years | 85 (15.7%) | 370 (68.5%) |
| 25 to 34 Years | 454 (48.2%) | 409 (43.5%) |
| 35 to 44 Years | 158 (20.2%) | 537 (68.7%) |
| 45 to 54 Years | 247 (39.7%) | 367 (58.9%) |
| 55 to 64 Years | 378 (38.4%) | 592 (60.2%) |
| 65 to 74 Years | 545 (96.3%) | 318 (56.2%) |
| 75 Years and over | 915 (98.7%) | 753 (81.2%) |
| Total | 3,714 (54.9%) | 3,855 (57.0%) |
Disability Status by Sex by Age in Heber Springs
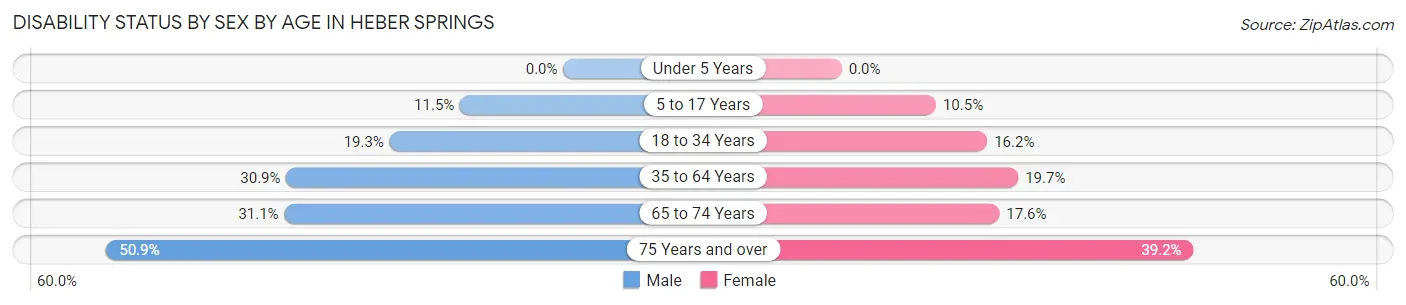
| Age Bracket | Male | Female |
| Under 5 Years | 0 (0.0%) | 0 (0.0%) |
| 5 to 17 Years | 74 (11.5%) | 30 (10.5%) |
| 18 to 34 Years | 176 (19.3%) | 109 (16.2%) |
| 35 to 64 Years | 368 (30.8%) | 235 (19.7%) |
| 65 to 74 Years | 82 (31.1%) | 53 (17.5%) |
| 75 Years and over | 169 (50.9%) | 233 (39.2%) |
Disability Class by Sex by Age in Heber Springs
Disability Class: Hearing Difficulty
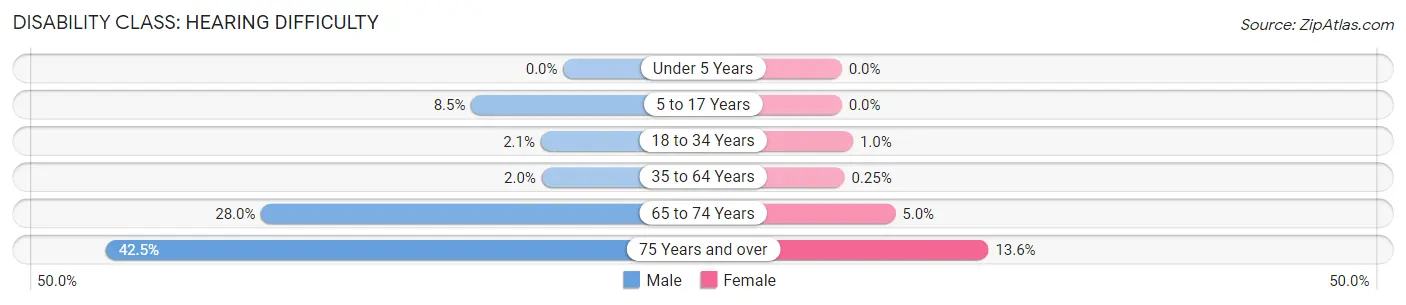
| Age Bracket | Male | Female |
| Under 5 Years | 0 (0.0%) | 0 (0.0%) |
| 5 to 17 Years | 55 (8.5%) | 0 (0.0%) |
| 18 to 34 Years | 19 (2.1%) | 7 (1.0%) |
| 35 to 64 Years | 24 (2.0%) | 3 (0.3%) |
| 65 to 74 Years | 74 (28.0%) | 15 (5.0%) |
| 75 Years and over | 141 (42.5%) | 81 (13.6%) |
Disability Class: Vision Difficulty
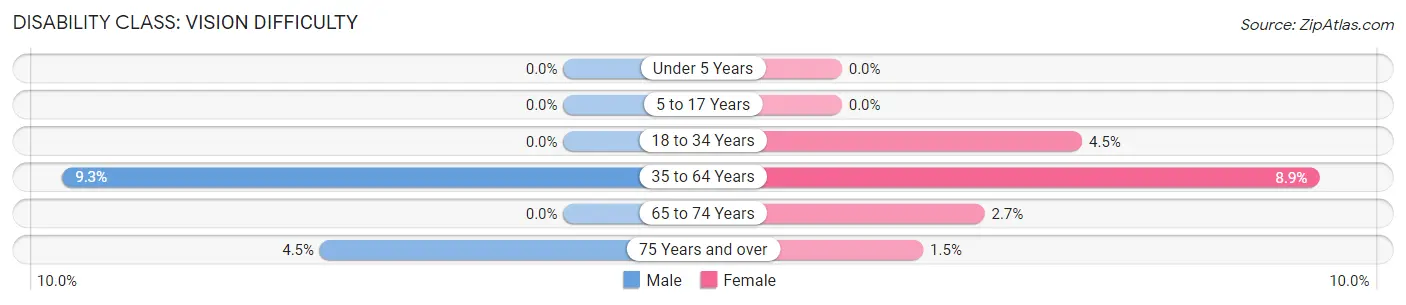
| Age Bracket | Male | Female |
| Under 5 Years | 0 (0.0%) | 0 (0.0%) |
| 5 to 17 Years | 0 (0.0%) | 0 (0.0%) |
| 18 to 34 Years | 0 (0.0%) | 30 (4.5%) |
| 35 to 64 Years | 111 (9.3%) | 106 (8.9%) |
| 65 to 74 Years | 0 (0.0%) | 8 (2.6%) |
| 75 Years and over | 15 (4.5%) | 9 (1.5%) |
Disability Class: Cognitive Difficulty
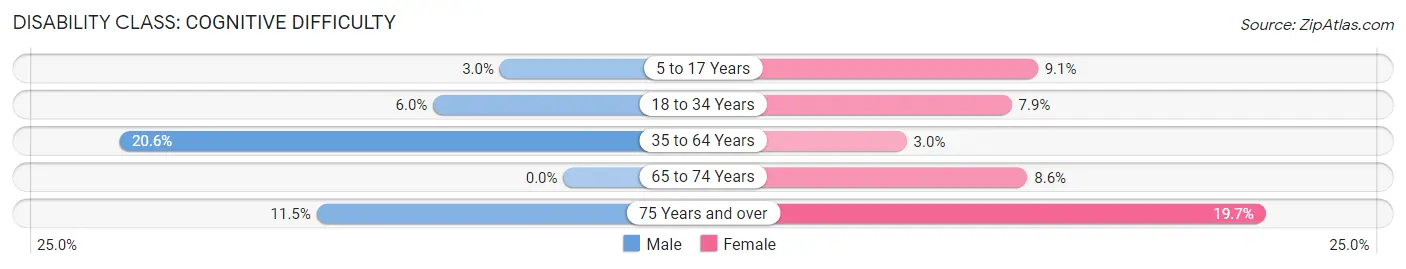
| Age Bracket | Male | Female |
| 5 to 17 Years | 19 (2.9%) | 26 (9.1%) |
| 18 to 34 Years | 55 (6.0%) | 53 (7.9%) |
| 35 to 64 Years | 246 (20.6%) | 36 (3.0%) |
| 65 to 74 Years | 0 (0.0%) | 26 (8.6%) |
| 75 Years and over | 38 (11.5%) | 117 (19.7%) |
Disability Class: Ambulatory Difficulty
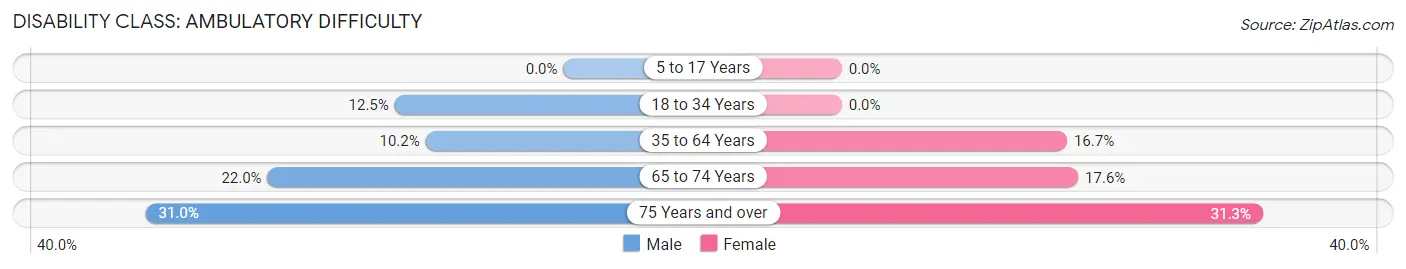
| Age Bracket | Male | Female |
| 5 to 17 Years | 0 (0.0%) | 0 (0.0%) |
| 18 to 34 Years | 114 (12.5%) | 0 (0.0%) |
| 35 to 64 Years | 122 (10.2%) | 200 (16.7%) |
| 65 to 74 Years | 58 (22.0%) | 53 (17.5%) |
| 75 Years and over | 103 (31.0%) | 186 (31.3%) |
Disability Class: Self-Care Difficulty
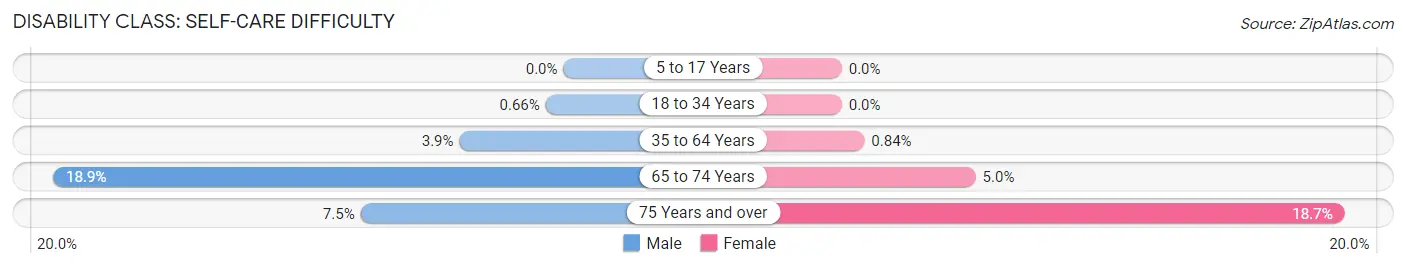
| Age Bracket | Male | Female |
| 5 to 17 Years | 0 (0.0%) | 0 (0.0%) |
| 18 to 34 Years | 6 (0.7%) | 0 (0.0%) |
| 35 to 64 Years | 46 (3.9%) | 10 (0.8%) |
| 65 to 74 Years | 50 (18.9%) | 15 (5.0%) |
| 75 Years and over | 25 (7.5%) | 111 (18.7%) |
Technology Access in Heber Springs
Computing Device Access in Heber Springs
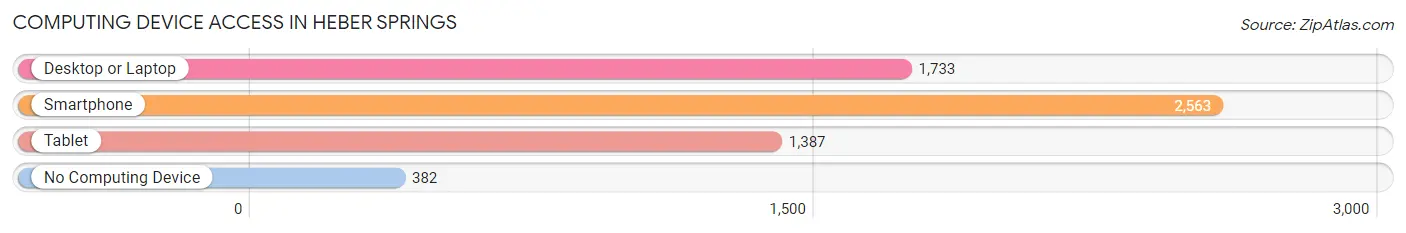
| Device Type | # Households | % Households |
| Desktop or Laptop | 1,733 | 56.2% |
| Smartphone | 2,563 | 83.1% |
| Tablet | 1,387 | 45.0% |
| No Computing Device | 382 | 12.4% |
| Total | 3,084 | 100.0% |
Internet Access in Heber Springs
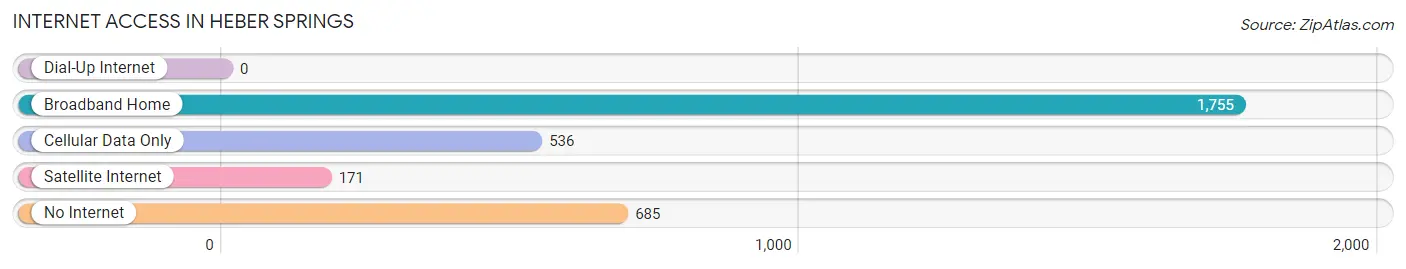
| Internet Type | # Households | % Households |
| Dial-Up Internet | 0 | 0.0% |
| Broadband Home | 1,755 | 56.9% |
| Cellular Data Only | 536 | 17.4% |
| Satellite Internet | 171 | 5.5% |
| No Internet | 685 | 22.2% |
| Total | 3,084 | 100.0% |
Heber Springs Summary
Heber Springs, Arkansas is a city located in Cleburne County in the foothills of the Ozark Mountains. It is situated on the Little Red River, which is a popular destination for fishing, canoeing, and other recreational activities. The city is home to approximately 7,000 people and is the county seat of Cleburne County.
History
Heber Springs was founded in 1875 by William Heber Springs, a former Confederate soldier. Heber Springs was originally known as Sugar Loaf, but the name was changed to Heber Springs in 1876. The city was incorporated in 1881 and was named after William Heber Springs.
The city was a popular resort destination in the late 19th and early 20th centuries. It was known for its mineral springs, which were believed to have healing properties. The city was also home to a number of resorts, including the Heber Springs Hotel, which was built in 1885.
Geography
Heber Springs is located in the foothills of the Ozark Mountains in north-central Arkansas. The city is situated on the Little Red River, which is a popular destination for fishing, canoeing, and other recreational activities. The city is located approximately 50 miles north of Little Rock and is part of the Little Rock-North Little Rock-Conway Metropolitan Statistical Area.
The city has a total area of 8.2 square miles, of which 8.1 square miles is land and 0.1 square miles is water. The city is located at an elevation of 545 feet above sea level.
Economy
Heber Springs is a small city with a diverse economy. The city is home to a number of manufacturing and industrial businesses, including a paper mill, a plastics plant, and a furniture factory. The city is also home to a number of retail businesses, including a Walmart Supercenter, a Lowe’s Home Improvement store, and a variety of restaurants and shops.
The city is also home to a number of tourist attractions, including the Heber Springs Historic District, the Little Red River, and Greers Ferry Lake. The city is also home to a number of recreational activities, including fishing, canoeing, and camping.
Demographics
As of the 2010 census, the population of Heber Springs was 7,165. The racial makeup of the city was 87.3% White, 8.2% African American, 0.4% Native American, 0.7% Asian, 0.1% Pacific Islander, 1.2% from other races, and 2.1% from two or more races. Hispanic or Latino of any race were 3.2% of the population.
The median income for a household in the city was $31,944, and the median income for a family was $41,250. The per capita income for the city was $17,845. About 16.2% of families and 20.2% of the population were below the poverty line, including 28.2% of those under age 18 and 11.2% of those age 65 or over.
Common Questions
What is Per Capita Income in Heber Springs?
Per Capita income in Heber Springs is $30,995.
What is the Median Family Income in Heber Springs?
Median Family Income in Heber Springs is $58,442.
What is the Median Household income in Heber Springs?
Median Household Income in Heber Springs is $50,472.
What is Income or Wage Gap in Heber Springs?
Income or Wage Gap in Heber Springs is 43.5%.
Women in Heber Springs earn 56.5 cents for every dollar earned by a man.
What is Inequality or Gini Index in Heber Springs?
Inequality or Gini Index in Heber Springs is 0.45.
What is the Total Population of Heber Springs?
Total Population of Heber Springs is 7,066.
What is the Total Male Population of Heber Springs?
Total Male Population of Heber Springs is 3,698.
What is the Total Female Population of Heber Springs?
Total Female Population of Heber Springs is 3,368.
What is the Ratio of Males per 100 Females in Heber Springs?
There are 109.80 Males per 100 Females in Heber Springs.
What is the Ratio of Females per 100 Males in Heber Springs?
There are 91.08 Females per 100 Males in Heber Springs.
What is the Median Population Age in Heber Springs?
Median Population Age in Heber Springs is 43.1 Years.
What is the Average Family Size in Heber Springs
Average Family Size in Heber Springs is 2.9 People.
What is the Average Household Size in Heber Springs
Average Household Size in Heber Springs is 2.2 People.
How Large is the Labor Force in Heber Springs?
There are 2,972 People in the Labor Forcein in Heber Springs.
What is the Percentage of People in the Labor Force in Heber Springs?
49.8% of People are in the Labor Force in Heber Springs.
What is the Unemployment Rate in Heber Springs?
Unemployment Rate in Heber Springs is 5.6%.