Greenway, AR
Greenway Map
Greenway Overview
171
TOTAL POPULATION
85
MALE POPULATION
86
FEMALE POPULATION
98.84
MALES / 100 FEMALES
101.18
FEMALES / 100 MALES
35.8
MEDIAN AGE
5.0
AVG FAMILY SIZE
2.9
AVG HOUSEHOLD SIZE
$13,614
PER CAPITA INCOME
$42,292
AVG FAMILY INCOME
$30,625
AVG HOUSEHOLD INCOME
0.46
INEQUALITY / GINI INDEX
51
LABOR FORCE [ PEOPLE ]
36.2%
PERCENT IN LABOR FORCE
Greenway Zip Codes
Greenway Area Codes
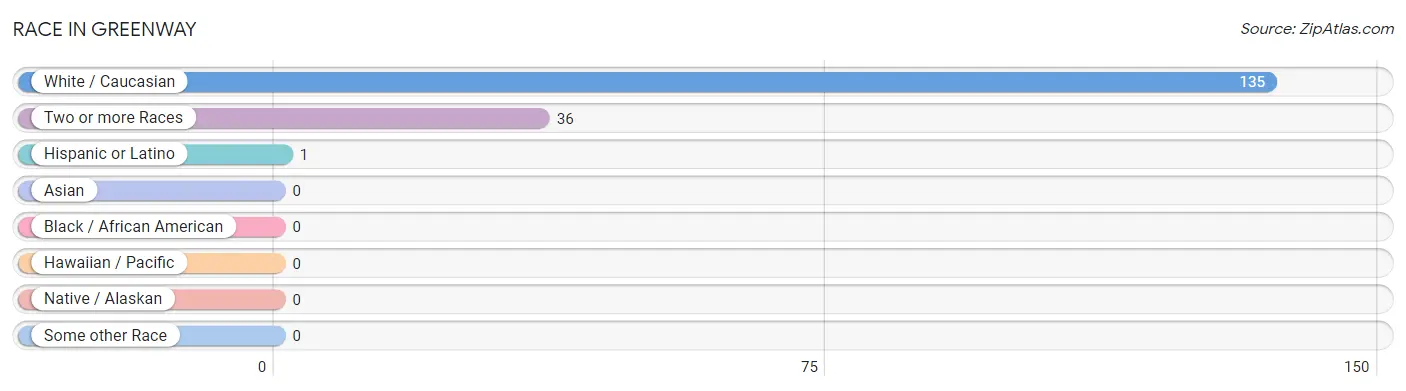
Race in Greenway
The most populous races in Greenway are White / Caucasian (135 | 78.9%), Two or more Races (36 | 21.0%), and Hispanic or Latino (1 | 0.6%).
| Race | # Population | % Population |
| Asian | 0 | 0.0% |
| Black / African American | 0 | 0.0% |
| Hawaiian / Pacific | 0 | 0.0% |
| Hispanic or Latino | 1 | 0.6% |
| Native / Alaskan | 0 | 0.0% |
| White / Caucasian | 135 | 78.9% |
| Two or more Races | 36 | 21.0% |
| Some other Race | 0 | 0.0% |
| Total | 171 | 100.0% |
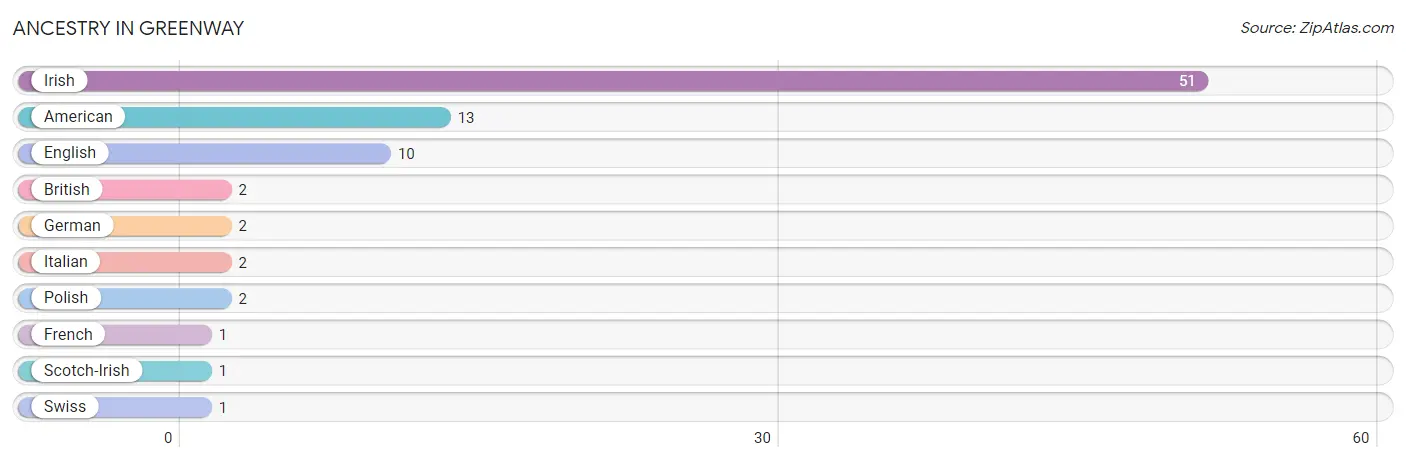
Ancestry in Greenway
The most populous ancestries reported in Greenway are Irish (51 | 29.8%), American (13 | 7.6%), English (10 | 5.9%), British (2 | 1.2%), and German (2 | 1.2%), together accounting for 45.6% of all Greenway residents.
| Ancestry | # Population | % Population |
| American | 13 | 7.6% |
| British | 2 | 1.2% |
| English | 10 | 5.9% |
| French | 1 | 0.6% |
| German | 2 | 1.2% |
| Irish | 51 | 29.8% |
| Italian | 2 | 1.2% |
| Polish | 2 | 1.2% |
| Scotch-Irish | 1 | 0.6% |
| Swiss | 1 | 0.6% | View All 10 Rows |
Immigrants in Greenway

| Immigration Origin | # Population | % Population | View All 0 Rows |
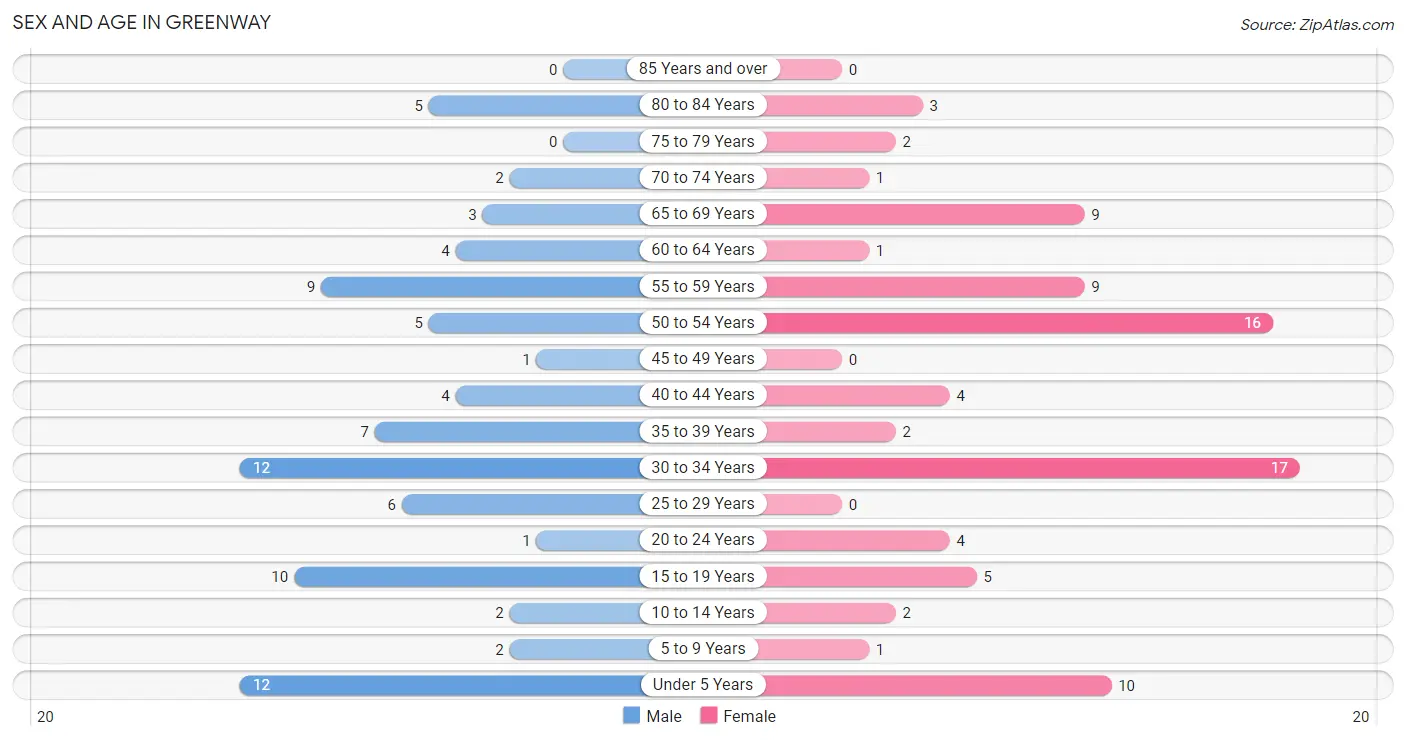
Sex and Age in Greenway
Sex and Age in Greenway
The most populous age groups in Greenway are Under 5 Years (12 | 14.1%) for men and 30 to 34 Years (17 | 19.8%) for women.
| Age Bracket | Male | Female |
| Under 5 Years | 12 (14.1%) | 10 (11.6%) |
| 5 to 9 Years | 2 (2.4%) | 1 (1.2%) |
| 10 to 14 Years | 2 (2.4%) | 2 (2.3%) |
| 15 to 19 Years | 10 (11.8%) | 5 (5.8%) |
| 20 to 24 Years | 1 (1.2%) | 4 (4.6%) |
| 25 to 29 Years | 6 (7.1%) | 0 (0.0%) |
| 30 to 34 Years | 12 (14.1%) | 17 (19.8%) |
| 35 to 39 Years | 7 (8.2%) | 2 (2.3%) |
| 40 to 44 Years | 4 (4.7%) | 4 (4.6%) |
| 45 to 49 Years | 1 (1.2%) | 0 (0.0%) |
| 50 to 54 Years | 5 (5.9%) | 16 (18.6%) |
| 55 to 59 Years | 9 (10.6%) | 9 (10.5%) |
| 60 to 64 Years | 4 (4.7%) | 1 (1.2%) |
| 65 to 69 Years | 3 (3.5%) | 9 (10.5%) |
| 70 to 74 Years | 2 (2.4%) | 1 (1.2%) |
| 75 to 79 Years | 0 (0.0%) | 2 (2.3%) |
| 80 to 84 Years | 5 (5.9%) | 3 (3.5%) |
| 85 Years and over | 0 (0.0%) | 0 (0.0%) |
| Total | 85 (100.0%) | 86 (100.0%) |
Families and Households in Greenway
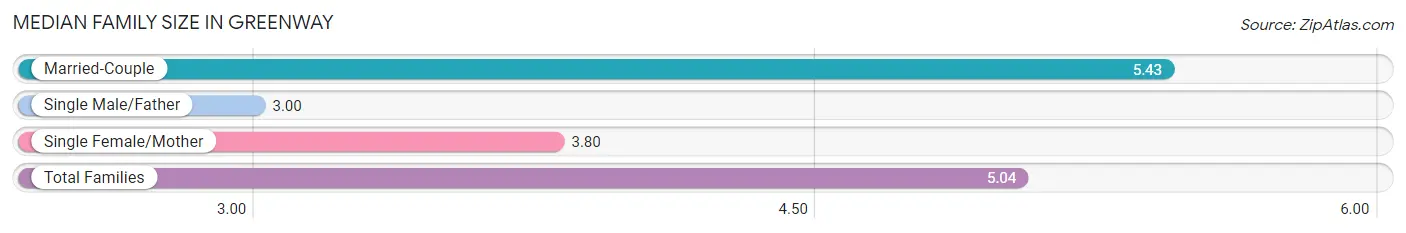
Median Family Size in Greenway
The median family size in Greenway is 5.04 persons per family, with married-couple families (21 | 77.8%) accounting for the largest median family size of 5.43 persons per family. On the other hand, single male/father families (1 | 3.7%) represent the smallest median family size with 3.00 persons per family.
| Family Type | # Families | Family Size |
| Married-Couple | 21 (77.8%) | 5.43 |
| Single Male/Father | 1 (3.7%) | 3.00 |
| Single Female/Mother | 5 (18.5%) | 3.80 |
| Total Families | 27 (100.0%) | 5.04 |
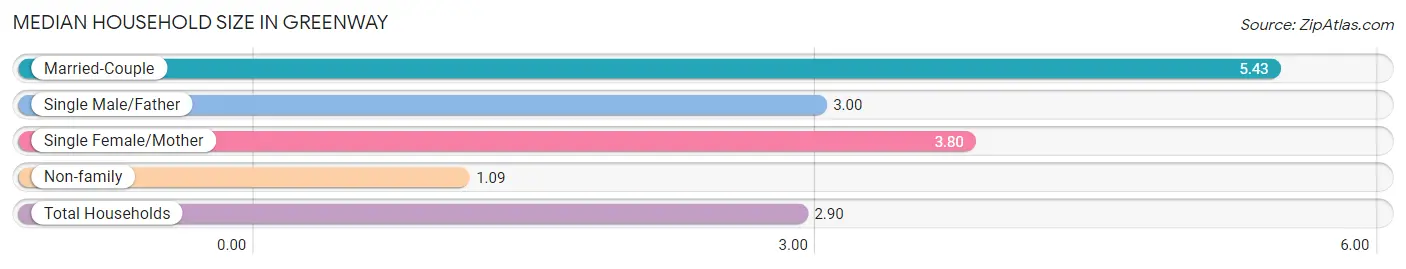
Median Household Size in Greenway
The median household size in Greenway is 2.90 persons per household, with married-couple households (21 | 35.6%) accounting for the largest median household size of 5.43 persons per household. non-family households (32 | 54.2%) represent the smallest median household size with 1.09 persons per household.
| Household Type | # Households | Household Size |
| Married-Couple | 21 (35.6%) | 5.43 |
| Single Male/Father | 1 (1.7%) | 3.00 |
| Single Female/Mother | 5 (8.5%) | 3.80 |
| Non-family | 32 (54.2%) | 1.09 |
| Total Households | 59 (100.0%) | 2.90 |
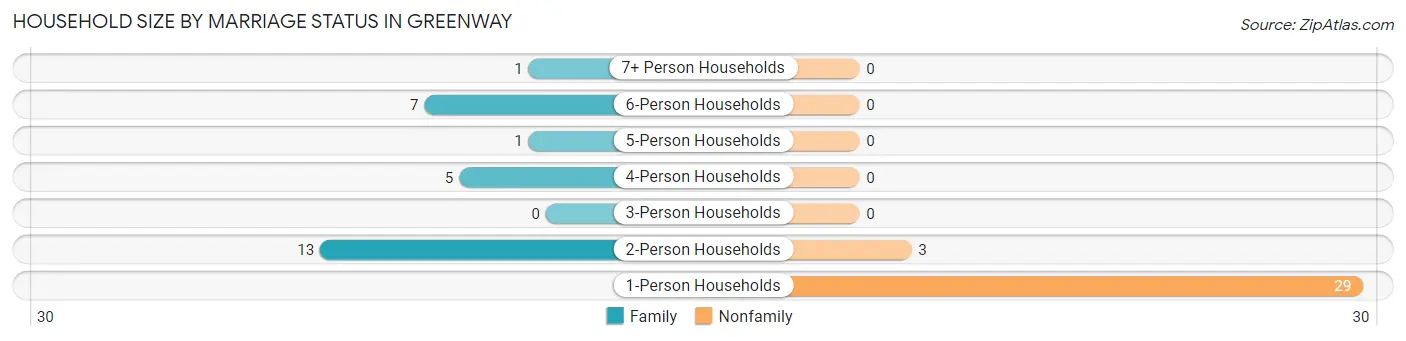
Household Size by Marriage Status in Greenway
Out of a total of 59 households in Greenway, 27 (45.8%) are family households, while 32 (54.2%) are nonfamily households. The most numerous type of family households are 2-person households, comprising 13, and the most common type of nonfamily households are 1-person households, comprising 29.
| Household Size | Family Households | Nonfamily Households |
| 1-Person Households | - | 29 (49.1%) |
| 2-Person Households | 13 (22.0%) | 3 (5.1%) |
| 3-Person Households | 0 (0.0%) | 0 (0.0%) |
| 4-Person Households | 5 (8.5%) | 0 (0.0%) |
| 5-Person Households | 1 (1.7%) | 0 (0.0%) |
| 6-Person Households | 7 (11.9%) | 0 (0.0%) |
| 7+ Person Households | 1 (1.7%) | 0 (0.0%) |
| Total | 27 (45.8%) | 32 (54.2%) |
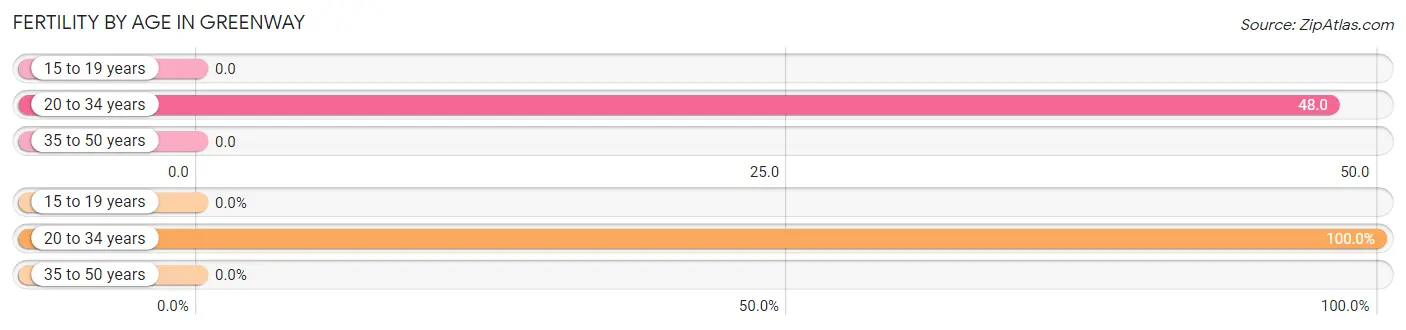
Female Fertility in Greenway
Fertility by Age in Greenway
Average fertility rate in Greenway is 31.0 births per 1,000 women. Women in the age bracket of 20 to 34 years have the highest fertility rate with 48.0 births per 1,000 women. Women in the age bracket of 20 to 34 years acount for 100.0% of all women with births.
| Age Bracket | Women with Births | Births / 1,000 Women |
| 15 to 19 years | 0 (0.0%) | 0.0 |
| 20 to 34 years | 1 (100.0%) | 48.0 |
| 35 to 50 years | 0 (0.0%) | 0.0 |
| Total | 1 (100.0%) | 31.0 |
Fertility by Age by Marriage Status in Greenway
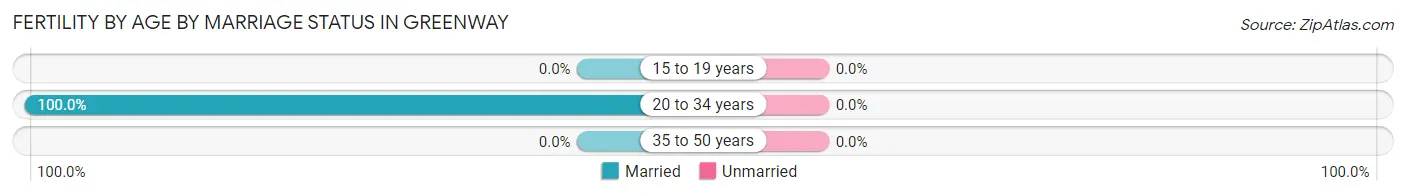
| Age Bracket | Married | Unmarried |
| 15 to 19 years | 0 (0.0%) | 0 (0.0%) |
| 20 to 34 years | 1 (100.0%) | 0 (0.0%) |
| 35 to 50 years | 0 (0.0%) | 0 (0.0%) |
| Total | 1 (100.0%) | 0 (0.0%) |
Fertility by Education in Greenway
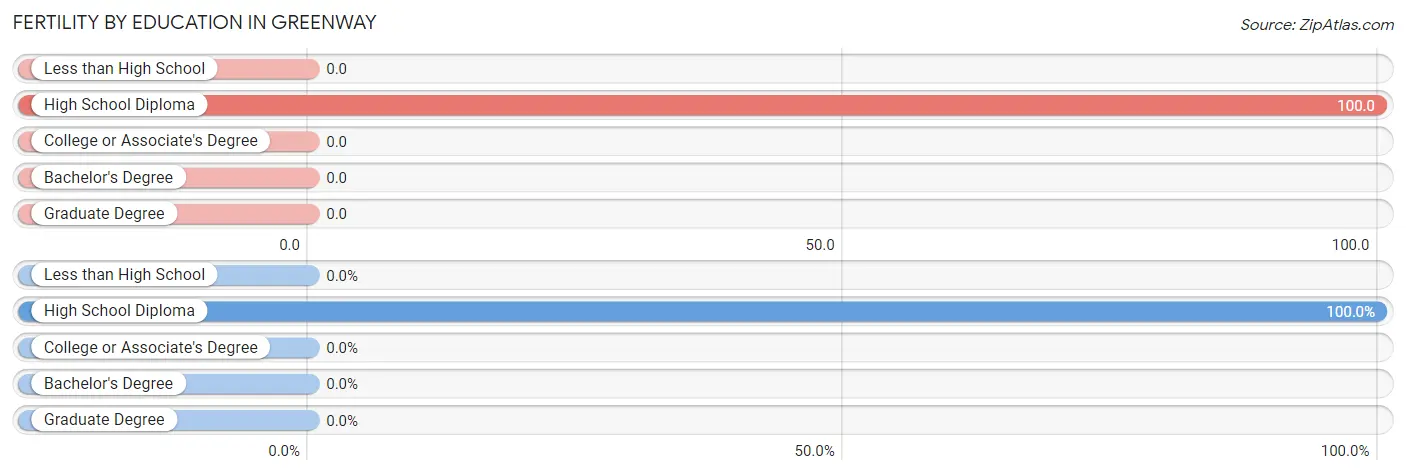
| Educational Attainment | Women with Births | Births / 1,000 Women |
| Less than High School | 0 (0.0%) | 0.0 |
| High School Diploma | 1 (100.0%) | 100.0 |
| College or Associate's Degree | 0 (0.0%) | 0.0 |
| Bachelor's Degree | 0 (0.0%) | 0.0 |
| Graduate Degree | 0 (0.0%) | 0.0 |
| Total | 1 (100.0%) | 31.0 |
Fertility by Education by Marriage Status in Greenway
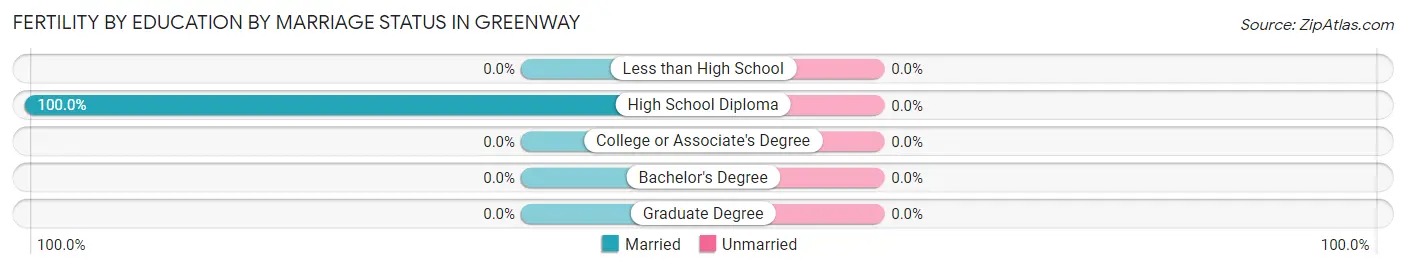
| Educational Attainment | Married | Unmarried |
| Less than High School | 0 (0.0%) | 0 (0.0%) |
| High School Diploma | 1 (100.0%) | 0 (0.0%) |
| College or Associate's Degree | 0 (0.0%) | 0 (0.0%) |
| Bachelor's Degree | 0 (0.0%) | 0 (0.0%) |
| Graduate Degree | 0 (0.0%) | 0 (0.0%) |
| Total | 1 (100.0%) | 0 (0.0%) |
Income in Greenway
Income Overview in Greenway
Per Capita Income in Greenway is $13,614, while median incomes of families and households are $42,292 and $30,625 respectively.
| Characteristic | Number | Measure |
| Per Capita Income | 171 | $13,614 |
| Median Family Income | 27 | $42,292 |
| Mean Family Income | 27 | $50,670 |
| Median Household Income | 59 | $30,625 |
| Mean Household Income | 59 | $32,514 |
| Income Deficit | 27 | $0 |
| Wage / Income Gap (%) | 171 | 0.00% |
| Wage / Income Gap ($) | 171 | 100.00¢ per $1 |
| Gini / Inequality Index | 171 | 0.46 |
Earnings by Sex in Greenway
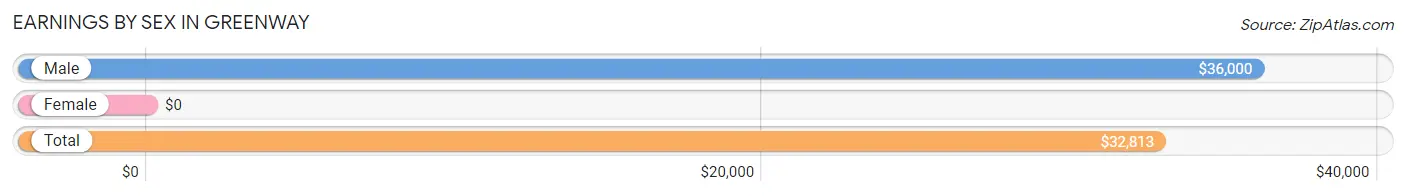
| Sex | Number | Average Earnings |
| Male | 48 (76.2%) | $36,000 |
| Female | 15 (23.8%) | $0 |
| Total | 63 (100.0%) | $32,813 |
Earnings by Sex by Income Bracket in Greenway
The most common earnings brackets in Greenway are $35,000 to $39,999 for men (16 | 33.3%) and $5,000 to $7,499 for women (5 | 33.3%).
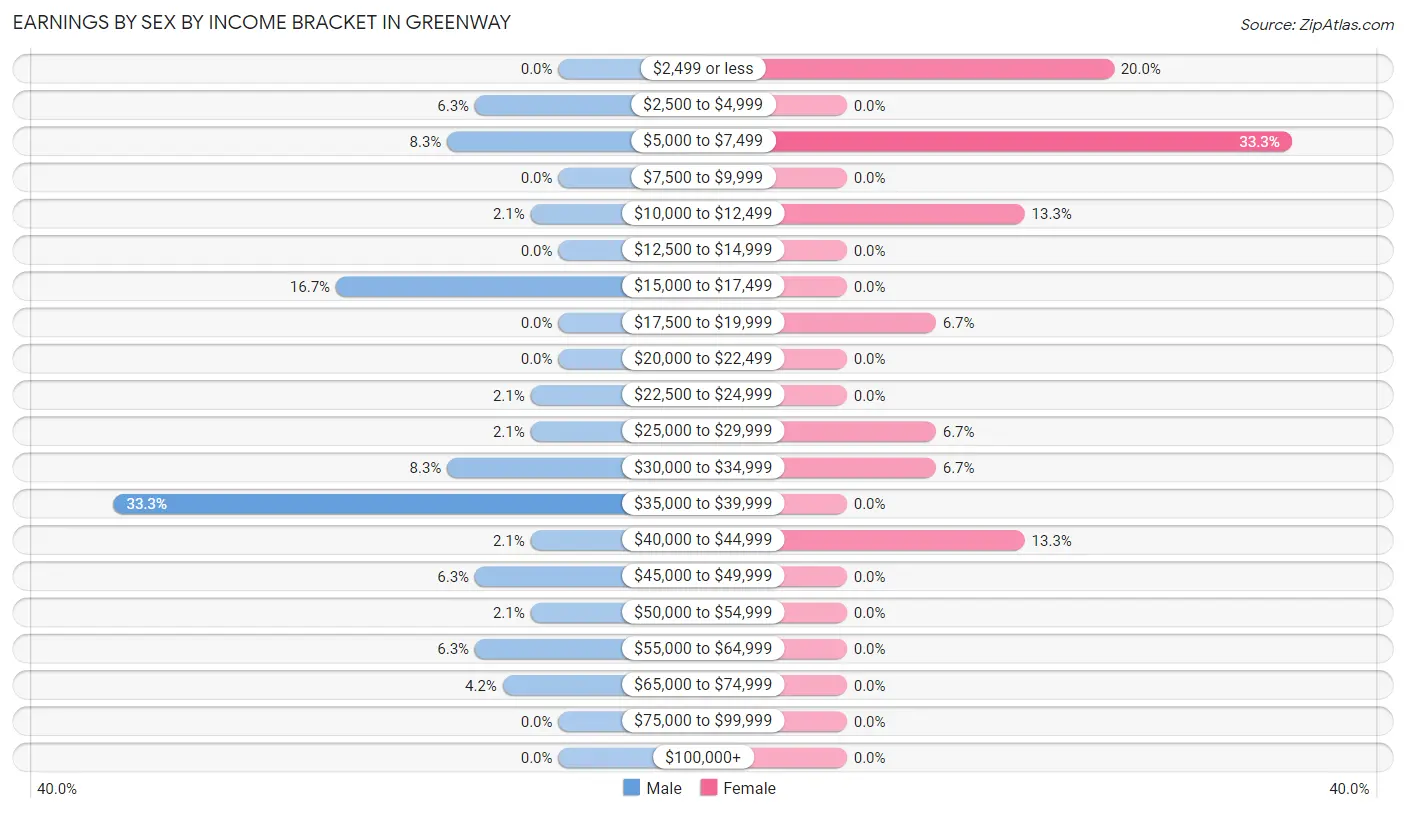
| Income | Male | Female |
| $2,499 or less | 0 (0.0%) | 3 (20.0%) |
| $2,500 to $4,999 | 3 (6.2%) | 0 (0.0%) |
| $5,000 to $7,499 | 4 (8.3%) | 5 (33.3%) |
| $7,500 to $9,999 | 0 (0.0%) | 0 (0.0%) |
| $10,000 to $12,499 | 1 (2.1%) | 2 (13.3%) |
| $12,500 to $14,999 | 0 (0.0%) | 0 (0.0%) |
| $15,000 to $17,499 | 8 (16.7%) | 0 (0.0%) |
| $17,500 to $19,999 | 0 (0.0%) | 1 (6.7%) |
| $20,000 to $22,499 | 0 (0.0%) | 0 (0.0%) |
| $22,500 to $24,999 | 1 (2.1%) | 0 (0.0%) |
| $25,000 to $29,999 | 1 (2.1%) | 1 (6.7%) |
| $30,000 to $34,999 | 4 (8.3%) | 1 (6.7%) |
| $35,000 to $39,999 | 16 (33.3%) | 0 (0.0%) |
| $40,000 to $44,999 | 1 (2.1%) | 2 (13.3%) |
| $45,000 to $49,999 | 3 (6.2%) | 0 (0.0%) |
| $50,000 to $54,999 | 1 (2.1%) | 0 (0.0%) |
| $55,000 to $64,999 | 3 (6.2%) | 0 (0.0%) |
| $65,000 to $74,999 | 2 (4.2%) | 0 (0.0%) |
| $75,000 to $99,999 | 0 (0.0%) | 0 (0.0%) |
| $100,000+ | 0 (0.0%) | 0 (0.0%) |
| Total | 48 (100.0%) | 15 (100.0%) |
Earnings by Sex by Educational Attainment in Greenway
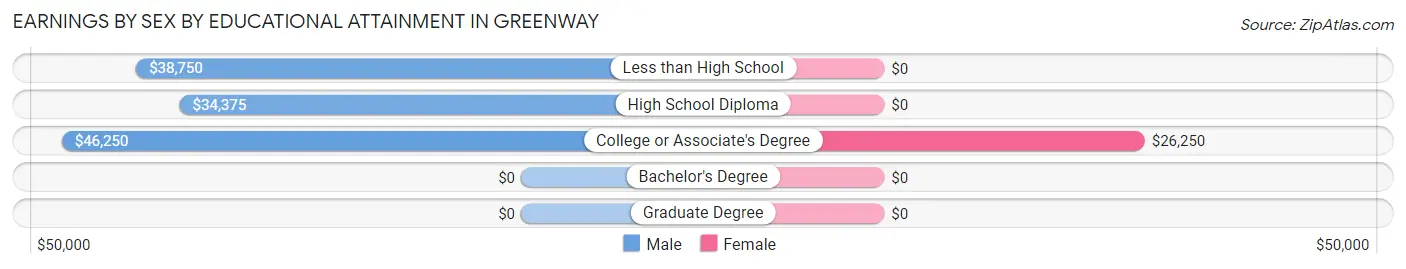
| Educational Attainment | Male Income | Female Income |
| Less than High School | $38,750 | $0 |
| High School Diploma | $34,375 | $0 |
| College or Associate's Degree | $46,250 | $26,250 |
| Bachelor's Degree | - | - |
| Graduate Degree | - | - |
| Total | $37,841 | $0 |
Family Income in Greenway
Family Income Brackets in Greenway
According to the Greenway family income data, there are 8 families falling into the $50,000 to $74,999 income range, which is the most common income bracket and makes up 29.6% of all families.
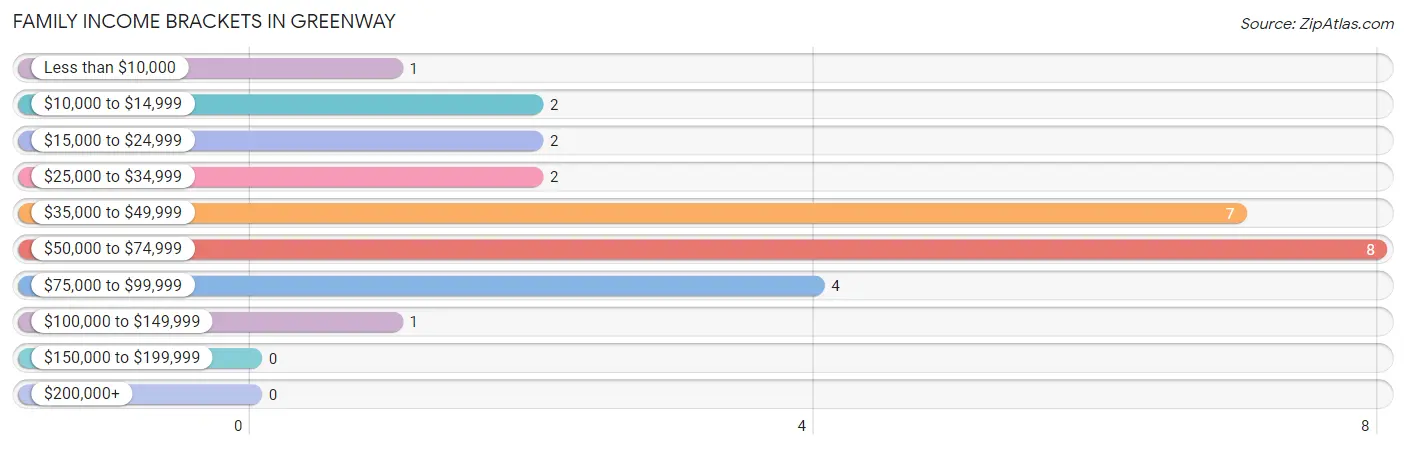
| Income Bracket | # Families | % Families |
| Less than $10,000 | 1 | 3.7% |
| $10,000 to $14,999 | 2 | 7.4% |
| $15,000 to $24,999 | 2 | 7.4% |
| $25,000 to $34,999 | 2 | 7.4% |
| $35,000 to $49,999 | 7 | 25.9% |
| $50,000 to $74,999 | 8 | 29.6% |
| $75,000 to $99,999 | 4 | 14.8% |
| $100,000 to $149,999 | 1 | 3.7% |
| $150,000 to $199,999 | 0 | 0.0% |
| $200,000+ | 0 | 0.0% |
Family Income by Famaliy Size in Greenway
4-person families (5 | 18.5%) account for the highest median family income in Greenway with $73,750 per family, while 4-person families (5 | 18.5%) have the highest median income of $18,438 per family member.
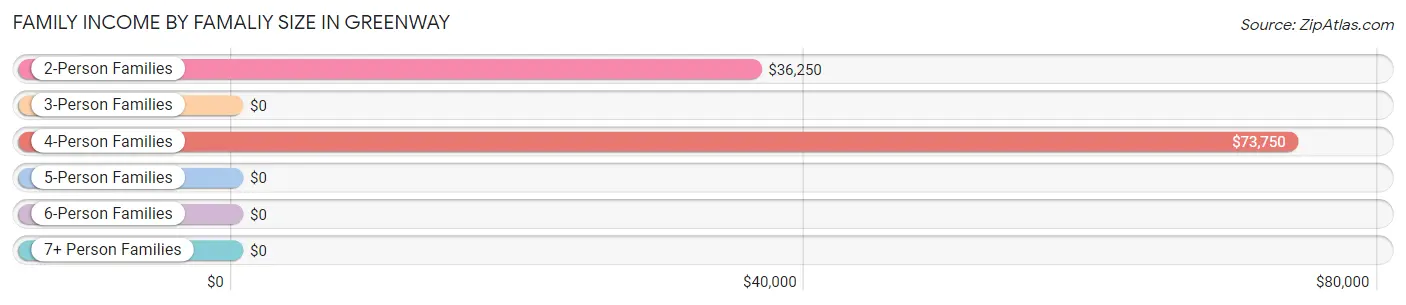
| Income Bracket | # Families | Median Income |
| 2-Person Families | 13 (48.1%) | $36,250 |
| 3-Person Families | 0 (0.0%) | $0 |
| 4-Person Families | 5 (18.5%) | $73,750 |
| 5-Person Families | 1 (3.7%) | $0 |
| 6-Person Families | 7 (25.9%) | $0 |
| 7+ Person Families | 1 (3.7%) | $0 |
| Total | 27 (100.0%) | $42,292 |
Family Income by Number of Earners in Greenway
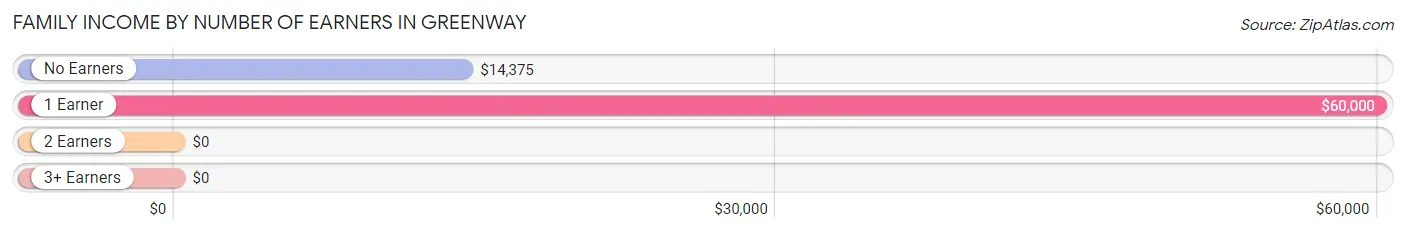
| Number of Earners | # Families | Median Income |
| No Earners | 3 (11.1%) | $14,375 |
| 1 Earner | 12 (44.4%) | $60,000 |
| 2 Earners | 10 (37.0%) | $0 |
| 3+ Earners | 2 (7.4%) | $0 |
| Total | 27 (100.0%) | $42,292 |
Household Income in Greenway
Household Income Brackets in Greenway
With 21 households falling in the category, the less than $10,000 income range is the most frequent in Greenway, accounting for 35.6% of all households.
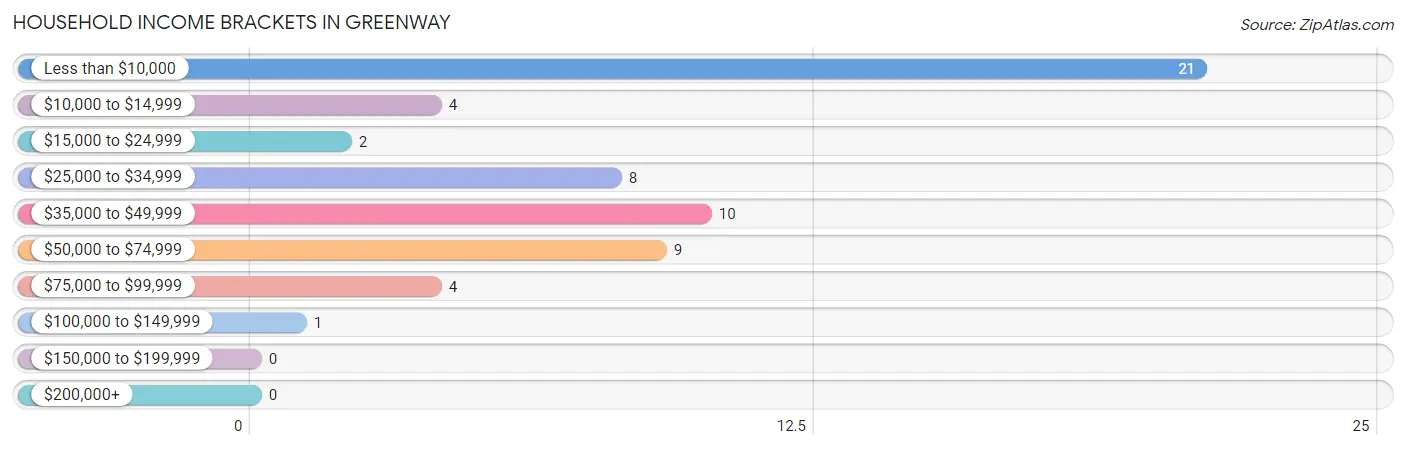
| Income Bracket | # Households | % Households |
| Less than $10,000 | 21 | 35.6% |
| $10,000 to $14,999 | 4 | 6.8% |
| $15,000 to $24,999 | 2 | 3.4% |
| $25,000 to $34,999 | 8 | 13.6% |
| $35,000 to $49,999 | 10 | 16.9% |
| $50,000 to $74,999 | 9 | 15.3% |
| $75,000 to $99,999 | 4 | 6.8% |
| $100,000 to $149,999 | 1 | 1.7% |
| $150,000 to $199,999 | 0 | 0.0% |
| $200,000+ | 0 | 0.0% |
Household Income by Householder Age in Greenway
The median household income in Greenway is $30,625, with the highest median household income of $34,063 found in the 25 to 44 years age bracket for the primary householder. A total of 11 households (18.6%) fall into this category. Meanwhile, the 15 to 24 years age bracket for the primary householder has the lowest median household income of $0, with 2 households (3.4%) in this group.
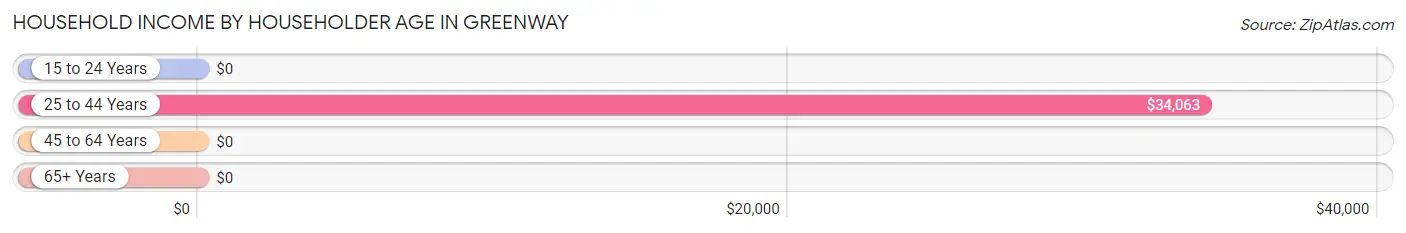
| Income Bracket | # Households | Median Income |
| 15 to 24 Years | 2 (3.4%) | $0 |
| 25 to 44 Years | 11 (18.6%) | $34,063 |
| 45 to 64 Years | 30 (50.8%) | $0 |
| 65+ Years | 16 (27.1%) | $0 |
| Total | 59 (100.0%) | $30,625 |
Poverty in Greenway
Income Below Poverty by Sex and Age in Greenway
With 16.5% poverty level for males and 32.6% for females among the residents of Greenway, 45 to 54 year old males and 75 year old and over females are the most vulnerable to poverty, with 3 males (50.0%) and 5 females (100.0%) in their respective age groups living below the poverty level.
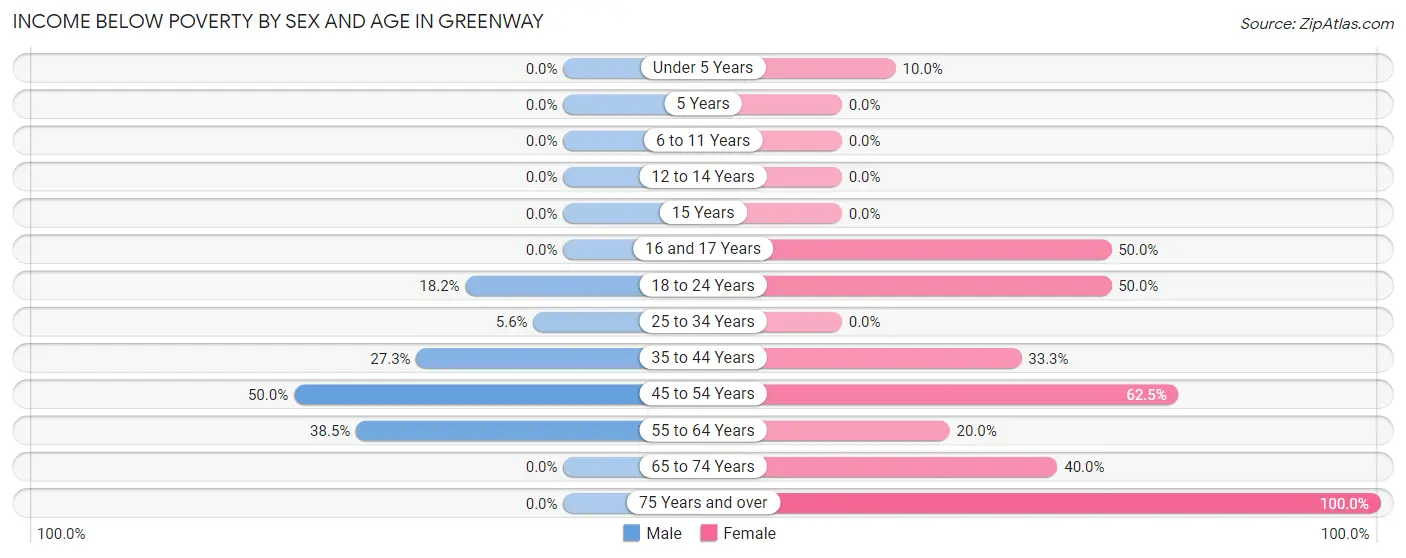
| Age Bracket | Male | Female |
| Under 5 Years | 0 (0.0%) | 1 (10.0%) |
| 5 Years | 0 (0.0%) | 0 (0.0%) |
| 6 to 11 Years | 0 (0.0%) | 0 (0.0%) |
| 12 to 14 Years | 0 (0.0%) | 0 (0.0%) |
| 15 Years | 0 (0.0%) | 0 (0.0%) |
| 16 and 17 Years | 0 (0.0%) | 1 (50.0%) |
| 18 to 24 Years | 2 (18.2%) | 3 (50.0%) |
| 25 to 34 Years | 1 (5.6%) | 0 (0.0%) |
| 35 to 44 Years | 3 (27.3%) | 2 (33.3%) |
| 45 to 54 Years | 3 (50.0%) | 10 (62.5%) |
| 55 to 64 Years | 5 (38.5%) | 2 (20.0%) |
| 65 to 74 Years | 0 (0.0%) | 4 (40.0%) |
| 75 Years and over | 0 (0.0%) | 5 (100.0%) |
| Total | 14 (16.5%) | 28 (32.6%) |
Income Above Poverty by Sex and Age in Greenway
According to the poverty statistics in Greenway, males aged under 5 years and females aged 6 to 11 years are the age groups that are most secure financially, with 100.0% of males and 100.0% of females in these age groups living above the poverty line.
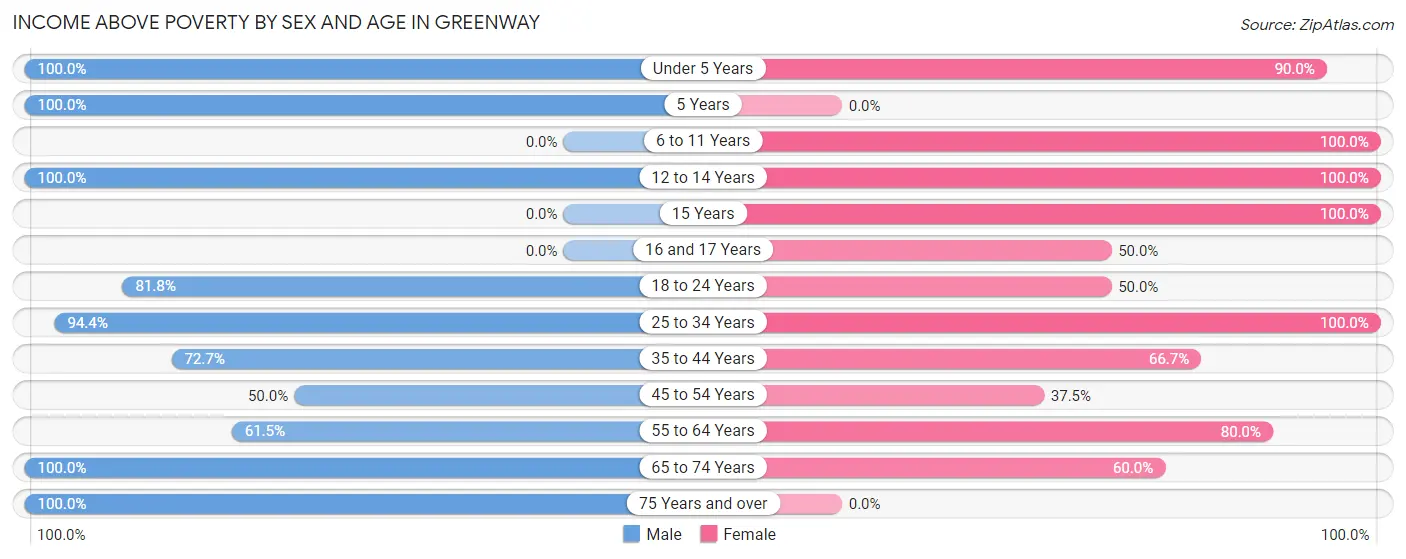
| Age Bracket | Male | Female |
| Under 5 Years | 12 (100.0%) | 9 (90.0%) |
| 5 Years | 2 (100.0%) | 0 (0.0%) |
| 6 to 11 Years | 0 (0.0%) | 2 (100.0%) |
| 12 to 14 Years | 2 (100.0%) | 1 (100.0%) |
| 15 Years | 0 (0.0%) | 1 (100.0%) |
| 16 and 17 Years | 0 (0.0%) | 1 (50.0%) |
| 18 to 24 Years | 9 (81.8%) | 3 (50.0%) |
| 25 to 34 Years | 17 (94.4%) | 17 (100.0%) |
| 35 to 44 Years | 8 (72.7%) | 4 (66.7%) |
| 45 to 54 Years | 3 (50.0%) | 6 (37.5%) |
| 55 to 64 Years | 8 (61.5%) | 8 (80.0%) |
| 65 to 74 Years | 5 (100.0%) | 6 (60.0%) |
| 75 Years and over | 5 (100.0%) | 0 (0.0%) |
| Total | 71 (83.5%) | 58 (67.4%) |
Income Below Poverty Among Married-Couple Families in Greenway
The poverty statistics for married-couple families in Greenway show that 9.5% or 2 of the total 21 families live below the poverty line. Families with no children have the highest poverty rate of 18.2%, comprising of 2 families. On the other hand, families with 1 or 2 children have the lowest poverty rate of 0.0%, which includes 0 families.
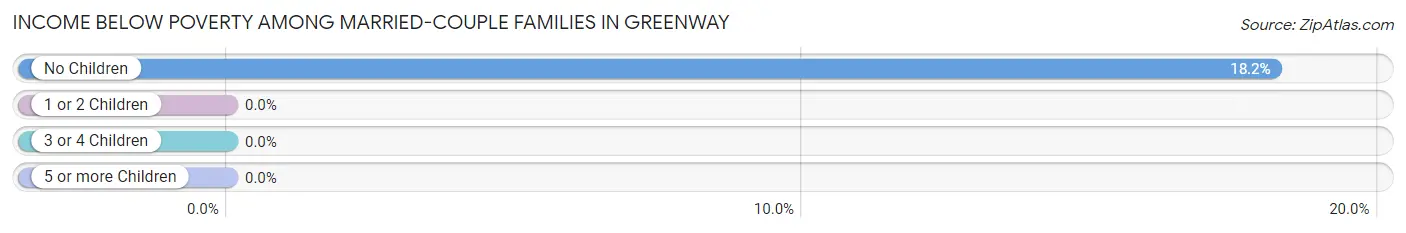
| Children | Above Poverty | Below Poverty |
| No Children | 9 (81.8%) | 2 (18.2%) |
| 1 or 2 Children | 9 (100.0%) | 0 (0.0%) |
| 3 or 4 Children | 1 (100.0%) | 0 (0.0%) |
| 5 or more Children | 0 (0.0%) | 0 (0.0%) |
| Total | 19 (90.5%) | 2 (9.5%) |
Income Below Poverty Among Single-Parent Households in Greenway
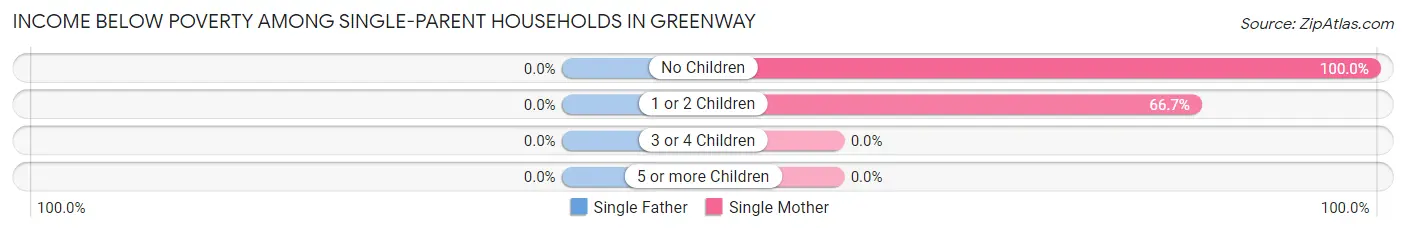
| Children | Single Father | Single Mother |
| No Children | 0 (0.0%) | 1 (100.0%) |
| 1 or 2 Children | 0 (0.0%) | 2 (66.7%) |
| 3 or 4 Children | 0 (0.0%) | 0 (0.0%) |
| 5 or more Children | 0 (0.0%) | 0 (0.0%) |
| Total | 0 (0.0%) | 3 (60.0%) |
Income Below Poverty Among Married-Couple vs Single-Parent Households in Greenway
The poverty data for Greenway shows that 2 of the married-couple family households (9.5%) and 3 of the single-parent households (50.0%) are living below the poverty level. Within the married-couple family households, those with no children have the highest poverty rate, with 2 households (18.2%) falling below the poverty line. Among the single-parent households, those with 1 or 2 children have the highest poverty rate, with 2 household (66.7%) living below poverty.
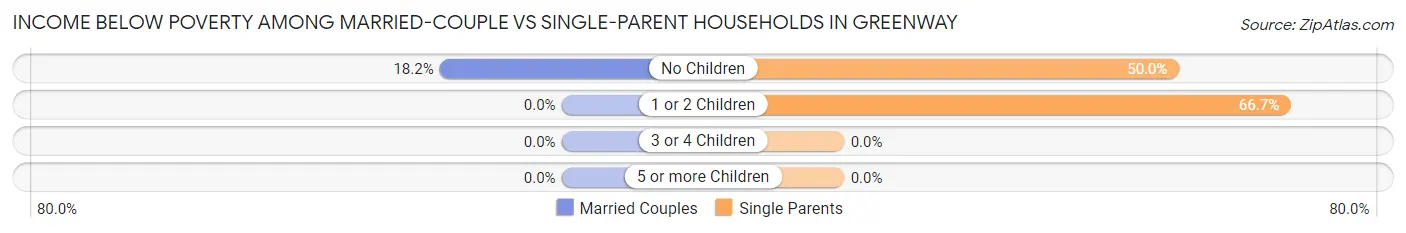
| Children | Married-Couple Families | Single-Parent Households |
| No Children | 2 (18.2%) | 1 (50.0%) |
| 1 or 2 Children | 0 (0.0%) | 2 (66.7%) |
| 3 or 4 Children | 0 (0.0%) | 0 (0.0%) |
| 5 or more Children | 0 (0.0%) | 0 (0.0%) |
| Total | 2 (9.5%) | 3 (50.0%) |
Employment Characteristics in Greenway
Employment by Class of Employer in Greenway
Among the 49 employed individuals in Greenway, private company employees (34 | 69.4%), self-employed (not incorporated) (7 | 14.3%), and not-for-profit organizations (6 | 12.2%) make up the most common classes of employment.
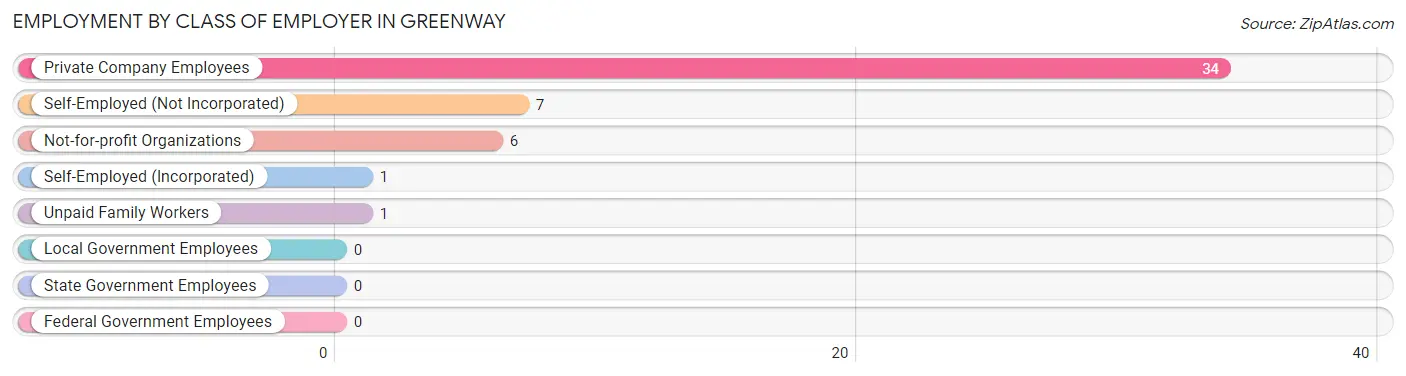
| Employer Class | # Employees | % Employees |
| Private Company Employees | 34 | 69.4% |
| Self-Employed (Incorporated) | 1 | 2.0% |
| Self-Employed (Not Incorporated) | 7 | 14.3% |
| Not-for-profit Organizations | 6 | 12.2% |
| Local Government Employees | 0 | 0.0% |
| State Government Employees | 0 | 0.0% |
| Federal Government Employees | 0 | 0.0% |
| Unpaid Family Workers | 1 | 2.0% |
| Total | 49 | 100.0% |
Employment Status by Age in Greenway
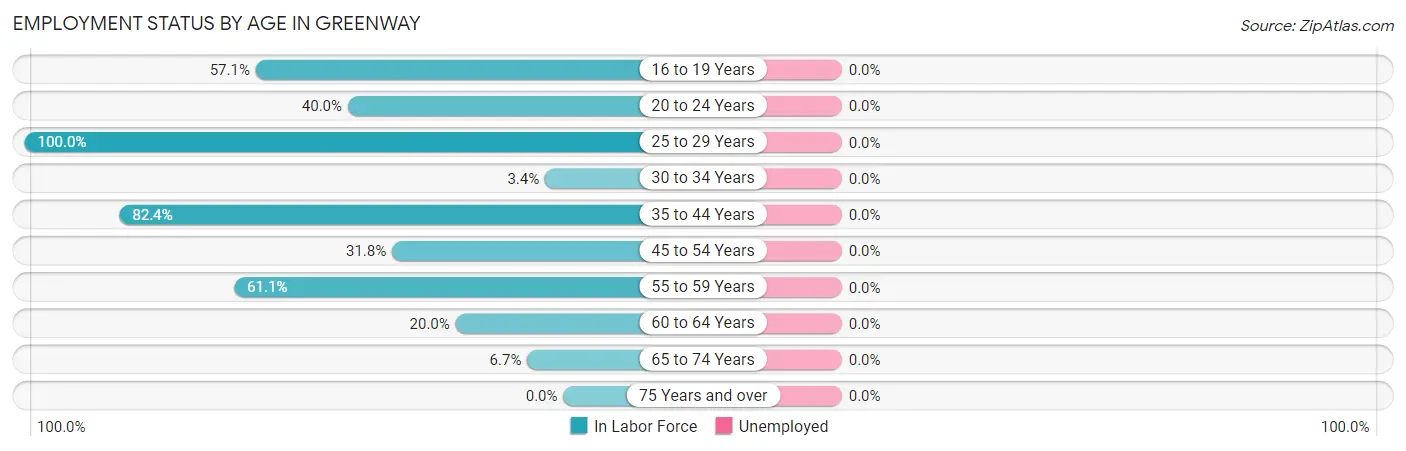
| Age Bracket | In Labor Force | Unemployed |
| 16 to 19 Years | 8 (57.1%) | 0 (0.0%) |
| 20 to 24 Years | 2 (40.0%) | 0 (0.0%) |
| 25 to 29 Years | 6 (100.0%) | 0 (0.0%) |
| 30 to 34 Years | 1 (3.4%) | 0 (0.0%) |
| 35 to 44 Years | 14 (82.4%) | 0 (0.0%) |
| 45 to 54 Years | 7 (31.8%) | 0 (0.0%) |
| 55 to 59 Years | 11 (61.1%) | 0 (0.0%) |
| 60 to 64 Years | 1 (20.0%) | 0 (0.0%) |
| 65 to 74 Years | 1 (6.7%) | 0 (0.0%) |
| 75 Years and over | 0 (0.0%) | 0 (0.0%) |
| Total | 51 (36.2%) | 0 (0.0%) |
Employment Status by Educational Attainment in Greenway
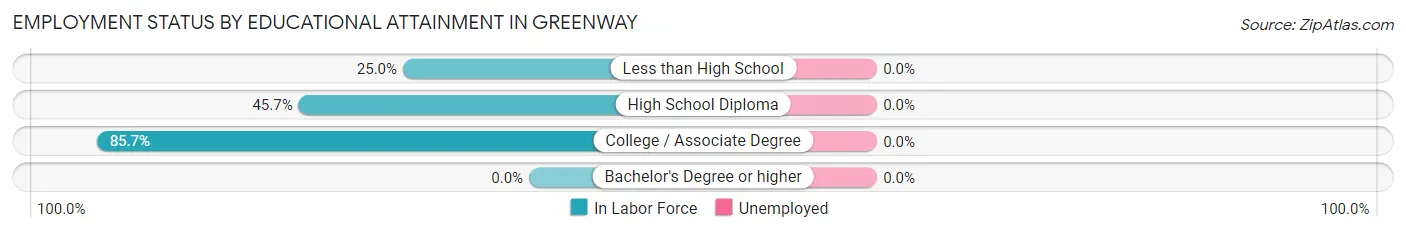
| Educational Attainment | In Labor Force | Unemployed |
| Less than High School | 12 (25.0%) | 0 (0.0%) |
| High School Diploma | 16 (45.7%) | 0 (0.0%) |
| College / Associate Degree | 12 (85.7%) | 0 (0.0%) |
| Bachelor's Degree or higher | 0 (0.0%) | 0 (0.0%) |
| Total | 40 (41.2%) | 0 (0.0%) |
Employment Occupations by Sex in Greenway
Management, Business, Science and Arts Occupations
The most common Management, Business, Science and Arts occupations in Greenway are Management (1 | 2.0%), and Health Diagnosing & Treating (1 | 2.0%).
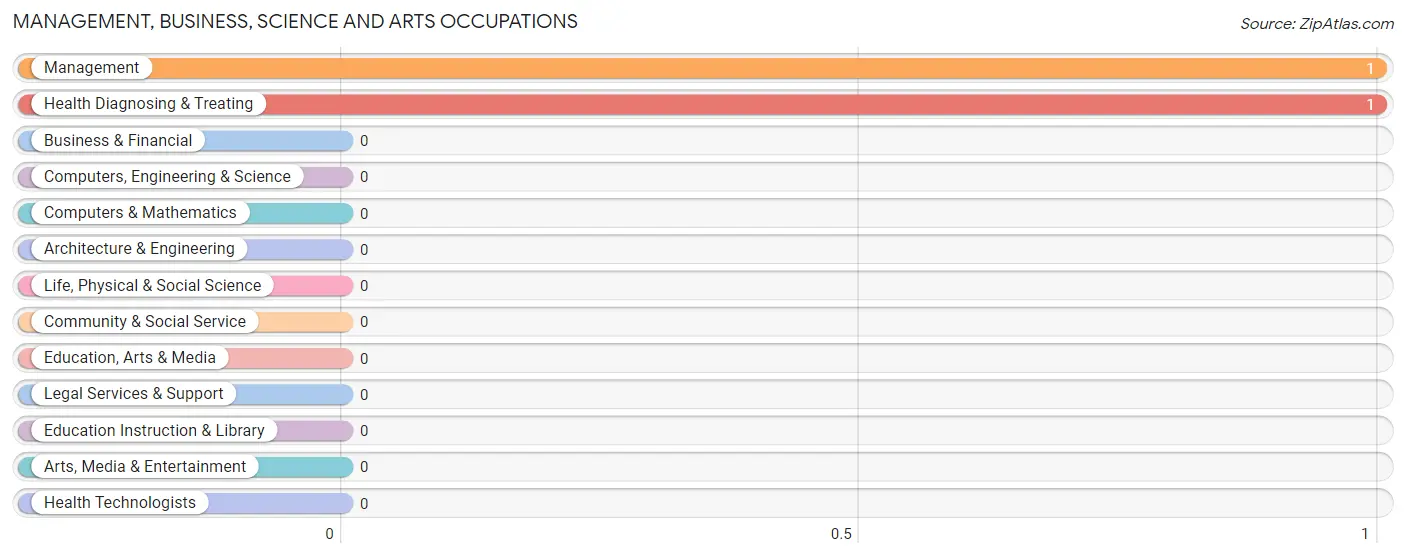
Management, Business, Science and Arts Occupations by Sex
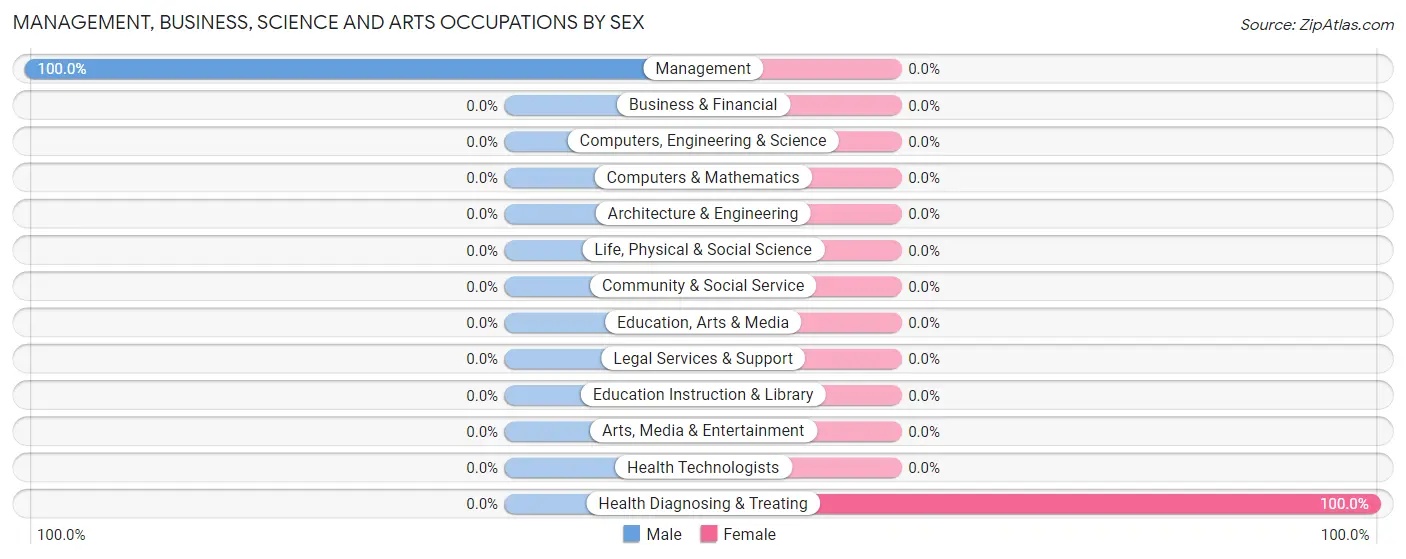
| Occupation | Male | Female |
| Management | 1 (100.0%) | 0 (0.0%) |
| Business & Financial | 0 (0.0%) | 0 (0.0%) |
| Computers, Engineering & Science | 0 (0.0%) | 0 (0.0%) |
| Computers & Mathematics | 0 (0.0%) | 0 (0.0%) |
| Architecture & Engineering | 0 (0.0%) | 0 (0.0%) |
| Life, Physical & Social Science | 0 (0.0%) | 0 (0.0%) |
| Community & Social Service | 0 (0.0%) | 0 (0.0%) |
| Education, Arts & Media | 0 (0.0%) | 0 (0.0%) |
| Legal Services & Support | 0 (0.0%) | 0 (0.0%) |
| Education Instruction & Library | 0 (0.0%) | 0 (0.0%) |
| Arts, Media & Entertainment | 0 (0.0%) | 0 (0.0%) |
| Health Diagnosing & Treating | 0 (0.0%) | 1 (100.0%) |
| Health Technologists | 0 (0.0%) | 0 (0.0%) |
| Total (Category) | 1 (50.0%) | 1 (50.0%) |
| Total (Overall) | 37 (72.6%) | 14 (27.5%) |
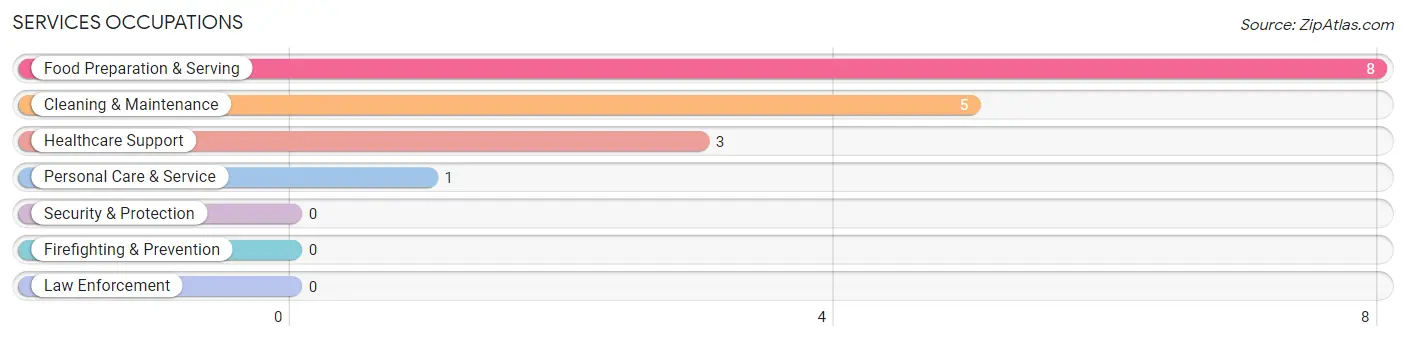
Services Occupations
The most common Services occupations in Greenway are Food Preparation & Serving (8 | 15.7%), Cleaning & Maintenance (5 | 9.8%), Healthcare Support (3 | 5.9%), and Personal Care & Service (1 | 2.0%).
Services Occupations by Sex
Within the Services occupations in Greenway, the most male-oriented occupations are Food Preparation & Serving (100.0%), and Cleaning & Maintenance (100.0%), while the most female-oriented occupations are Healthcare Support (100.0%), and Personal Care & Service (100.0%).
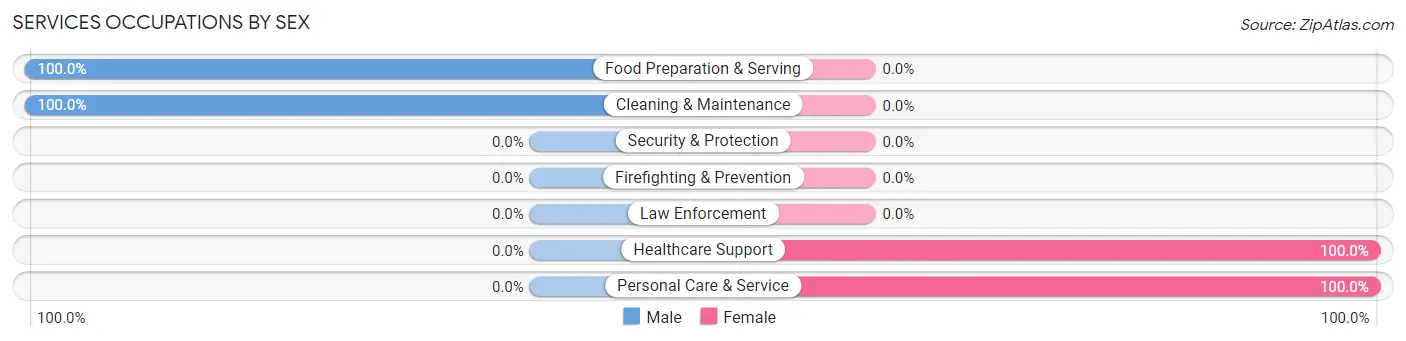
| Occupation | Male | Female |
| Healthcare Support | 0 (0.0%) | 3 (100.0%) |
| Security & Protection | 0 (0.0%) | 0 (0.0%) |
| Firefighting & Prevention | 0 (0.0%) | 0 (0.0%) |
| Law Enforcement | 0 (0.0%) | 0 (0.0%) |
| Food Preparation & Serving | 8 (100.0%) | 0 (0.0%) |
| Cleaning & Maintenance | 5 (100.0%) | 0 (0.0%) |
| Personal Care & Service | 0 (0.0%) | 1 (100.0%) |
| Total (Category) | 13 (76.5%) | 4 (23.5%) |
| Total (Overall) | 37 (72.6%) | 14 (27.5%) |
Sales and Office Occupations
The most common Sales and Office occupations in Greenway are Sales & Related (7 | 13.7%), and Office & Administration (2 | 3.9%).
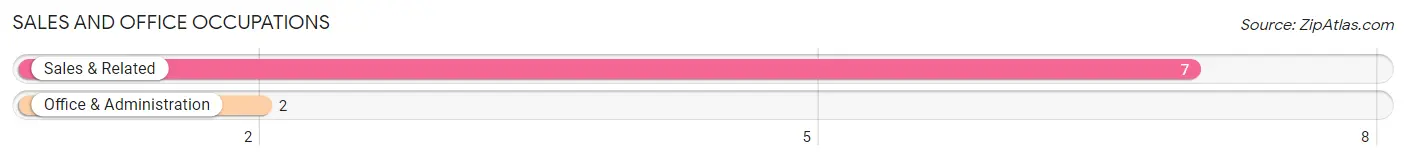
Sales and Office Occupations by Sex

| Occupation | Male | Female |
| Sales & Related | 2 (28.6%) | 5 (71.4%) |
| Office & Administration | 2 (100.0%) | 0 (0.0%) |
| Total (Category) | 4 (44.4%) | 5 (55.6%) |
| Total (Overall) | 37 (72.6%) | 14 (27.5%) |
Natural Resources, Construction and Maintenance Occupations
The most common Natural Resources, Construction and Maintenance occupations in Greenway are , and Installation, Maintenance & Repair (1 | 2.0%).
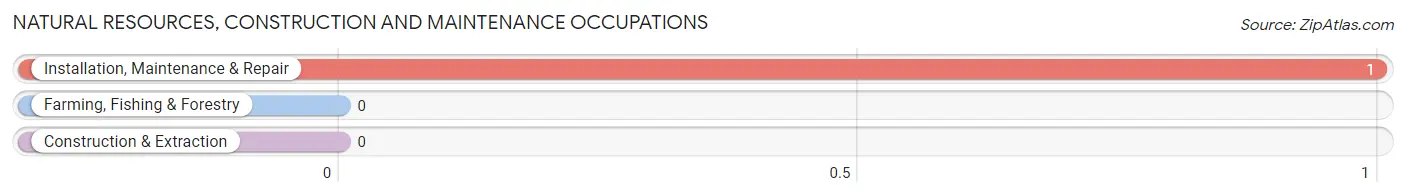
Natural Resources, Construction and Maintenance Occupations by Sex
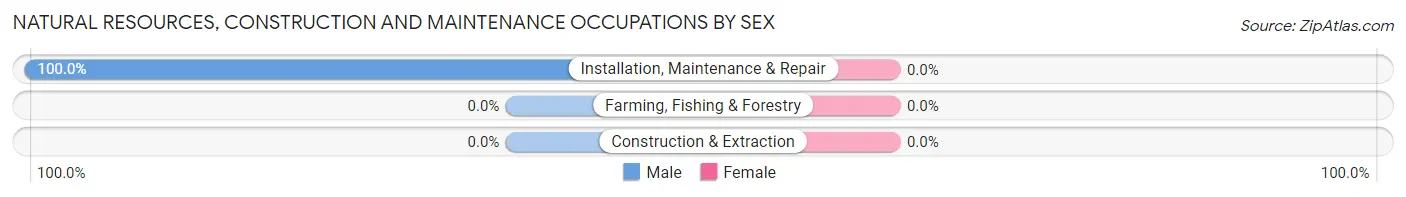
| Occupation | Male | Female |
| Farming, Fishing & Forestry | 0 (0.0%) | 0 (0.0%) |
| Construction & Extraction | 0 (0.0%) | 0 (0.0%) |
| Installation, Maintenance & Repair | 1 (100.0%) | 0 (0.0%) |
| Total (Category) | 1 (100.0%) | 0 (0.0%) |
| Total (Overall) | 37 (72.6%) | 14 (27.5%) |
Production, Transportation and Moving Occupations
The most common Production, Transportation and Moving occupations in Greenway are Production (14 | 27.5%), Material Moving (5 | 9.8%), and Transportation (3 | 5.9%).
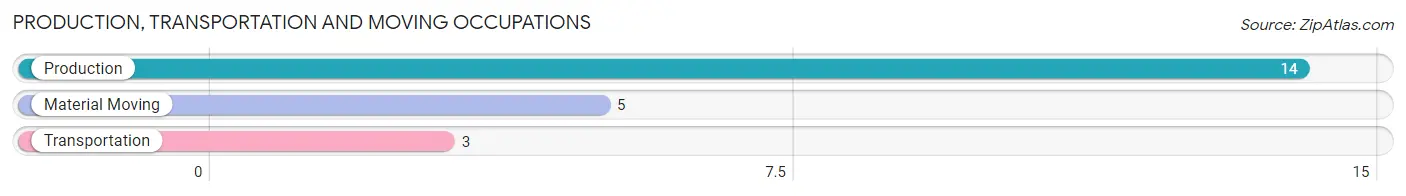
Production, Transportation and Moving Occupations by Sex
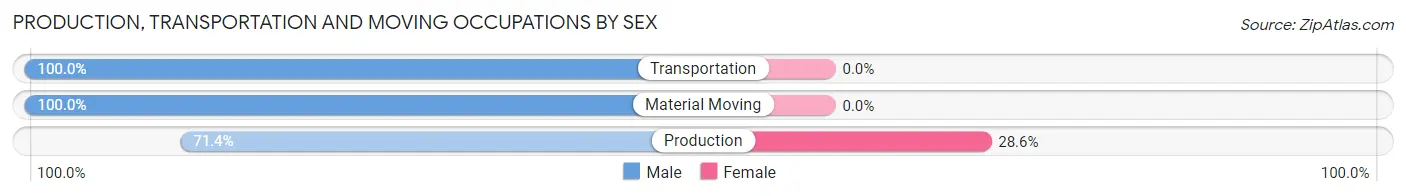
| Occupation | Male | Female |
| Production | 10 (71.4%) | 4 (28.6%) |
| Transportation | 3 (100.0%) | 0 (0.0%) |
| Material Moving | 5 (100.0%) | 0 (0.0%) |
| Total (Category) | 18 (81.8%) | 4 (18.2%) |
| Total (Overall) | 37 (72.6%) | 14 (27.5%) |
Employment Industries by Sex in Greenway
Employment Industries in Greenway
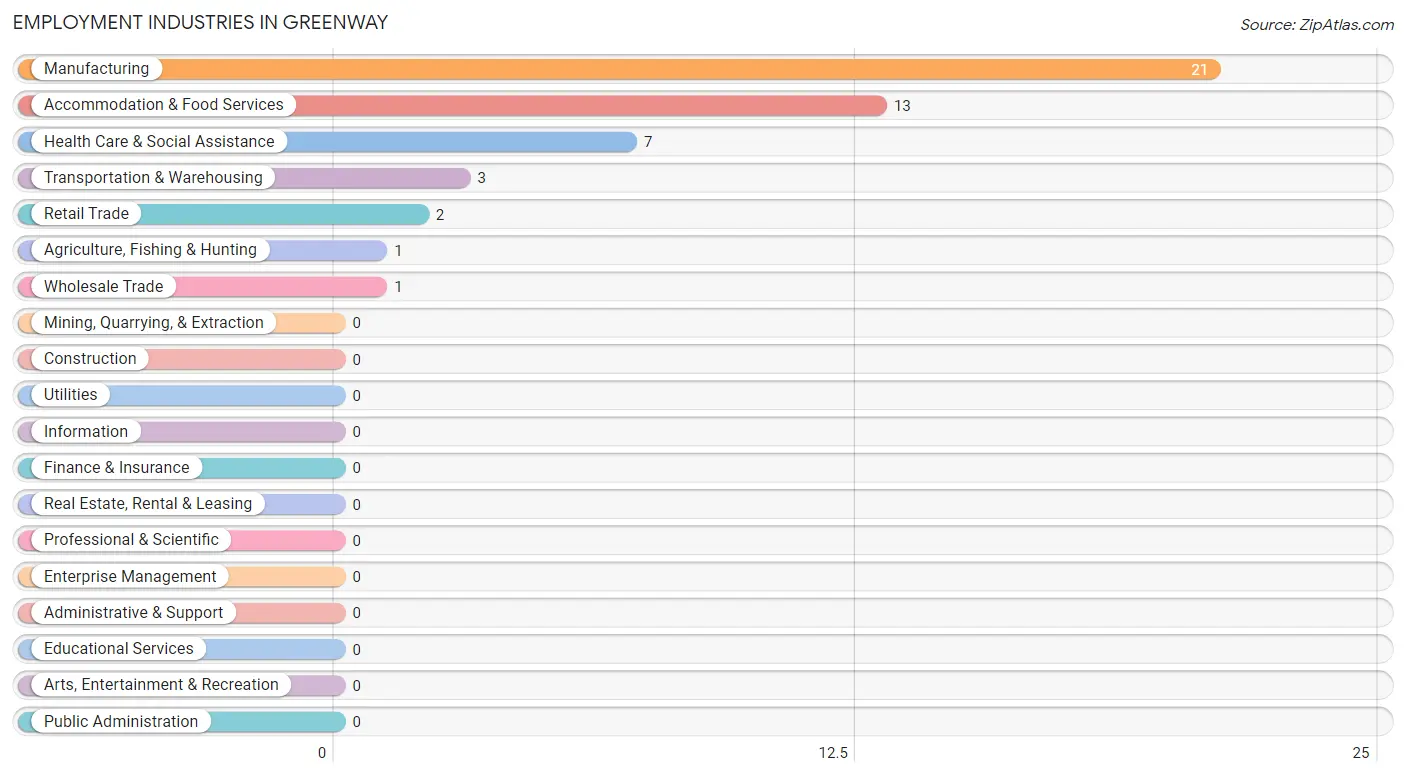
The major employment industries in Greenway include Manufacturing (21 | 41.2%), Accommodation & Food Services (13 | 25.5%), Health Care & Social Assistance (7 | 13.7%), Transportation & Warehousing (3 | 5.9%), and Retail Trade (2 | 3.9%).
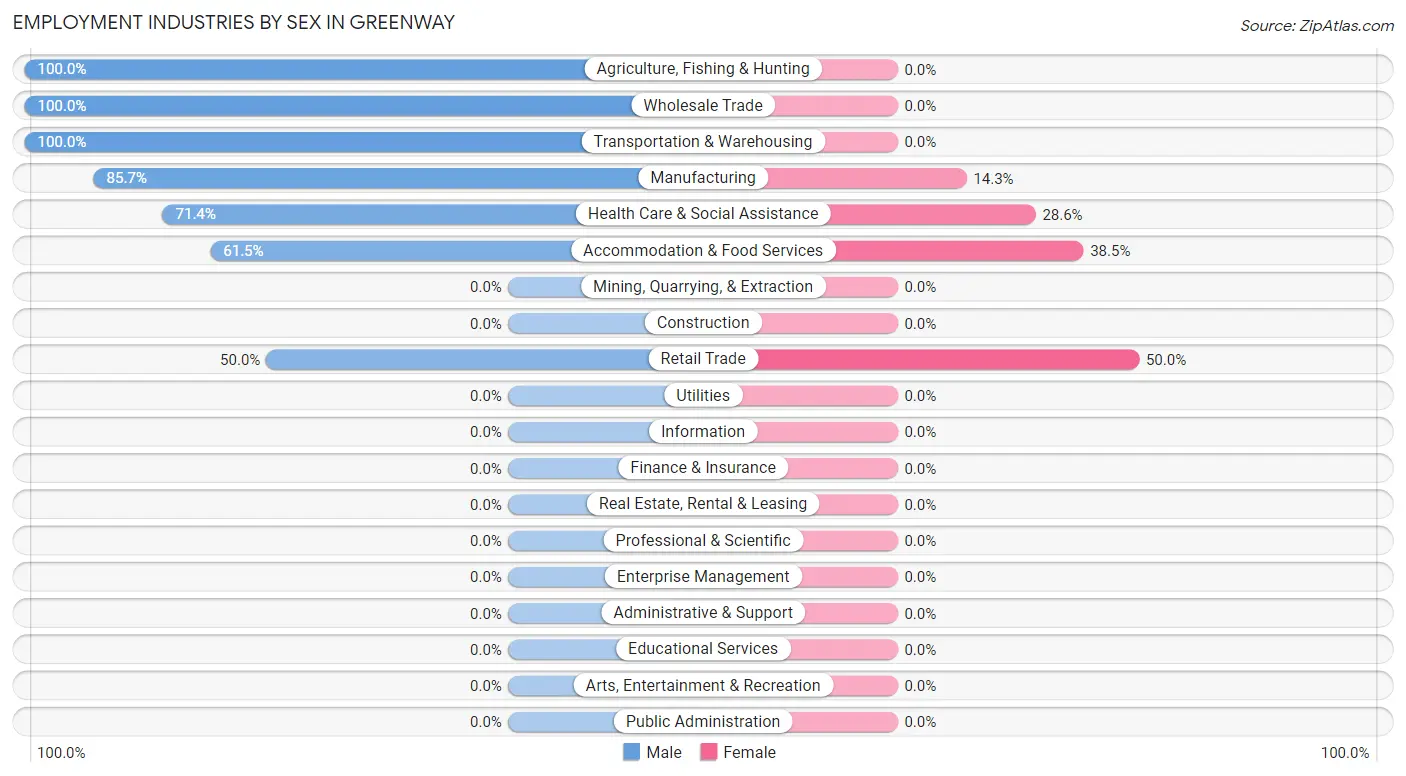
Employment Industries by Sex in Greenway
The Greenway industries that see more men than women are Agriculture, Fishing & Hunting (100.0%), Wholesale Trade (100.0%), and Transportation & Warehousing (100.0%), whereas the industries that tend to have a higher number of women are Retail Trade (50.0%), Accommodation & Food Services (38.5%), and Health Care & Social Assistance (28.6%).
| Industry | Male | Female |
| Agriculture, Fishing & Hunting | 1 (100.0%) | 0 (0.0%) |
| Mining, Quarrying, & Extraction | 0 (0.0%) | 0 (0.0%) |
| Construction | 0 (0.0%) | 0 (0.0%) |
| Manufacturing | 18 (85.7%) | 3 (14.3%) |
| Wholesale Trade | 1 (100.0%) | 0 (0.0%) |
| Retail Trade | 1 (50.0%) | 1 (50.0%) |
| Transportation & Warehousing | 3 (100.0%) | 0 (0.0%) |
| Utilities | 0 (0.0%) | 0 (0.0%) |
| Information | 0 (0.0%) | 0 (0.0%) |
| Finance & Insurance | 0 (0.0%) | 0 (0.0%) |
| Real Estate, Rental & Leasing | 0 (0.0%) | 0 (0.0%) |
| Professional & Scientific | 0 (0.0%) | 0 (0.0%) |
| Enterprise Management | 0 (0.0%) | 0 (0.0%) |
| Administrative & Support | 0 (0.0%) | 0 (0.0%) |
| Educational Services | 0 (0.0%) | 0 (0.0%) |
| Health Care & Social Assistance | 5 (71.4%) | 2 (28.6%) |
| Arts, Entertainment & Recreation | 0 (0.0%) | 0 (0.0%) |
| Accommodation & Food Services | 8 (61.5%) | 5 (38.5%) |
| Public Administration | 0 (0.0%) | 0 (0.0%) |
| Total | 37 (72.6%) | 14 (27.5%) |
Education in Greenway
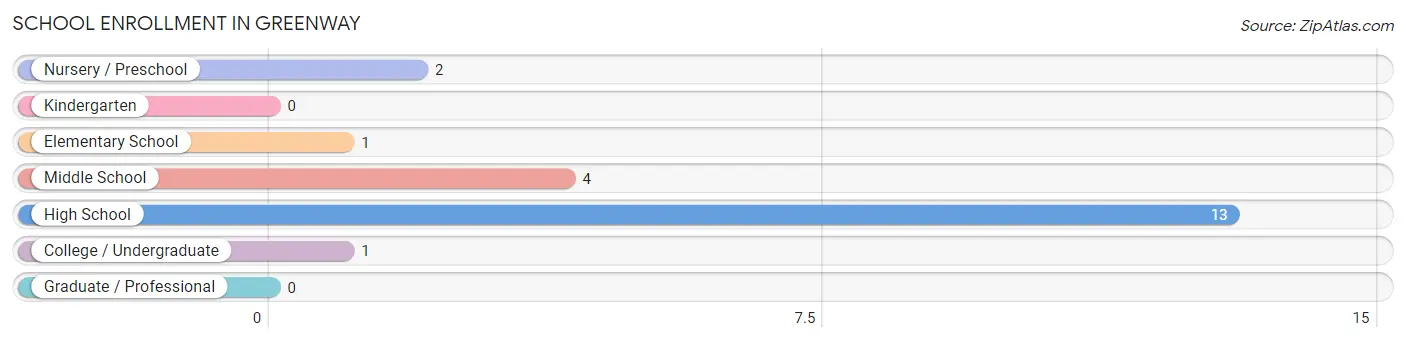
School Enrollment in Greenway
The most common levels of schooling among the 21 students in Greenway are high school (13 | 61.9%), middle school (4 | 19.1%), and nursery / preschool (2 | 9.5%).
| School Level | # Students | % Students |
| Nursery / Preschool | 2 | 9.5% |
| Kindergarten | 0 | 0.0% |
| Elementary School | 1 | 4.8% |
| Middle School | 4 | 19.1% |
| High School | 13 | 61.9% |
| College / Undergraduate | 1 | 4.8% |
| Graduate / Professional | 0 | 0.0% |
| Total | 21 | 100.0% |
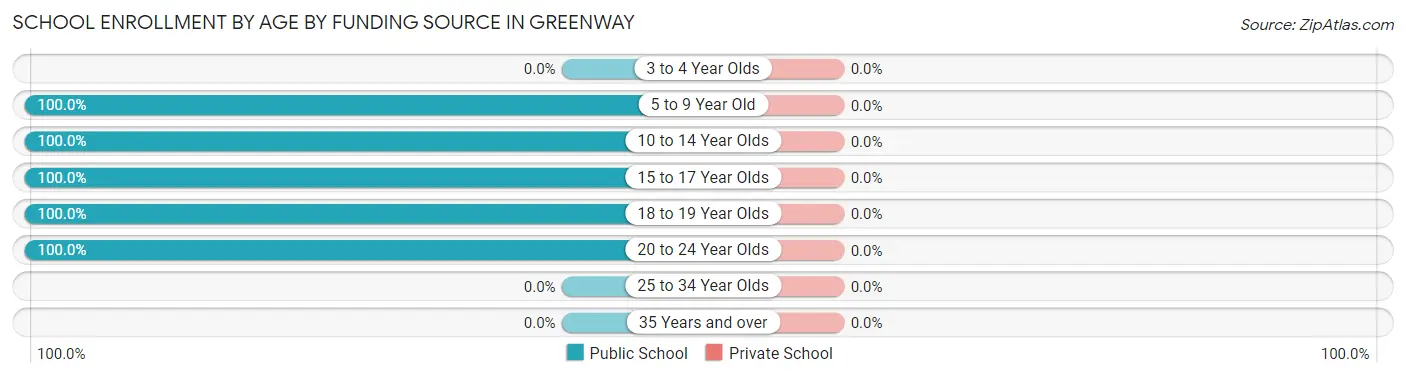
School Enrollment by Age by Funding Source in Greenway
| Age Bracket | Public School | Private School |
| 3 to 4 Year Olds | 0 (0.0%) | 0 (0.0%) |
| 5 to 9 Year Old | 3 (100.0%) | 0 (0.0%) |
| 10 to 14 Year Olds | 4 (100.0%) | 0 (0.0%) |
| 15 to 17 Year Olds | 3 (100.0%) | 0 (0.0%) |
| 18 to 19 Year Olds | 10 (100.0%) | 0 (0.0%) |
| 20 to 24 Year Olds | 1 (100.0%) | 0 (0.0%) |
| 25 to 34 Year Olds | 0 (0.0%) | 0 (0.0%) |
| 35 Years and over | 0 (0.0%) | 0 (0.0%) |
| Total | 21 (100.0%) | 0 (0.0%) |
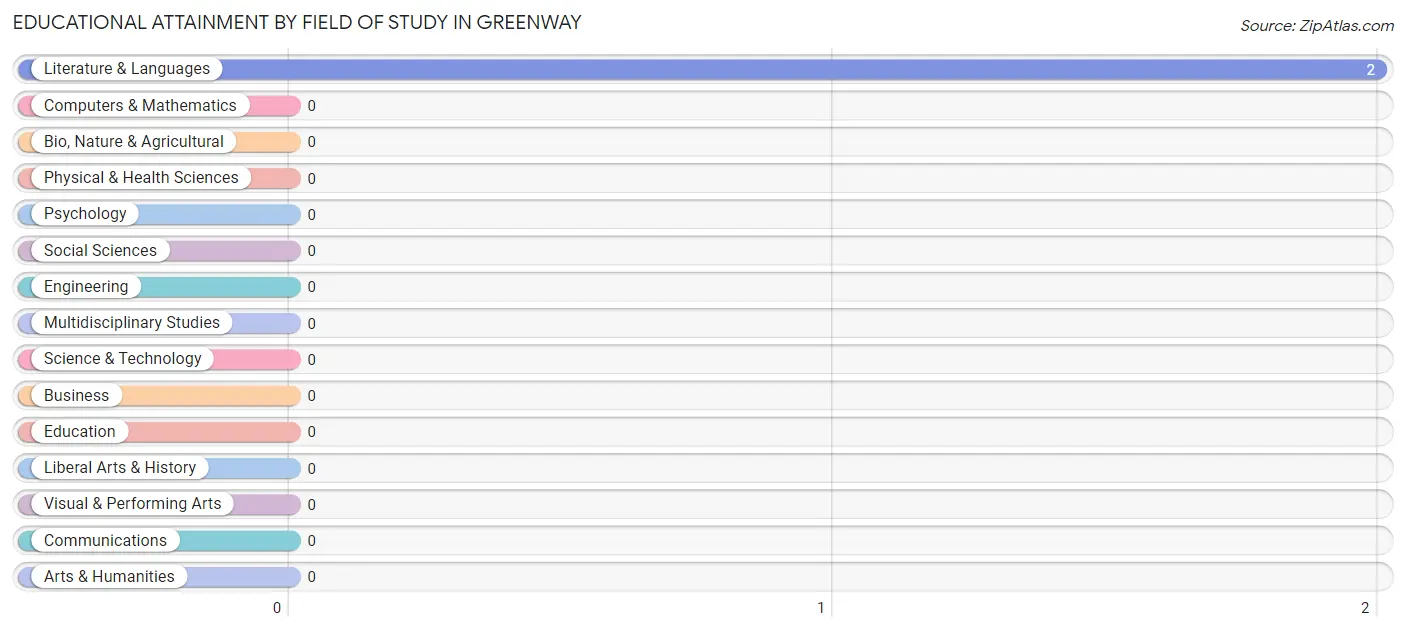
Educational Attainment by Field of Study in Greenway
, and literature & languages (2 | 100.0%) are the most common fields of study among 2 individuals in Greenway who have obtained a bachelor's degree or higher.
| Field of Study | # Graduates | % Graduates |
| Computers & Mathematics | 0 | 0.0% |
| Bio, Nature & Agricultural | 0 | 0.0% |
| Physical & Health Sciences | 0 | 0.0% |
| Psychology | 0 | 0.0% |
| Social Sciences | 0 | 0.0% |
| Engineering | 0 | 0.0% |
| Multidisciplinary Studies | 0 | 0.0% |
| Science & Technology | 0 | 0.0% |
| Business | 0 | 0.0% |
| Education | 0 | 0.0% |
| Literature & Languages | 2 | 100.0% |
| Liberal Arts & History | 0 | 0.0% |
| Visual & Performing Arts | 0 | 0.0% |
| Communications | 0 | 0.0% |
| Arts & Humanities | 0 | 0.0% |
| Total | 2 | 100.0% |
Transportation & Commute in Greenway
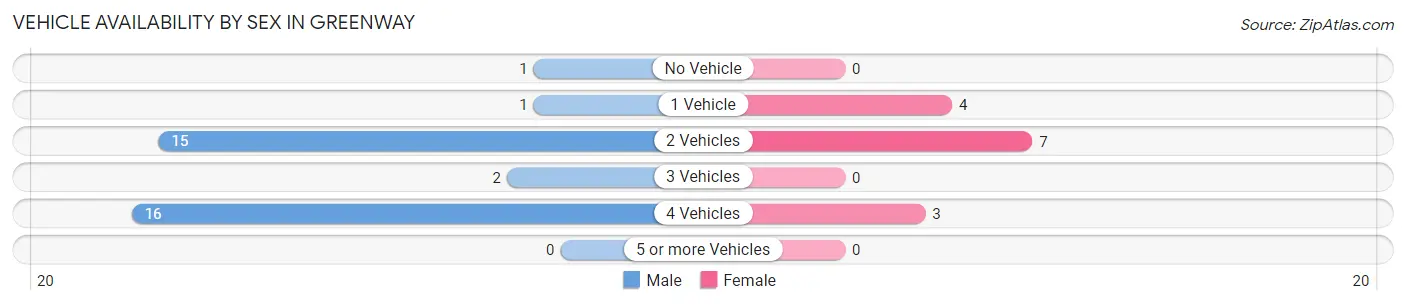
Vehicle Availability by Sex in Greenway
The most prevalent vehicle ownership categories in Greenway are males with 4 vehicles (16, accounting for 45.7%) and females with 4 vehicles (3, making up 114.3%).
| Vehicles Available | Male | Female |
| No Vehicle | 1 (2.9%) | 0 (0.0%) |
| 1 Vehicle | 1 (2.9%) | 4 (28.6%) |
| 2 Vehicles | 15 (42.9%) | 7 (50.0%) |
| 3 Vehicles | 2 (5.7%) | 0 (0.0%) |
| 4 Vehicles | 16 (45.7%) | 3 (21.4%) |
| 5 or more Vehicles | 0 (0.0%) | 0 (0.0%) |
| Total | 35 (100.0%) | 14 (100.0%) |
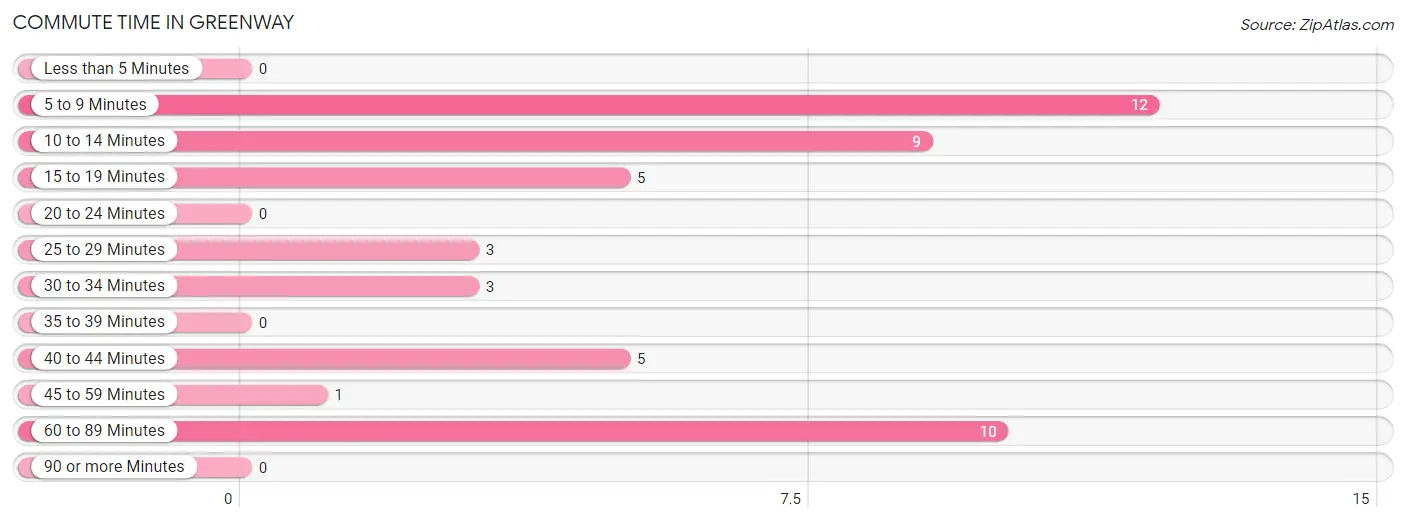
Commute Time in Greenway
The most frequently occuring commute durations in Greenway are 5 to 9 minutes (12 commuters, 25.0%), 60 to 89 minutes (10 commuters, 20.8%), and 10 to 14 minutes (9 commuters, 18.8%).
| Commute Time | # Commuters | % Commuters |
| Less than 5 Minutes | 0 | 0.0% |
| 5 to 9 Minutes | 12 | 25.0% |
| 10 to 14 Minutes | 9 | 18.8% |
| 15 to 19 Minutes | 5 | 10.4% |
| 20 to 24 Minutes | 0 | 0.0% |
| 25 to 29 Minutes | 3 | 6.2% |
| 30 to 34 Minutes | 3 | 6.2% |
| 35 to 39 Minutes | 0 | 0.0% |
| 40 to 44 Minutes | 5 | 10.4% |
| 45 to 59 Minutes | 1 | 2.1% |
| 60 to 89 Minutes | 10 | 20.8% |
| 90 or more Minutes | 0 | 0.0% |
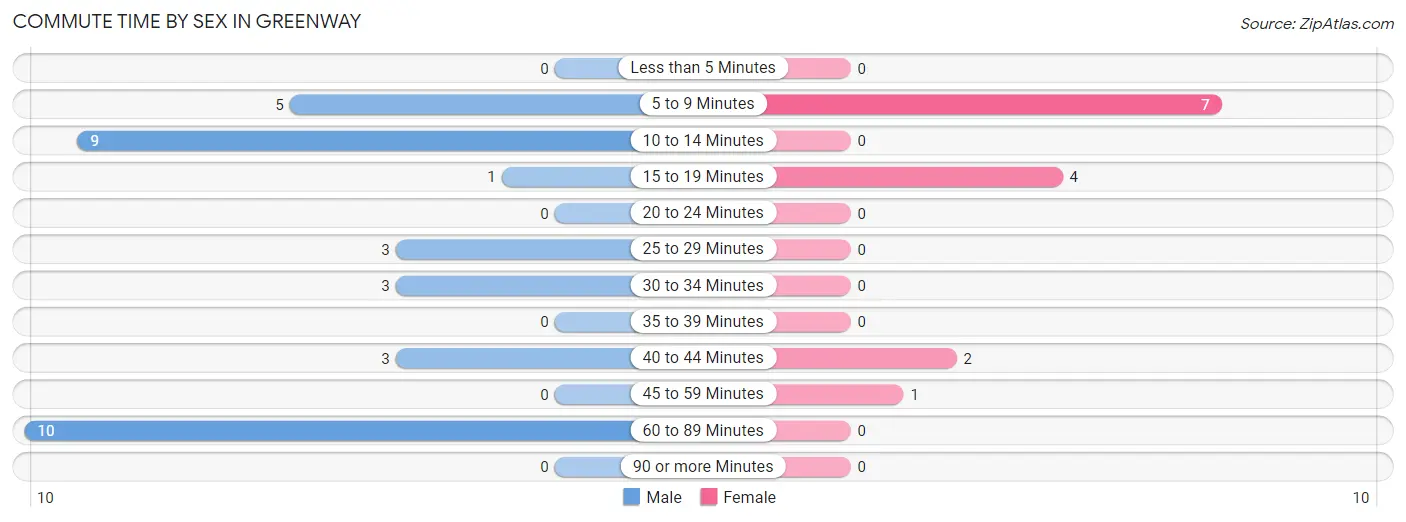
Commute Time by Sex in Greenway
The most common commute times in Greenway are 60 to 89 minutes (10 commuters, 29.4%) for males and 5 to 9 minutes (7 commuters, 50.0%) for females.
| Commute Time | Male | Female |
| Less than 5 Minutes | 0 (0.0%) | 0 (0.0%) |
| 5 to 9 Minutes | 5 (14.7%) | 7 (50.0%) |
| 10 to 14 Minutes | 9 (26.5%) | 0 (0.0%) |
| 15 to 19 Minutes | 1 (2.9%) | 4 (28.6%) |
| 20 to 24 Minutes | 0 (0.0%) | 0 (0.0%) |
| 25 to 29 Minutes | 3 (8.8%) | 0 (0.0%) |
| 30 to 34 Minutes | 3 (8.8%) | 0 (0.0%) |
| 35 to 39 Minutes | 0 (0.0%) | 0 (0.0%) |
| 40 to 44 Minutes | 3 (8.8%) | 2 (14.3%) |
| 45 to 59 Minutes | 0 (0.0%) | 1 (7.1%) |
| 60 to 89 Minutes | 10 (29.4%) | 0 (0.0%) |
| 90 or more Minutes | 0 (0.0%) | 0 (0.0%) |
Time of Departure to Work by Sex in Greenway
The most frequent times of departure to work in Greenway are 6:00 AM to 6:29 AM (11, 32.4%) for males and 8:00 AM to 8:29 AM (5, 35.7%) for females.
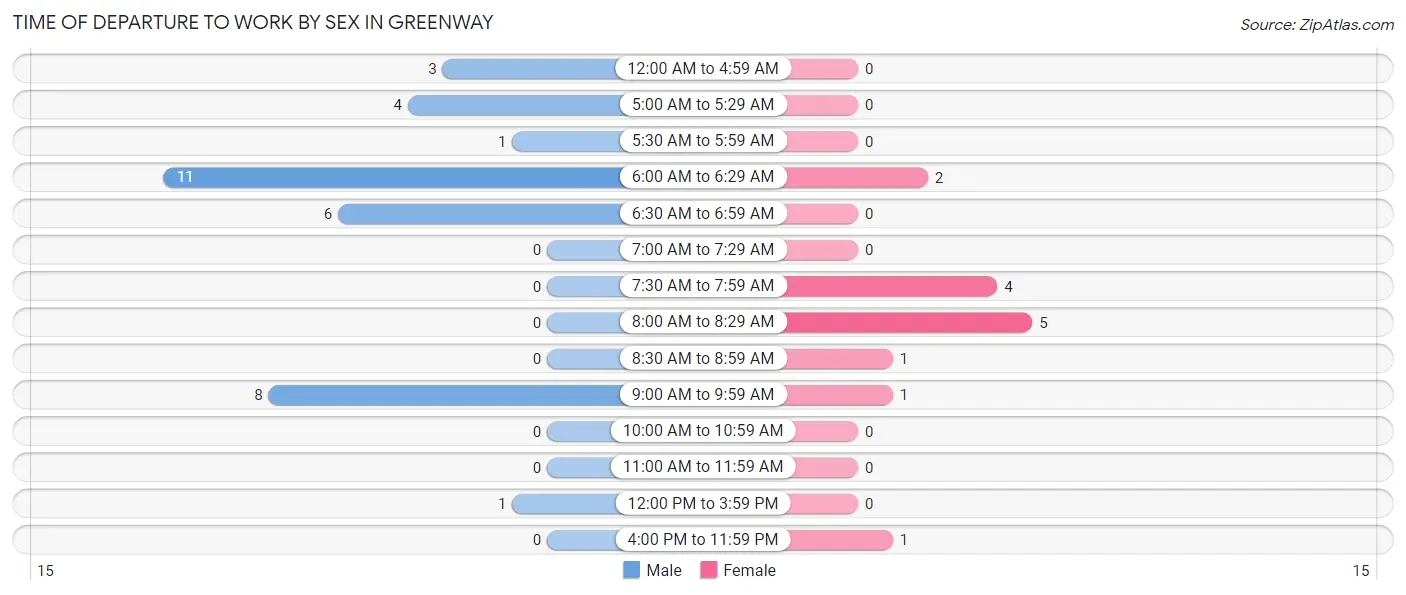
| Time of Departure | Male | Female |
| 12:00 AM to 4:59 AM | 3 (8.8%) | 0 (0.0%) |
| 5:00 AM to 5:29 AM | 4 (11.8%) | 0 (0.0%) |
| 5:30 AM to 5:59 AM | 1 (2.9%) | 0 (0.0%) |
| 6:00 AM to 6:29 AM | 11 (32.4%) | 2 (14.3%) |
| 6:30 AM to 6:59 AM | 6 (17.6%) | 0 (0.0%) |
| 7:00 AM to 7:29 AM | 0 (0.0%) | 0 (0.0%) |
| 7:30 AM to 7:59 AM | 0 (0.0%) | 4 (28.6%) |
| 8:00 AM to 8:29 AM | 0 (0.0%) | 5 (35.7%) |
| 8:30 AM to 8:59 AM | 0 (0.0%) | 1 (7.1%) |
| 9:00 AM to 9:59 AM | 8 (23.5%) | 1 (7.1%) |
| 10:00 AM to 10:59 AM | 0 (0.0%) | 0 (0.0%) |
| 11:00 AM to 11:59 AM | 0 (0.0%) | 0 (0.0%) |
| 12:00 PM to 3:59 PM | 1 (2.9%) | 0 (0.0%) |
| 4:00 PM to 11:59 PM | 0 (0.0%) | 1 (7.1%) |
| Total | 34 (100.0%) | 14 (100.0%) |
Housing Occupancy in Greenway
Occupancy by Ownership in Greenway
Of the total 59 dwellings in Greenway, owner-occupied units account for 46 (78.0%), while renter-occupied units make up 13 (22.0%).
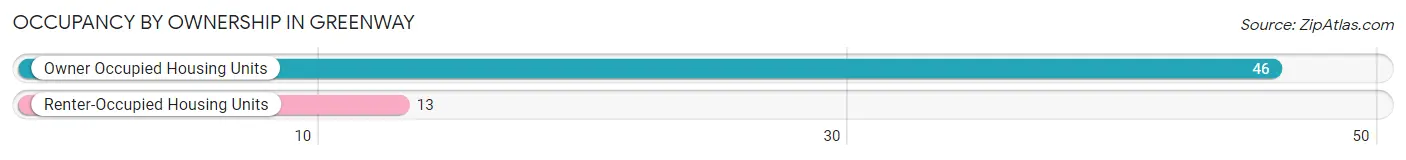
| Occupancy | # Housing Units | % Housing Units |
| Owner Occupied Housing Units | 46 | 78.0% |
| Renter-Occupied Housing Units | 13 | 22.0% |
| Total Occupied Housing Units | 59 | 100.0% |
Occupancy by Household Size in Greenway
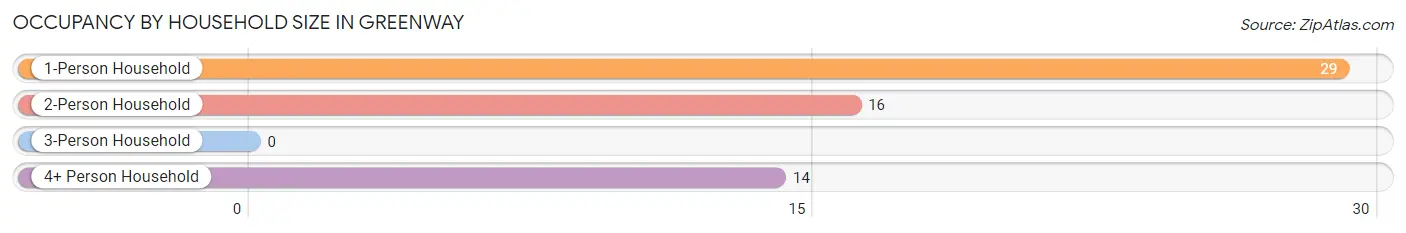
| Household Size | # Housing Units | % Housing Units |
| 1-Person Household | 29 | 49.1% |
| 2-Person Household | 16 | 27.1% |
| 3-Person Household | 0 | 0.0% |
| 4+ Person Household | 14 | 23.7% |
| Total Housing Units | 59 | 100.0% |
Occupancy by Ownership by Household Size in Greenway
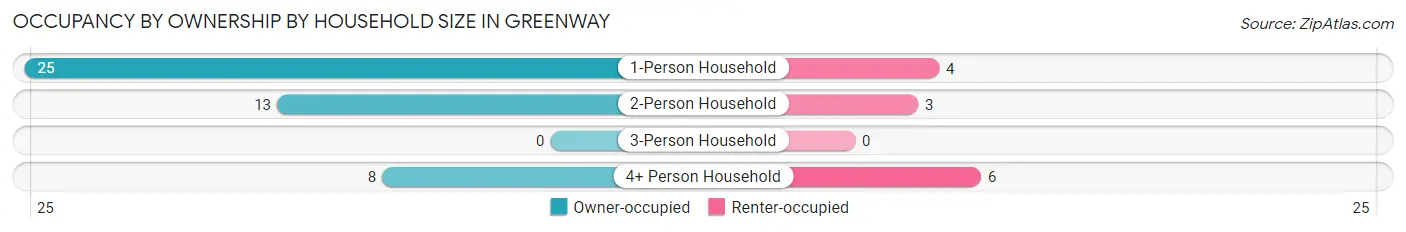
| Household Size | Owner-occupied | Renter-occupied |
| 1-Person Household | 25 (86.2%) | 4 (13.8%) |
| 2-Person Household | 13 (81.2%) | 3 (18.8%) |
| 3-Person Household | 0 (0.0%) | 0 (0.0%) |
| 4+ Person Household | 8 (57.1%) | 6 (42.9%) |
| Total Housing Units | 46 (78.0%) | 13 (22.0%) |
Occupancy by Educational Attainment in Greenway
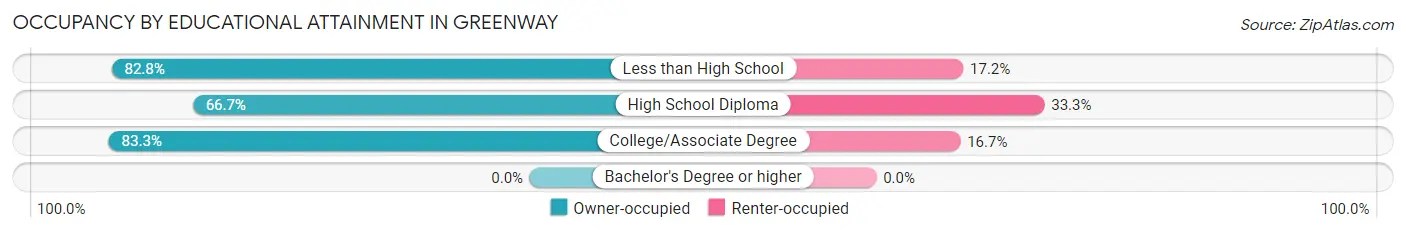
| Household Size | Owner-occupied | Renter-occupied |
| Less than High School | 24 (82.8%) | 5 (17.2%) |
| High School Diploma | 12 (66.7%) | 6 (33.3%) |
| College/Associate Degree | 10 (83.3%) | 2 (16.7%) |
| Bachelor's Degree or higher | 0 (0.0%) | 0 (0.0%) |
Occupancy by Age of Householder in Greenway
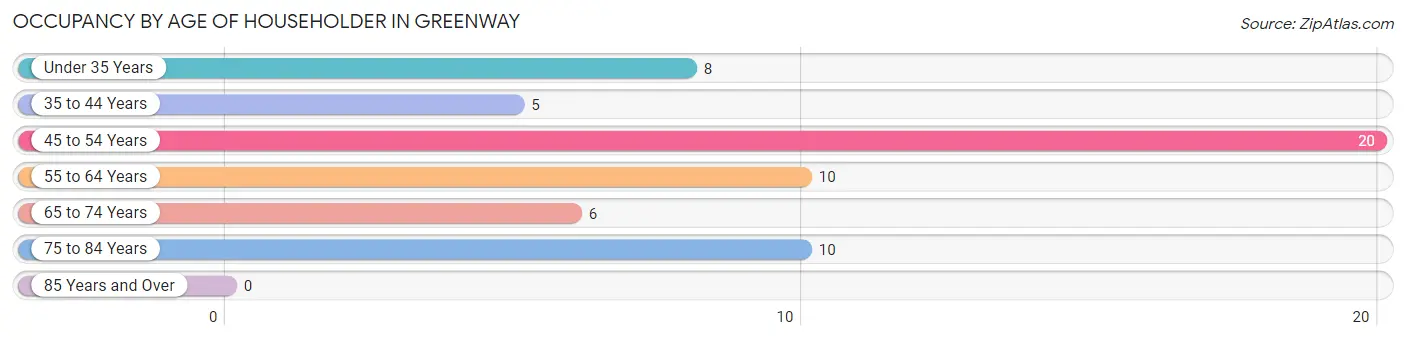
| Age Bracket | # Households | % Households |
| Under 35 Years | 8 | 13.6% |
| 35 to 44 Years | 5 | 8.5% |
| 45 to 54 Years | 20 | 33.9% |
| 55 to 64 Years | 10 | 17.0% |
| 65 to 74 Years | 6 | 10.2% |
| 75 to 84 Years | 10 | 17.0% |
| 85 Years and Over | 0 | 0.0% |
| Total | 59 | 100.0% |
Housing Finances in Greenway
Median Income by Occupancy in Greenway
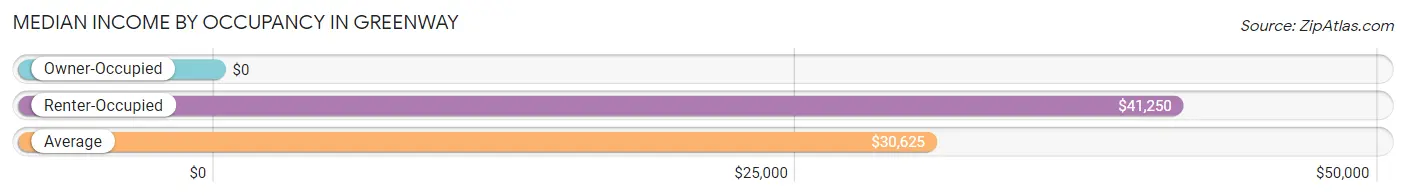
| Occupancy Type | # Households | Median Income |
| Owner-Occupied | 46 (78.0%) | $0 |
| Renter-Occupied | 13 (22.0%) | $41,250 |
| Average | 59 (100.0%) | $30,625 |
Occupancy by Householder Income Bracket in Greenway
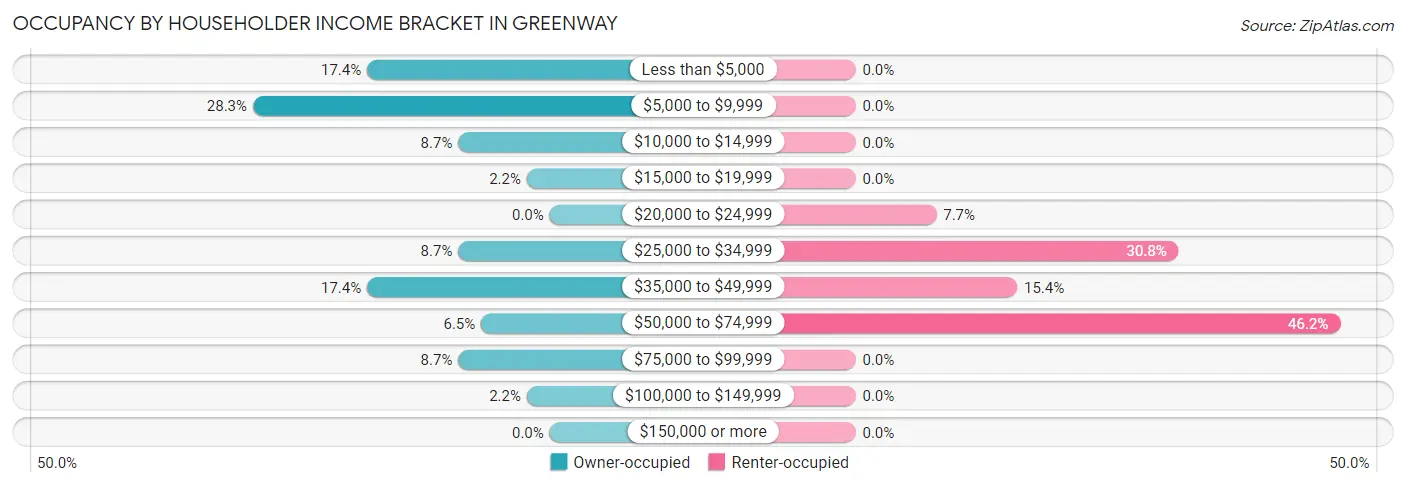
| Income Bracket | Owner-occupied | Renter-occupied |
| Less than $5,000 | 8 (17.4%) | 0 (0.0%) |
| $5,000 to $9,999 | 13 (28.3%) | 0 (0.0%) |
| $10,000 to $14,999 | 4 (8.7%) | 0 (0.0%) |
| $15,000 to $19,999 | 1 (2.2%) | 0 (0.0%) |
| $20,000 to $24,999 | 0 (0.0%) | 1 (7.7%) |
| $25,000 to $34,999 | 4 (8.7%) | 4 (30.8%) |
| $35,000 to $49,999 | 8 (17.4%) | 2 (15.4%) |
| $50,000 to $74,999 | 3 (6.5%) | 6 (46.2%) |
| $75,000 to $99,999 | 4 (8.7%) | 0 (0.0%) |
| $100,000 to $149,999 | 1 (2.2%) | 0 (0.0%) |
| $150,000 or more | 0 (0.0%) | 0 (0.0%) |
| Total | 46 (100.0%) | 13 (100.0%) |
Monthly Housing Cost Tiers in Greenway
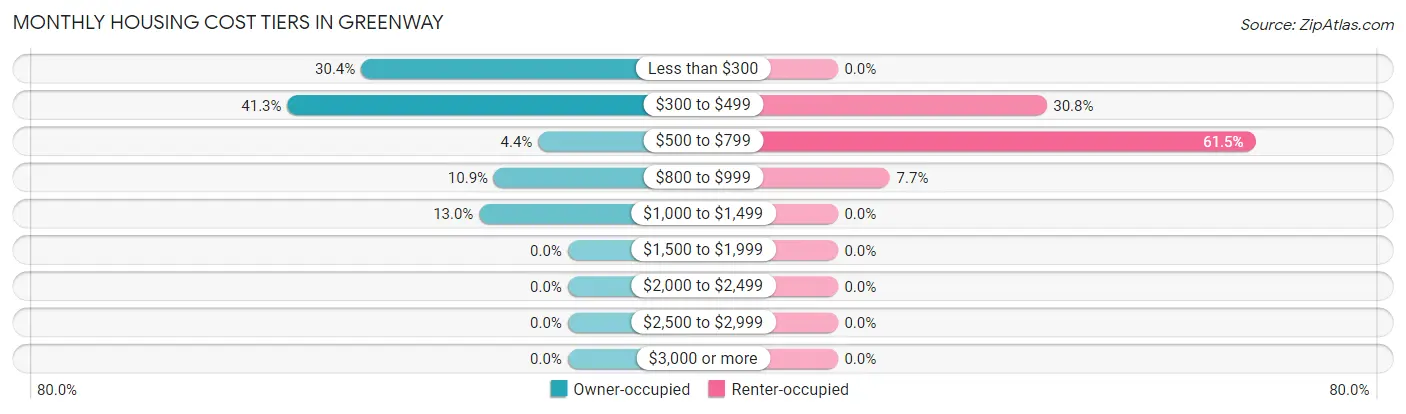
| Monthly Cost | Owner-occupied | Renter-occupied |
| Less than $300 | 14 (30.4%) | 0 (0.0%) |
| $300 to $499 | 19 (41.3%) | 4 (30.8%) |
| $500 to $799 | 2 (4.3%) | 8 (61.5%) |
| $800 to $999 | 5 (10.9%) | 1 (7.7%) |
| $1,000 to $1,499 | 6 (13.0%) | 0 (0.0%) |
| $1,500 to $1,999 | 0 (0.0%) | 0 (0.0%) |
| $2,000 to $2,499 | 0 (0.0%) | 0 (0.0%) |
| $2,500 to $2,999 | 0 (0.0%) | 0 (0.0%) |
| $3,000 or more | 0 (0.0%) | 0 (0.0%) |
| Total | 46 (100.0%) | 13 (100.0%) |
Physical Housing Characteristics in Greenway
Housing Structures in Greenway
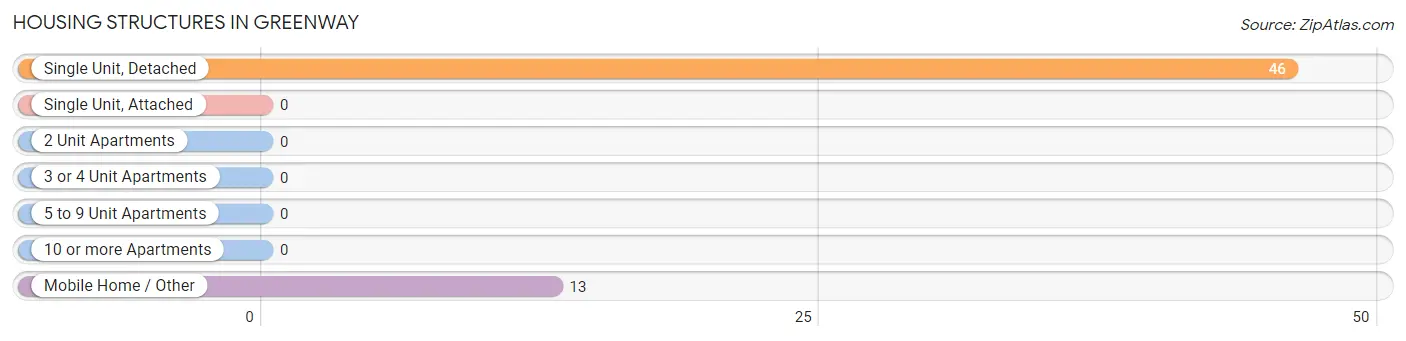
| Structure Type | # Housing Units | % Housing Units |
| Single Unit, Detached | 46 | 78.0% |
| Single Unit, Attached | 0 | 0.0% |
| 2 Unit Apartments | 0 | 0.0% |
| 3 or 4 Unit Apartments | 0 | 0.0% |
| 5 to 9 Unit Apartments | 0 | 0.0% |
| 10 or more Apartments | 0 | 0.0% |
| Mobile Home / Other | 13 | 22.0% |
| Total | 59 | 100.0% |
Housing Structures by Occupancy in Greenway
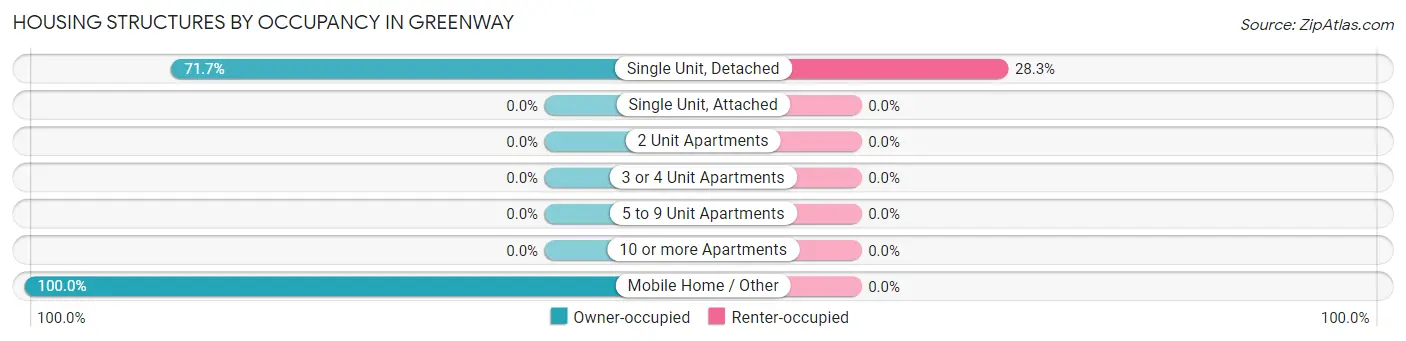
| Structure Type | Owner-occupied | Renter-occupied |
| Single Unit, Detached | 33 (71.7%) | 13 (28.3%) |
| Single Unit, Attached | 0 (0.0%) | 0 (0.0%) |
| 2 Unit Apartments | 0 (0.0%) | 0 (0.0%) |
| 3 or 4 Unit Apartments | 0 (0.0%) | 0 (0.0%) |
| 5 to 9 Unit Apartments | 0 (0.0%) | 0 (0.0%) |
| 10 or more Apartments | 0 (0.0%) | 0 (0.0%) |
| Mobile Home / Other | 13 (100.0%) | 0 (0.0%) |
| Total | 46 (78.0%) | 13 (22.0%) |
Housing Structures by Number of Rooms in Greenway
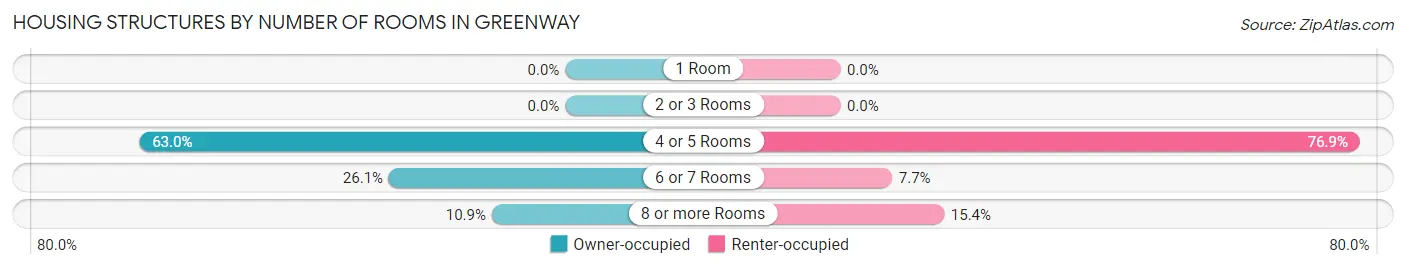
| Number of Rooms | Owner-occupied | Renter-occupied |
| 1 Room | 0 (0.0%) | 0 (0.0%) |
| 2 or 3 Rooms | 0 (0.0%) | 0 (0.0%) |
| 4 or 5 Rooms | 29 (63.0%) | 10 (76.9%) |
| 6 or 7 Rooms | 12 (26.1%) | 1 (7.7%) |
| 8 or more Rooms | 5 (10.9%) | 2 (15.4%) |
| Total | 46 (100.0%) | 13 (100.0%) |
Housing Structure by Heating Type in Greenway
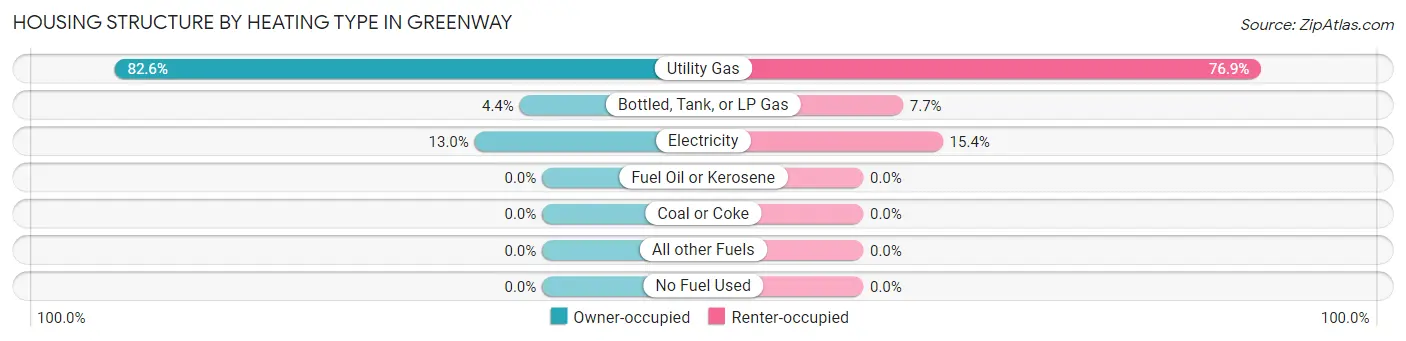
| Heating Type | Owner-occupied | Renter-occupied |
| Utility Gas | 38 (82.6%) | 10 (76.9%) |
| Bottled, Tank, or LP Gas | 2 (4.3%) | 1 (7.7%) |
| Electricity | 6 (13.0%) | 2 (15.4%) |
| Fuel Oil or Kerosene | 0 (0.0%) | 0 (0.0%) |
| Coal or Coke | 0 (0.0%) | 0 (0.0%) |
| All other Fuels | 0 (0.0%) | 0 (0.0%) |
| No Fuel Used | 0 (0.0%) | 0 (0.0%) |
| Total | 46 (100.0%) | 13 (100.0%) |
Household Vehicle Usage in Greenway
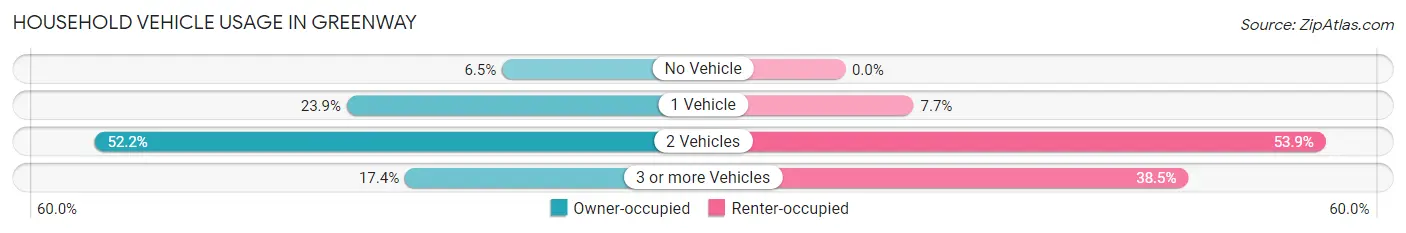
| Vehicles per Household | Owner-occupied | Renter-occupied |
| No Vehicle | 3 (6.5%) | 0 (0.0%) |
| 1 Vehicle | 11 (23.9%) | 1 (7.7%) |
| 2 Vehicles | 24 (52.2%) | 7 (53.8%) |
| 3 or more Vehicles | 8 (17.4%) | 5 (38.5%) |
| Total | 46 (100.0%) | 13 (100.0%) |
Real Estate & Mortgages in Greenway
Real Estate and Mortgage Overview in Greenway
| Characteristic | Without Mortgage | With Mortgage |
| Housing Units | 31 | 15 |
| Median Property Value | $22,500 | $32,500 |
| Median Household Income | $9,028 | $0 |
| Monthly Housing Costs | $338 | $0 |
| Real Estate Taxes | $227 | $0 |
Property Value by Mortgage Status in Greenway
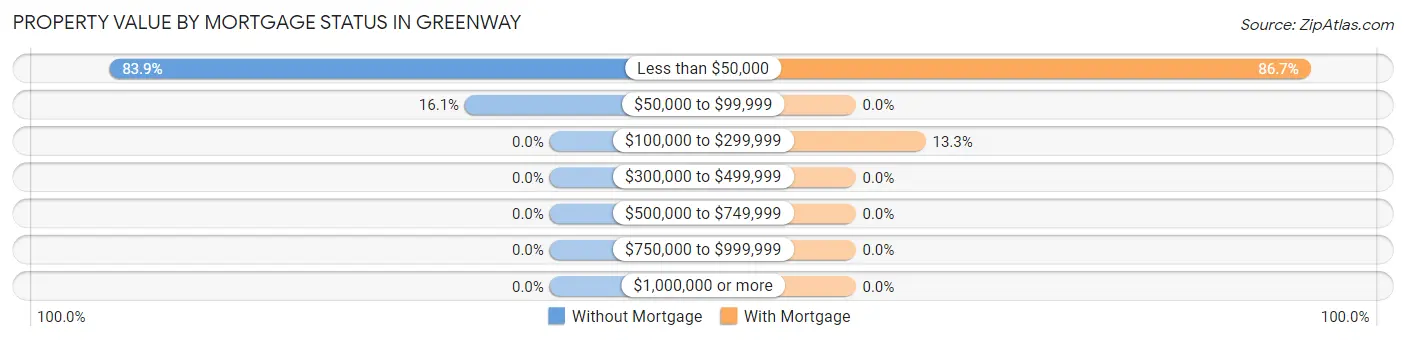
| Property Value | Without Mortgage | With Mortgage |
| Less than $50,000 | 26 (83.9%) | 13 (86.7%) |
| $50,000 to $99,999 | 5 (16.1%) | 0 (0.0%) |
| $100,000 to $299,999 | 0 (0.0%) | 2 (13.3%) |
| $300,000 to $499,999 | 0 (0.0%) | 0 (0.0%) |
| $500,000 to $749,999 | 0 (0.0%) | 0 (0.0%) |
| $750,000 to $999,999 | 0 (0.0%) | 0 (0.0%) |
| $1,000,000 or more | 0 (0.0%) | 0 (0.0%) |
| Total | 31 (100.0%) | 15 (100.0%) |
Household Income by Mortgage Status in Greenway
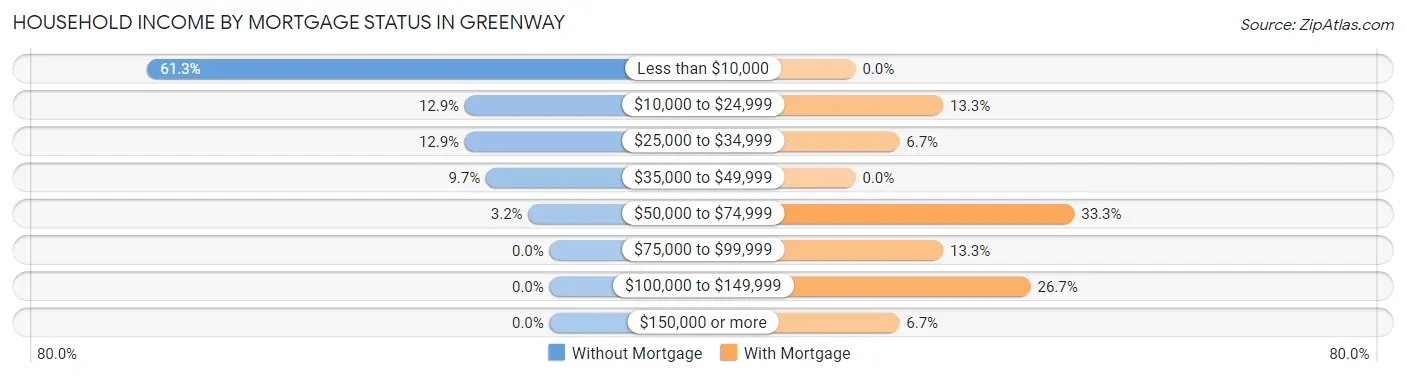
| Household Income | Without Mortgage | With Mortgage |
| Less than $10,000 | 19 (61.3%) | 0 (0.0%) |
| $10,000 to $24,999 | 4 (12.9%) | 2 (13.3%) |
| $25,000 to $34,999 | 4 (12.9%) | 1 (6.7%) |
| $35,000 to $49,999 | 3 (9.7%) | 0 (0.0%) |
| $50,000 to $74,999 | 1 (3.2%) | 5 (33.3%) |
| $75,000 to $99,999 | 0 (0.0%) | 2 (13.3%) |
| $100,000 to $149,999 | 0 (0.0%) | 4 (26.7%) |
| $150,000 or more | 0 (0.0%) | 1 (6.7%) |
| Total | 31 (100.0%) | 15 (100.0%) |
Property Value to Household Income Ratio in Greenway
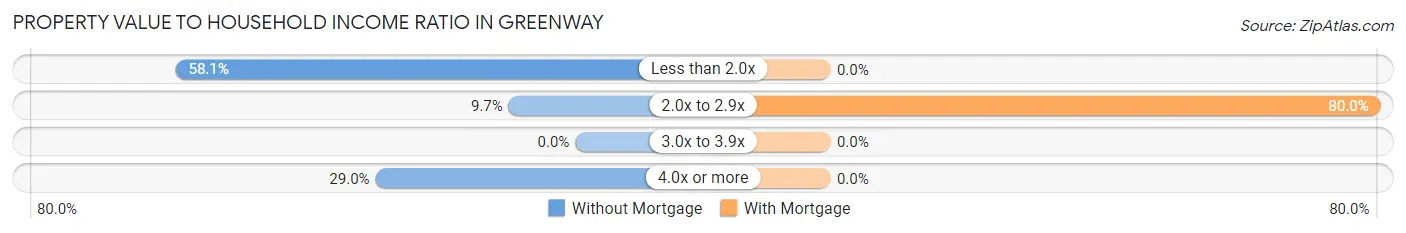
| Value-to-Income Ratio | Without Mortgage | With Mortgage |
| Less than 2.0x | 18 (58.1%) | 0 (0.0%) |
| 2.0x to 2.9x | 3 (9.7%) | 12 (80.0%) |
| 3.0x to 3.9x | 0 (0.0%) | 0 (0.0%) |
| 4.0x or more | 9 (29.0%) | 0 (0.0%) |
| Total | 31 (100.0%) | 15 (100.0%) |
Real Estate Taxes by Mortgage Status in Greenway
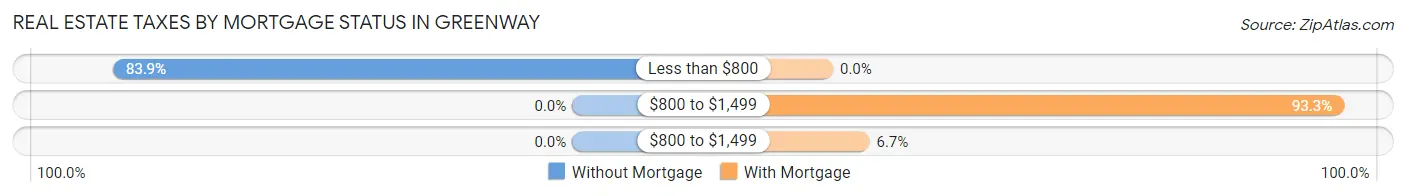
| Property Taxes | Without Mortgage | With Mortgage |
| Less than $800 | 26 (83.9%) | 0 (0.0%) |
| $800 to $1,499 | 0 (0.0%) | 14 (93.3%) |
| $800 to $1,499 | 0 (0.0%) | 1 (6.7%) |
| Total | 31 (100.0%) | 15 (100.0%) |
Health & Disability in Greenway
Health Insurance Coverage by Age in Greenway
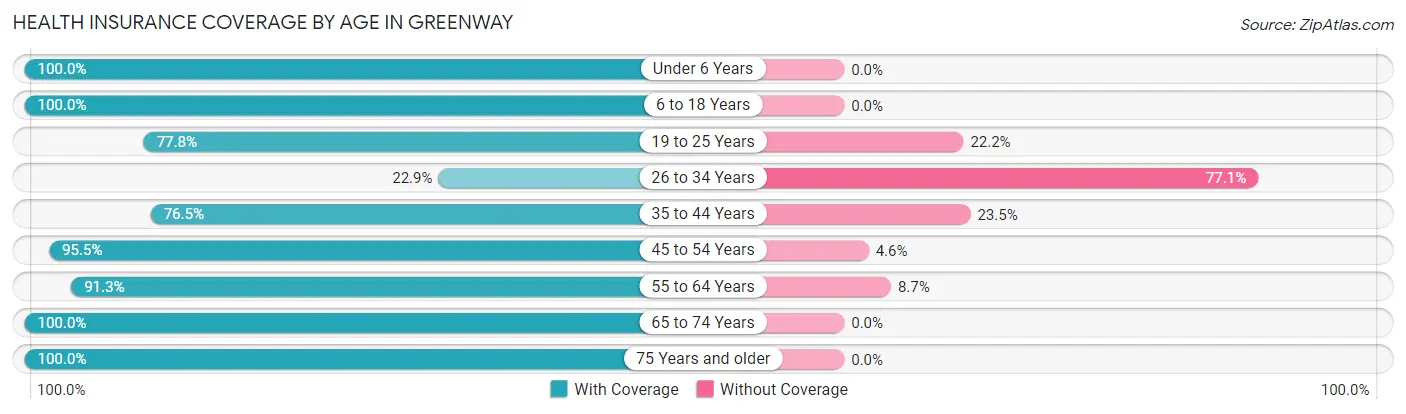
| Age Bracket | With Coverage | Without Coverage |
| Under 6 Years | 24 (100.0%) | 0 (0.0%) |
| 6 to 18 Years | 16 (100.0%) | 0 (0.0%) |
| 19 to 25 Years | 7 (77.8%) | 2 (22.2%) |
| 26 to 34 Years | 8 (22.9%) | 27 (77.1%) |
| 35 to 44 Years | 13 (76.5%) | 4 (23.5%) |
| 45 to 54 Years | 21 (95.5%) | 1 (4.5%) |
| 55 to 64 Years | 21 (91.3%) | 2 (8.7%) |
| 65 to 74 Years | 15 (100.0%) | 0 (0.0%) |
| 75 Years and older | 10 (100.0%) | 0 (0.0%) |
| Total | 135 (78.9%) | 36 (21.0%) |
Health Insurance Coverage by Citizenship Status in Greenway
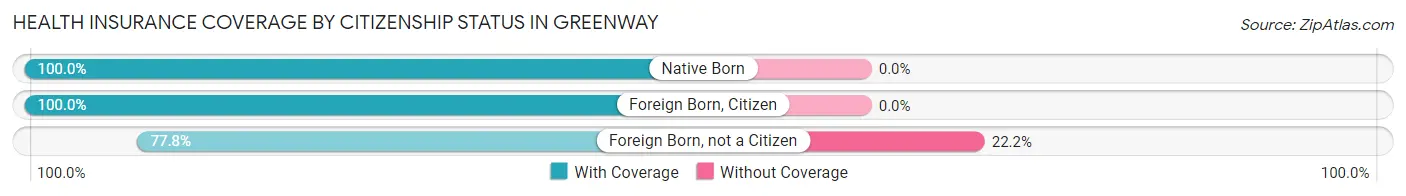
| Citizenship Status | With Coverage | Without Coverage |
| Native Born | 24 (100.0%) | 0 (0.0%) |
| Foreign Born, Citizen | 16 (100.0%) | 0 (0.0%) |
| Foreign Born, not a Citizen | 7 (77.8%) | 2 (22.2%) |
Health Insurance Coverage by Household Income in Greenway
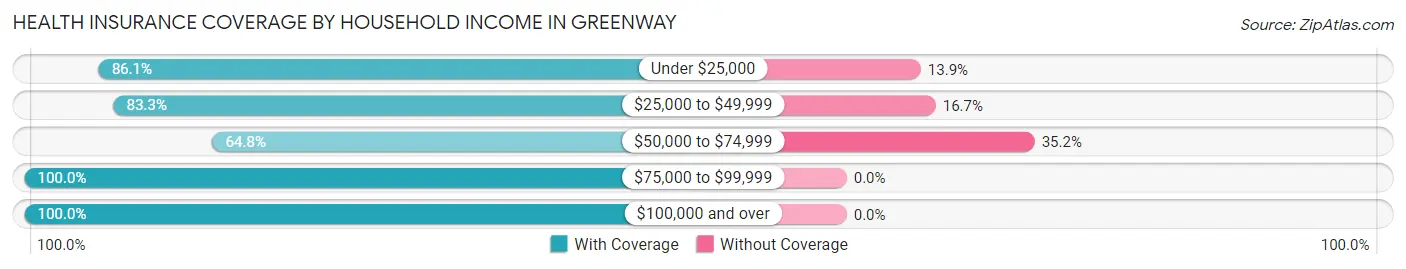
| Household Income | With Coverage | Without Coverage |
| Under $25,000 | 31 (86.1%) | 5 (13.9%) |
| $25,000 to $49,999 | 30 (83.3%) | 6 (16.7%) |
| $50,000 to $74,999 | 46 (64.8%) | 25 (35.2%) |
| $75,000 to $99,999 | 18 (100.0%) | 0 (0.0%) |
| $100,000 and over | 10 (100.0%) | 0 (0.0%) |
Public vs Private Health Insurance Coverage by Age in Greenway
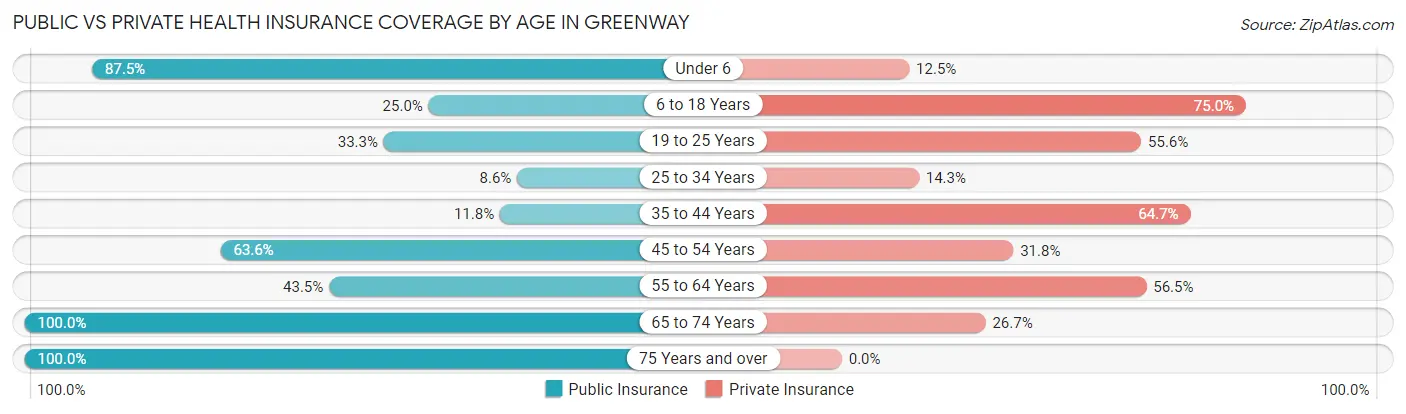
| Age Bracket | Public Insurance | Private Insurance |
| Under 6 | 21 (87.5%) | 3 (12.5%) |
| 6 to 18 Years | 4 (25.0%) | 12 (75.0%) |
| 19 to 25 Years | 3 (33.3%) | 5 (55.6%) |
| 25 to 34 Years | 3 (8.6%) | 5 (14.3%) |
| 35 to 44 Years | 2 (11.8%) | 11 (64.7%) |
| 45 to 54 Years | 14 (63.6%) | 7 (31.8%) |
| 55 to 64 Years | 10 (43.5%) | 13 (56.5%) |
| 65 to 74 Years | 15 (100.0%) | 4 (26.7%) |
| 75 Years and over | 10 (100.0%) | 0 (0.0%) |
| Total | 82 (47.9%) | 60 (35.1%) |
Disability Status by Sex by Age in Greenway
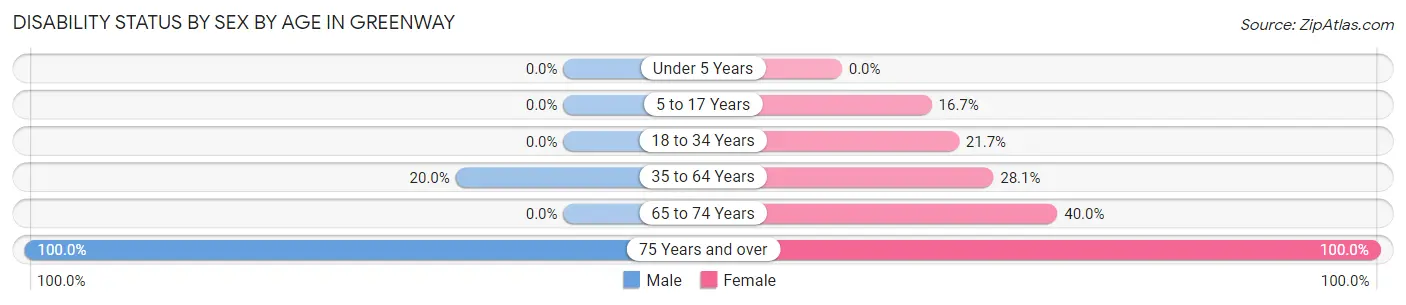
| Age Bracket | Male | Female |
| Under 5 Years | 0 (0.0%) | 0 (0.0%) |
| 5 to 17 Years | 0 (0.0%) | 1 (16.7%) |
| 18 to 34 Years | 0 (0.0%) | 5 (21.7%) |
| 35 to 64 Years | 6 (20.0%) | 9 (28.1%) |
| 65 to 74 Years | 0 (0.0%) | 4 (40.0%) |
| 75 Years and over | 5 (100.0%) | 5 (100.0%) |
Disability Class by Sex by Age in Greenway
Disability Class: Hearing Difficulty
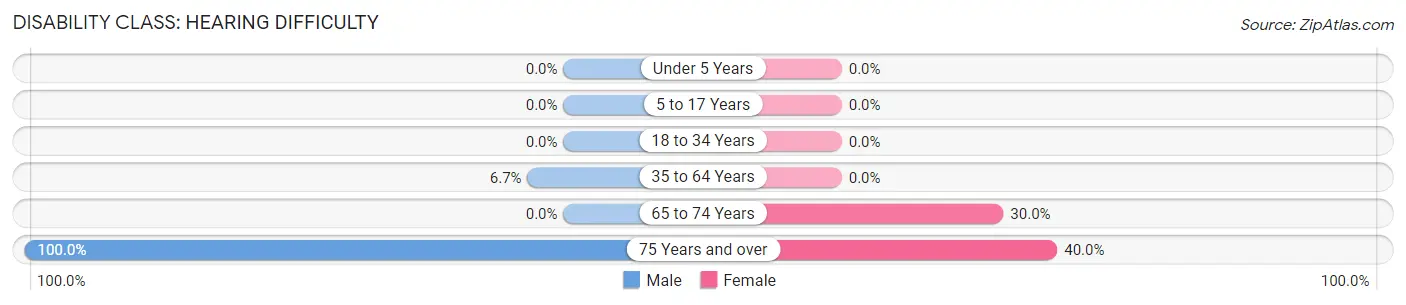
| Age Bracket | Male | Female |
| Under 5 Years | 0 (0.0%) | 0 (0.0%) |
| 5 to 17 Years | 0 (0.0%) | 0 (0.0%) |
| 18 to 34 Years | 0 (0.0%) | 0 (0.0%) |
| 35 to 64 Years | 2 (6.7%) | 0 (0.0%) |
| 65 to 74 Years | 0 (0.0%) | 3 (30.0%) |
| 75 Years and over | 5 (100.0%) | 2 (40.0%) |
Disability Class: Vision Difficulty
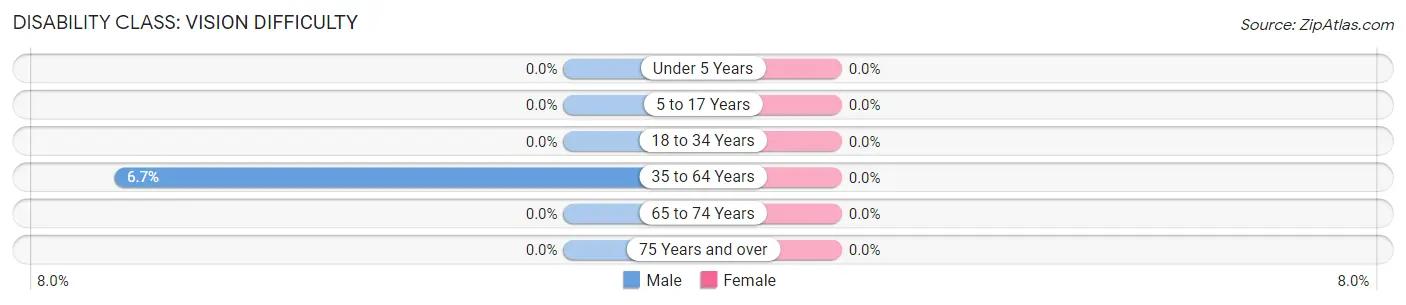
| Age Bracket | Male | Female |
| Under 5 Years | 0 (0.0%) | 0 (0.0%) |
| 5 to 17 Years | 0 (0.0%) | 0 (0.0%) |
| 18 to 34 Years | 0 (0.0%) | 0 (0.0%) |
| 35 to 64 Years | 2 (6.7%) | 0 (0.0%) |
| 65 to 74 Years | 0 (0.0%) | 0 (0.0%) |
| 75 Years and over | 0 (0.0%) | 0 (0.0%) |
Disability Class: Cognitive Difficulty
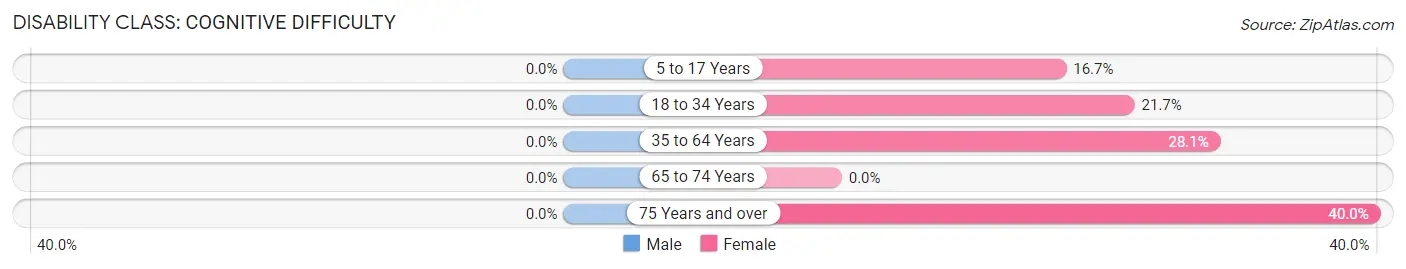
| Age Bracket | Male | Female |
| 5 to 17 Years | 0 (0.0%) | 1 (16.7%) |
| 18 to 34 Years | 0 (0.0%) | 5 (21.7%) |
| 35 to 64 Years | 0 (0.0%) | 9 (28.1%) |
| 65 to 74 Years | 0 (0.0%) | 0 (0.0%) |
| 75 Years and over | 0 (0.0%) | 2 (40.0%) |
Disability Class: Ambulatory Difficulty
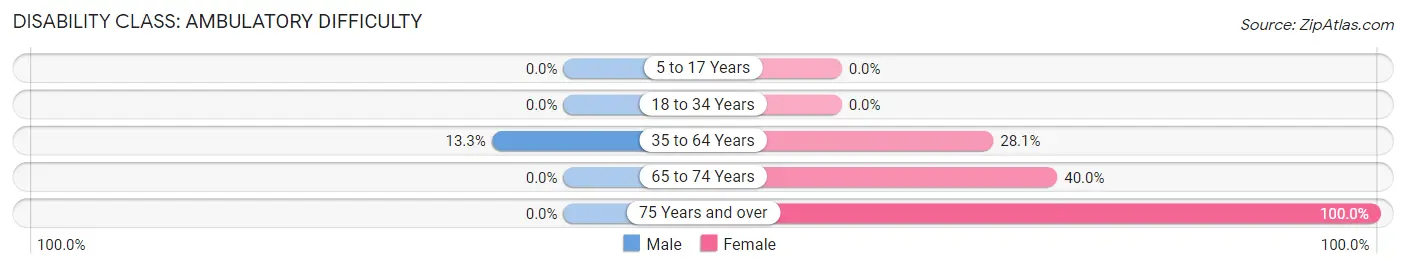
| Age Bracket | Male | Female |
| 5 to 17 Years | 0 (0.0%) | 0 (0.0%) |
| 18 to 34 Years | 0 (0.0%) | 0 (0.0%) |
| 35 to 64 Years | 4 (13.3%) | 9 (28.1%) |
| 65 to 74 Years | 0 (0.0%) | 4 (40.0%) |
| 75 Years and over | 0 (0.0%) | 5 (100.0%) |
Disability Class: Self-Care Difficulty
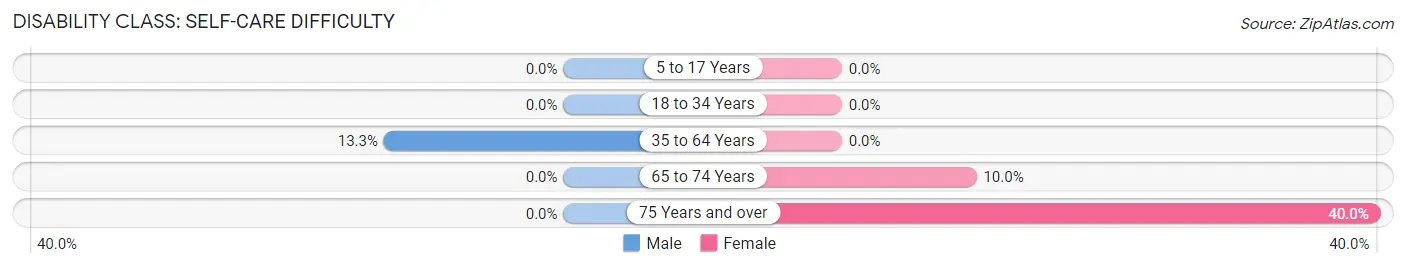
| Age Bracket | Male | Female |
| 5 to 17 Years | 0 (0.0%) | 0 (0.0%) |
| 18 to 34 Years | 0 (0.0%) | 0 (0.0%) |
| 35 to 64 Years | 4 (13.3%) | 0 (0.0%) |
| 65 to 74 Years | 0 (0.0%) | 1 (10.0%) |
| 75 Years and over | 0 (0.0%) | 2 (40.0%) |
Technology Access in Greenway
Computing Device Access in Greenway
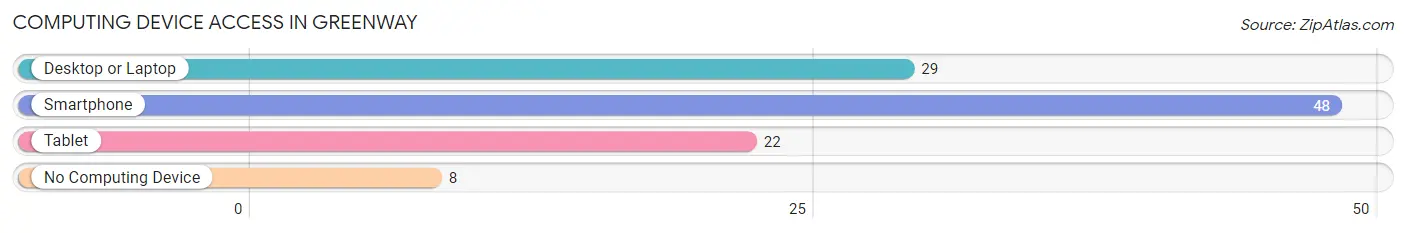
| Device Type | # Households | % Households |
| Desktop or Laptop | 29 | 49.1% |
| Smartphone | 48 | 81.4% |
| Tablet | 22 | 37.3% |
| No Computing Device | 8 | 13.6% |
| Total | 59 | 100.0% |
Internet Access in Greenway
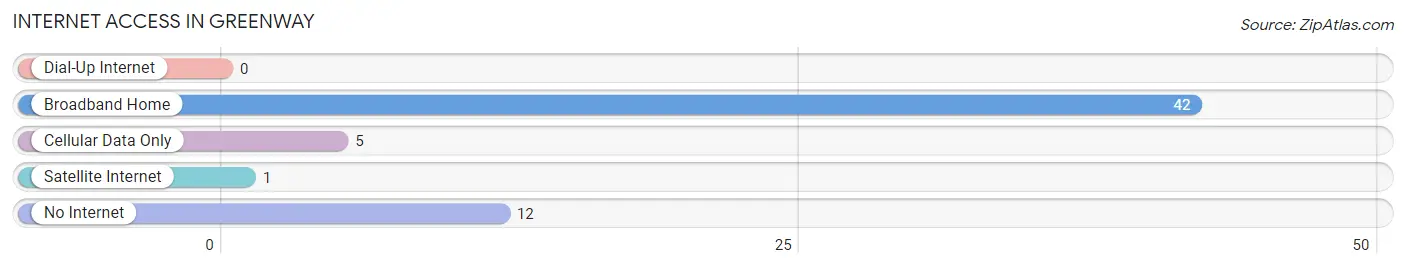
| Internet Type | # Households | % Households |
| Dial-Up Internet | 0 | 0.0% |
| Broadband Home | 42 | 71.2% |
| Cellular Data Only | 5 | 8.5% |
| Satellite Internet | 1 | 1.7% |
| No Internet | 12 | 20.3% |
| Total | 59 | 100.0% |
Greenway Summary
Greenway, Arkansas is a small town located in Clay County in the northeastern part of the state. It is situated on the banks of the St. Francis River, and is part of the Little Rock-North Little Rock-Conway Metropolitan Statistical Area. The town has a population of just over 1,000 people, and is known for its rural charm and friendly atmosphere.
History
Greenway was founded in 1883 by a group of settlers from the nearby town of Corning. The town was named after the Greenway family, who were among the first settlers. The town was originally a farming community, and the main crops grown were cotton, corn, and wheat. In the early 1900s, the town began to grow and develop, and by the 1920s it had become a thriving community.
In the 1950s, the town began to experience a decline in population as many of its residents moved away in search of better economic opportunities. However, in the late 1970s, the town began to experience a resurgence in population as people began to move back to the area. Today, Greenway is a small but vibrant community with a population of just over 1,000 people.
Geography
Greenway is located in Clay County in the northeastern part of Arkansas. It is situated on the banks of the St. Francis River, and is part of the Little Rock-North Little Rock-Conway Metropolitan Statistical Area. The town is located about 30 miles from the state capital of Little Rock.
The town has a total area of 1.2 square miles, all of which is land. The terrain is mostly flat, with some rolling hills in the surrounding area. The climate is humid subtropical, with hot summers and mild winters.
Economy
Greenway’s economy is largely based on agriculture. The main crops grown in the area are cotton, corn, and wheat. The town also has a few small businesses, including a grocery store, a hardware store, and a few restaurants.
The town is also home to a few manufacturing companies, including a furniture factory and a plastics factory. The town also has a few small service-based businesses, such as auto repair shops and a few small retail stores.
Demographics
As of the 2010 census, Greenway had a population of 1,072 people. The racial makeup of the town was 95.3% White, 0.9% African American, 0.3% Native American, 0.3% Asian, 0.1% Pacific Islander, and 2.1% from other races. Hispanic or Latino of any race were 2.7% of the population.
The median household income in Greenway was $30,938, and the median family income was $37,500. The per capita income for the town was $15,945. About 17.2% of the population was below the poverty line.
Greenway is a small but vibrant town with a rich history and a friendly atmosphere. The town is known for its rural charm and its strong sense of community. The town’s economy is largely based on agriculture, and the town also has a few small businesses and manufacturing companies. The town has a population of just over 1,000 people, and the racial makeup is mostly White. The median household income is slightly below the state average, and the poverty rate is slightly higher than the state average.
Common Questions
What is the Total Population of Greenway?
Total Population of Greenway is 171.
What is the Total Male Population of Greenway?
Total Male Population of Greenway is 85.
What is the Total Female Population of Greenway?
Total Female Population of Greenway is 86.
What is the Ratio of Males per 100 Females in Greenway?
There are 98.84 Males per 100 Females in Greenway.
What is the Ratio of Females per 100 Males in Greenway?
There are 101.18 Females per 100 Males in Greenway.
What is the Median Population Age in Greenway?
Median Population Age in Greenway is 35.8 Years.
What is the Average Family Size in Greenway
Average Family Size in Greenway is 5.0 People.
What is the Average Household Size in Greenway
Average Household Size in Greenway is 2.9 People.
What is Per Capita Income in Greenway?
Per Capita income in Greenway is $13,614.
What is the Median Family Income in Greenway?
Median Family Income in Greenway is $42,292.
What is the Median Household income in Greenway?
Median Household Income in Greenway is $30,625.
What is Inequality or Gini Index in Greenway?
Inequality or Gini Index in Greenway is 0.46.
How Large is the Labor Force in Greenway?
There are 51 People in the Labor Forcein in Greenway.
What is the Percentage of People in the Labor Force in Greenway?
36.2% of People are in the Labor Force in Greenway.