England, AR
England Map
England Overview
2,562
TOTAL POPULATION
1,254
MALE POPULATION
1,308
FEMALE POPULATION
95.87
MALES / 100 FEMALES
104.31
FEMALES / 100 MALES
40.1
MEDIAN AGE
3.0
AVG FAMILY SIZE
2.4
AVG HOUSEHOLD SIZE
$34,387
PER CAPITA INCOME
$70,500
AVG FAMILY INCOME
$53,036
AVG HOUSEHOLD INCOME
28.5%
WAGE / INCOME GAP [ % ]
71.5¢/ $1
WAGE / INCOME GAP [ $ ]
0.53
INEQUALITY / GINI INDEX
1,178
LABOR FORCE [ PEOPLE ]
57.2%
PERCENT IN LABOR FORCE
5.5%
UNEMPLOYMENT RATE
England Zip Codes
England Area Codes
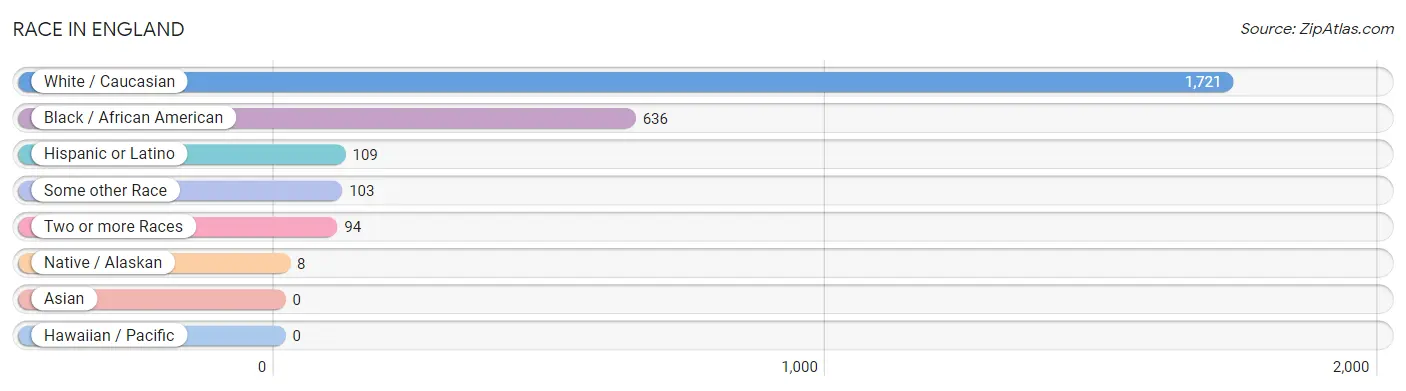
Race in England
The most populous races in England are White / Caucasian (1,721 | 67.2%), Black / African American (636 | 24.8%), and Hispanic or Latino (109 | 4.3%).
| Race | # Population | % Population |
| Asian | 0 | 0.0% |
| Black / African American | 636 | 24.8% |
| Hawaiian / Pacific | 0 | 0.0% |
| Hispanic or Latino | 109 | 4.3% |
| Native / Alaskan | 8 | 0.3% |
| White / Caucasian | 1,721 | 67.2% |
| Two or more Races | 94 | 3.7% |
| Some other Race | 103 | 4.0% |
| Total | 2,562 | 100.0% |
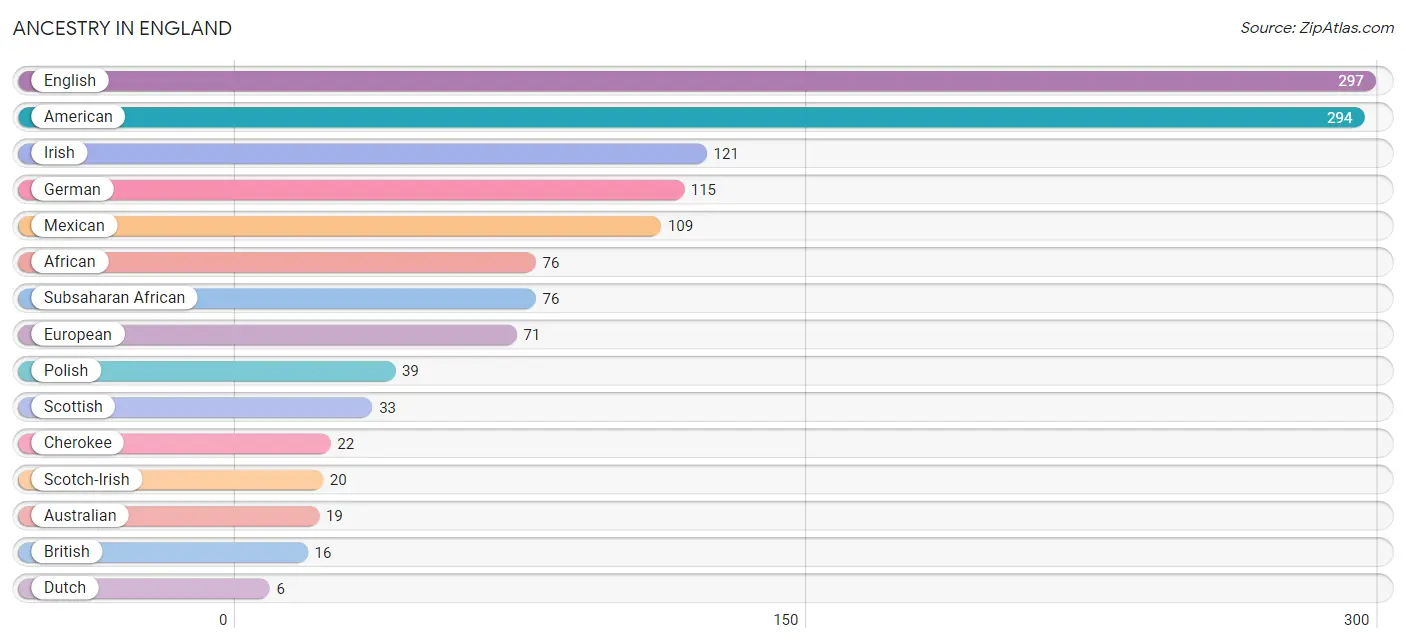
Ancestry in England
The most populous ancestries reported in England are English (297 | 11.6%), American (294 | 11.5%), Irish (121 | 4.7%), German (115 | 4.5%), and Mexican (109 | 4.3%), together accounting for 36.5% of all England residents.
| Ancestry | # Population | % Population |
| African | 76 | 3.0% |
| American | 294 | 11.5% |
| Australian | 19 | 0.7% |
| British | 16 | 0.6% |
| Cherokee | 22 | 0.9% |
| Czech | 4 | 0.2% |
| Dutch | 6 | 0.2% |
| English | 297 | 11.6% |
| European | 71 | 2.8% |
| French | 5 | 0.2% |
| German | 115 | 4.5% |
| Irish | 121 | 4.7% |
| Mexican | 109 | 4.3% |
| Polish | 39 | 1.5% |
| Scotch-Irish | 20 | 0.8% |
| Scottish | 33 | 1.3% |
| Subsaharan African | 76 | 3.0% | View All 17 Rows |
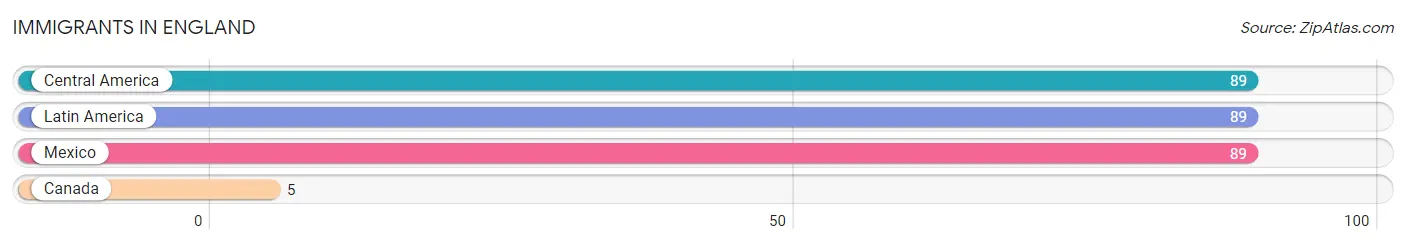
Immigrants in England
The most numerous immigrant groups reported in England came from Central America (89 | 3.5%), Latin America (89 | 3.5%), Mexico (89 | 3.5%), and Canada (5 | 0.2%), together accounting for 10.6% of all England residents.
| Immigration Origin | # Population | % Population |
| Canada | 5 | 0.2% |
| Central America | 89 | 3.5% |
| Latin America | 89 | 3.5% |
| Mexico | 89 | 3.5% | View All 4 Rows |
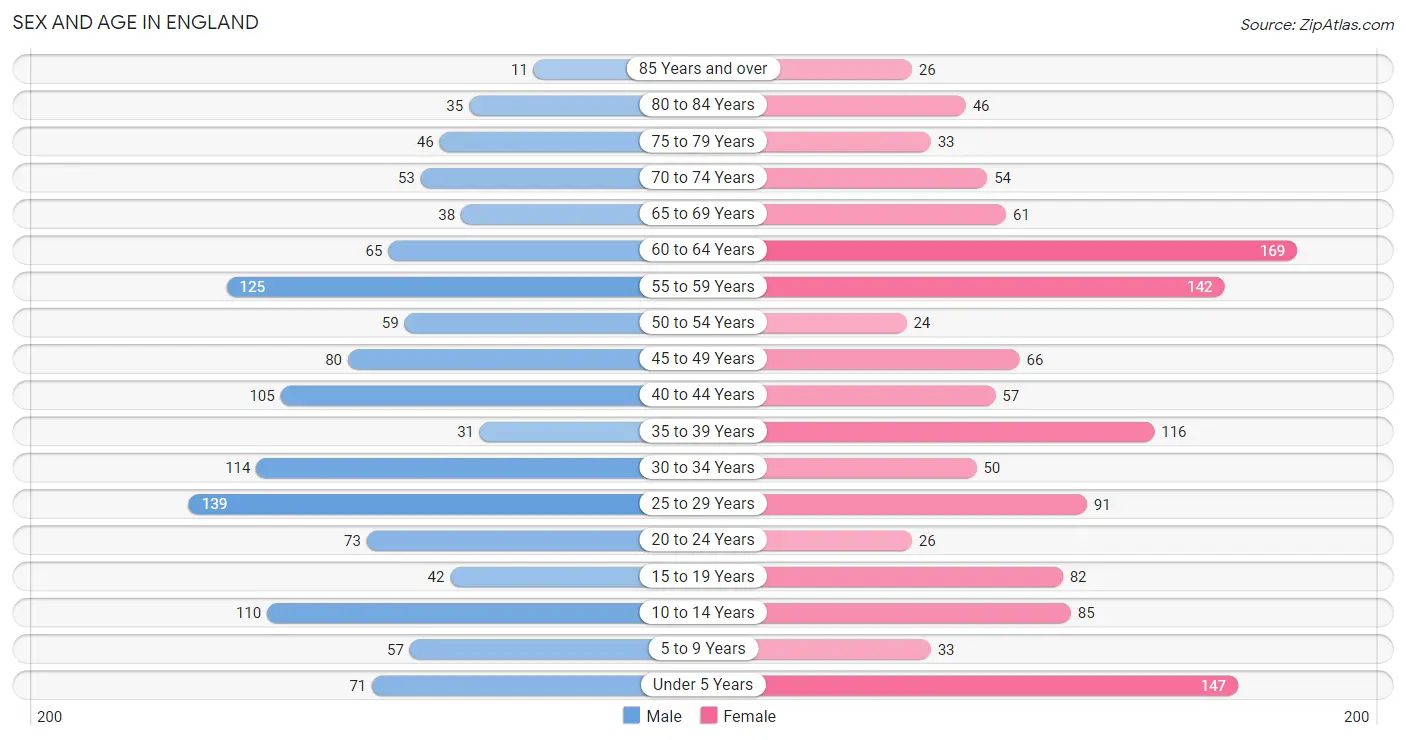
Sex and Age in England
Sex and Age in England
The most populous age groups in England are 25 to 29 Years (139 | 11.1%) for men and 60 to 64 Years (169 | 12.9%) for women.
| Age Bracket | Male | Female |
| Under 5 Years | 71 (5.7%) | 147 (11.2%) |
| 5 to 9 Years | 57 (4.5%) | 33 (2.5%) |
| 10 to 14 Years | 110 (8.8%) | 85 (6.5%) |
| 15 to 19 Years | 42 (3.4%) | 82 (6.3%) |
| 20 to 24 Years | 73 (5.8%) | 26 (2.0%) |
| 25 to 29 Years | 139 (11.1%) | 91 (7.0%) |
| 30 to 34 Years | 114 (9.1%) | 50 (3.8%) |
| 35 to 39 Years | 31 (2.5%) | 116 (8.9%) |
| 40 to 44 Years | 105 (8.4%) | 57 (4.4%) |
| 45 to 49 Years | 80 (6.4%) | 66 (5.1%) |
| 50 to 54 Years | 59 (4.7%) | 24 (1.8%) |
| 55 to 59 Years | 125 (10.0%) | 142 (10.9%) |
| 60 to 64 Years | 65 (5.2%) | 169 (12.9%) |
| 65 to 69 Years | 38 (3.0%) | 61 (4.7%) |
| 70 to 74 Years | 53 (4.2%) | 54 (4.1%) |
| 75 to 79 Years | 46 (3.7%) | 33 (2.5%) |
| 80 to 84 Years | 35 (2.8%) | 46 (3.5%) |
| 85 Years and over | 11 (0.9%) | 26 (2.0%) |
| Total | 1,254 (100.0%) | 1,308 (100.0%) |
Families and Households in England
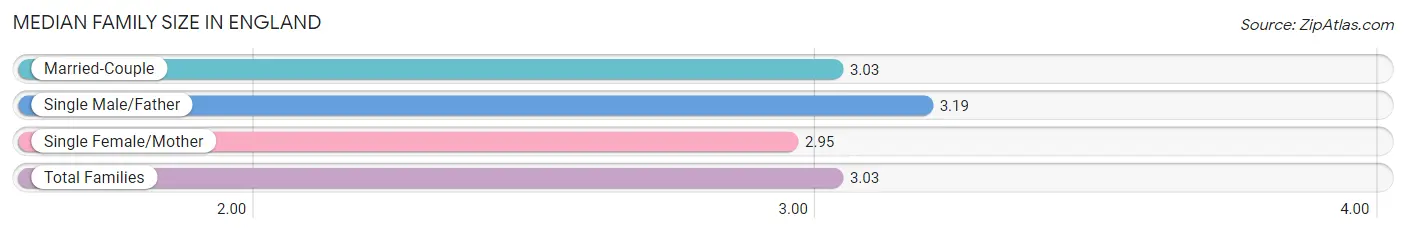
Median Family Size in England
The median family size in England is 3.03 persons per family, with single male/father families (63 | 9.1%) accounting for the largest median family size of 3.19 persons per family. On the other hand, single female/mother families (115 | 16.6%) represent the smallest median family size with 2.95 persons per family.
| Family Type | # Families | Family Size |
| Married-Couple | 514 (74.3%) | 3.03 |
| Single Male/Father | 63 (9.1%) | 3.19 |
| Single Female/Mother | 115 (16.6%) | 2.95 |
| Total Families | 692 (100.0%) | 3.03 |
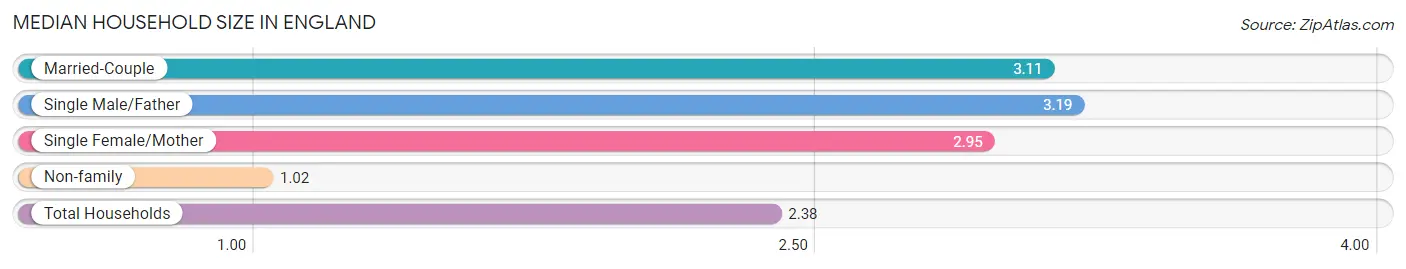
Median Household Size in England
The median household size in England is 2.38 persons per household, with single male/father households (63 | 6.0%) accounting for the largest median household size of 3.19 persons per household. non-family households (359 | 34.2%) represent the smallest median household size with 1.02 persons per household.
| Household Type | # Households | Household Size |
| Married-Couple | 514 (48.9%) | 3.11 |
| Single Male/Father | 63 (6.0%) | 3.19 |
| Single Female/Mother | 115 (10.9%) | 2.95 |
| Non-family | 359 (34.2%) | 1.02 |
| Total Households | 1,051 (100.0%) | 2.38 |
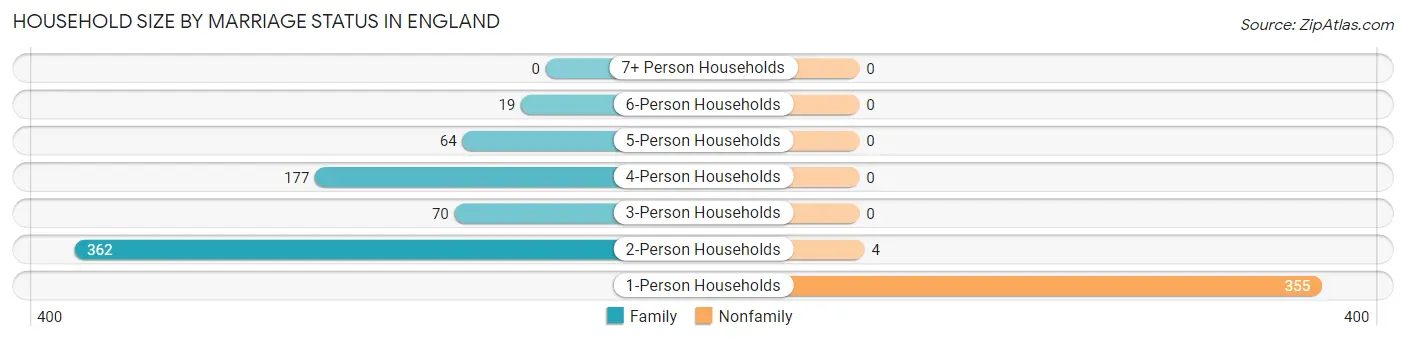
Household Size by Marriage Status in England
Out of a total of 1,051 households in England, 692 (65.8%) are family households, while 359 (34.2%) are nonfamily households. The most numerous type of family households are 2-person households, comprising 362, and the most common type of nonfamily households are 1-person households, comprising 355.
| Household Size | Family Households | Nonfamily Households |
| 1-Person Households | - | 355 (33.8%) |
| 2-Person Households | 362 (34.4%) | 4 (0.4%) |
| 3-Person Households | 70 (6.7%) | 0 (0.0%) |
| 4-Person Households | 177 (16.8%) | 0 (0.0%) |
| 5-Person Households | 64 (6.1%) | 0 (0.0%) |
| 6-Person Households | 19 (1.8%) | 0 (0.0%) |
| 7+ Person Households | 0 (0.0%) | 0 (0.0%) |
| Total | 692 (65.8%) | 359 (34.2%) |
Female Fertility in England
Fertility by Age in England
Average fertility rate in England is 49.0 births per 1,000 women. Women in the age bracket of 20 to 34 years have the highest fertility rate with 66.0 births per 1,000 women. Women in the age bracket of 35 to 50 years acount for 54.2% of all women with births.
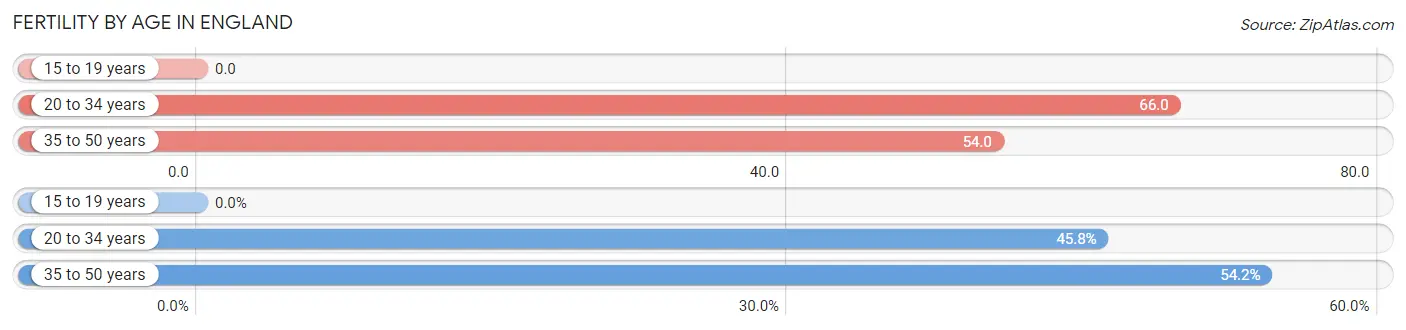
| Age Bracket | Women with Births | Births / 1,000 Women |
| 15 to 19 years | 0 (0.0%) | 0.0 |
| 20 to 34 years | 11 (45.8%) | 66.0 |
| 35 to 50 years | 13 (54.2%) | 54.0 |
| Total | 24 (100.0%) | 49.0 |
Fertility by Age by Marriage Status in England
75.0% of women with births (24) in England are married. The highest percentage of unmarried women with births falls into 20 to 34 years age bracket with 54.5% of them unmarried at the time of birth, while the lowest percentage of unmarried women with births belong to 35 to 50 years age bracket with 0.0% of them unmarried.
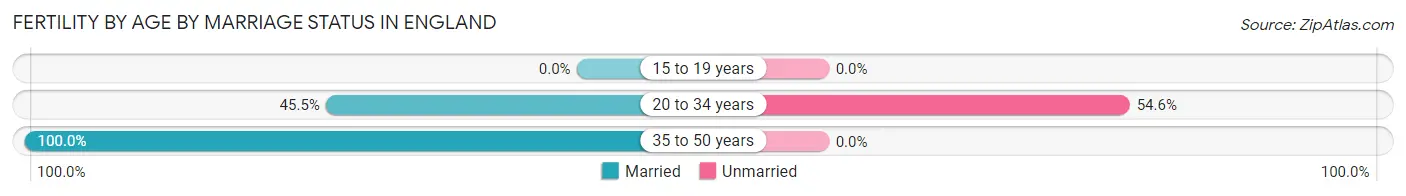
| Age Bracket | Married | Unmarried |
| 15 to 19 years | 0 (0.0%) | 0 (0.0%) |
| 20 to 34 years | 5 (45.5%) | 6 (54.5%) |
| 35 to 50 years | 13 (100.0%) | 0 (0.0%) |
| Total | 18 (75.0%) | 6 (25.0%) |
Fertility by Education in England
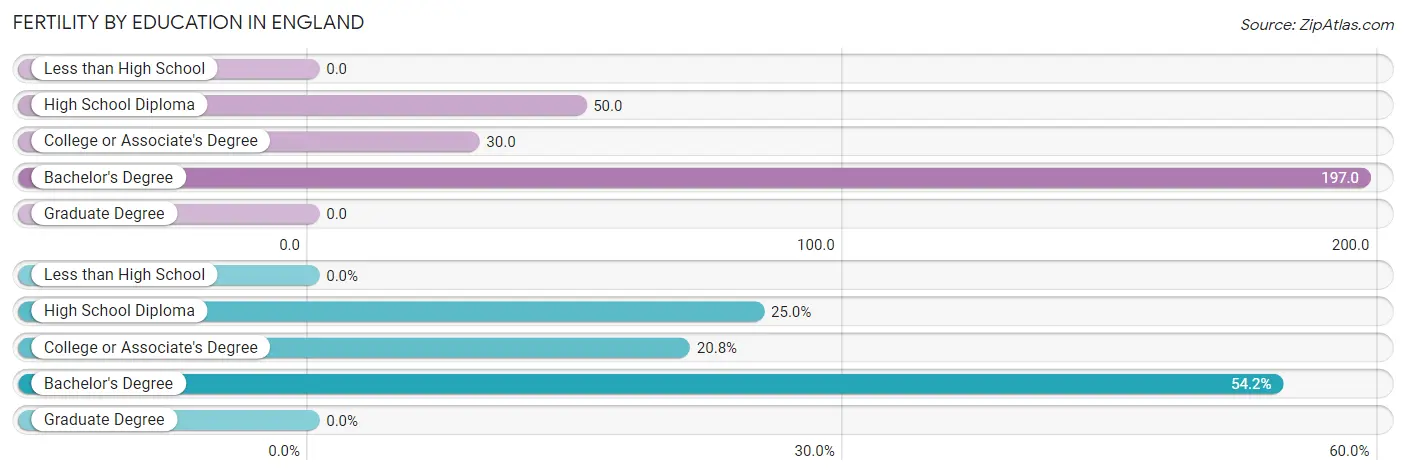
| Educational Attainment | Women with Births | Births / 1,000 Women |
| Less than High School | 0 (0.0%) | 0.0 |
| High School Diploma | 6 (25.0%) | 50.0 |
| College or Associate's Degree | 5 (20.8%) | 30.0 |
| Bachelor's Degree | 13 (54.2%) | 197.0 |
| Graduate Degree | 0 (0.0%) | 0.0 |
| Total | 24 (100.0%) | 49.0 |
Fertility by Education by Marriage Status in England
25.0% of women with births in England are unmarried. Women with the educational attainment of college or associate's degree are most likely to be married with 100.0% of them married at childbirth, while women with the educational attainment of high school diploma are least likely to be married with 100.0% of them unmarried at childbirth.
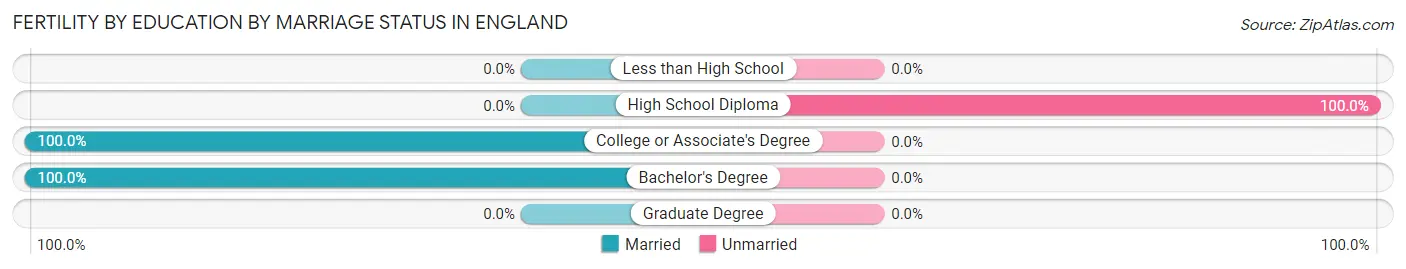
| Educational Attainment | Married | Unmarried |
| Less than High School | 0 (0.0%) | 0 (0.0%) |
| High School Diploma | 0 (0.0%) | 6 (100.0%) |
| College or Associate's Degree | 5 (100.0%) | 0 (0.0%) |
| Bachelor's Degree | 13 (100.0%) | 0 (0.0%) |
| Graduate Degree | 0 (0.0%) | 0 (0.0%) |
| Total | 18 (75.0%) | 6 (25.0%) |
Income in England
Income Overview in England
Per Capita Income in England is $34,387, while median incomes of families and households are $70,500 and $53,036 respectively.
| Characteristic | Number | Measure |
| Per Capita Income | 2,562 | $34,387 |
| Median Family Income | 692 | $70,500 |
| Mean Family Income | 692 | $104,247 |
| Median Household Income | 1,051 | $53,036 |
| Mean Household Income | 1,051 | $79,888 |
| Income Deficit | 692 | $0 |
| Wage / Income Gap (%) | 2,562 | 28.50% |
| Wage / Income Gap ($) | 2,562 | 71.50¢ per $1 |
| Gini / Inequality Index | 2,562 | 0.53 |
Earnings by Sex in England
Average Earnings in England are $36,133, $29,660 for men and $41,484 for women, a difference of 28.5%.
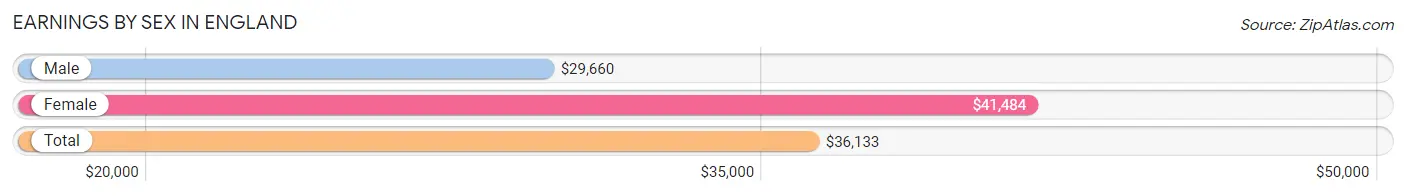
| Sex | Number | Average Earnings |
| Male | 679 (53.2%) | $29,660 |
| Female | 596 (46.8%) | $41,484 |
| Total | 1,275 (100.0%) | $36,133 |
Earnings by Sex by Income Bracket in England
The most common earnings brackets in England are $25,000 to $29,999 for men (132 | 19.4%) and $45,000 to $49,999 for women (133 | 22.3%).
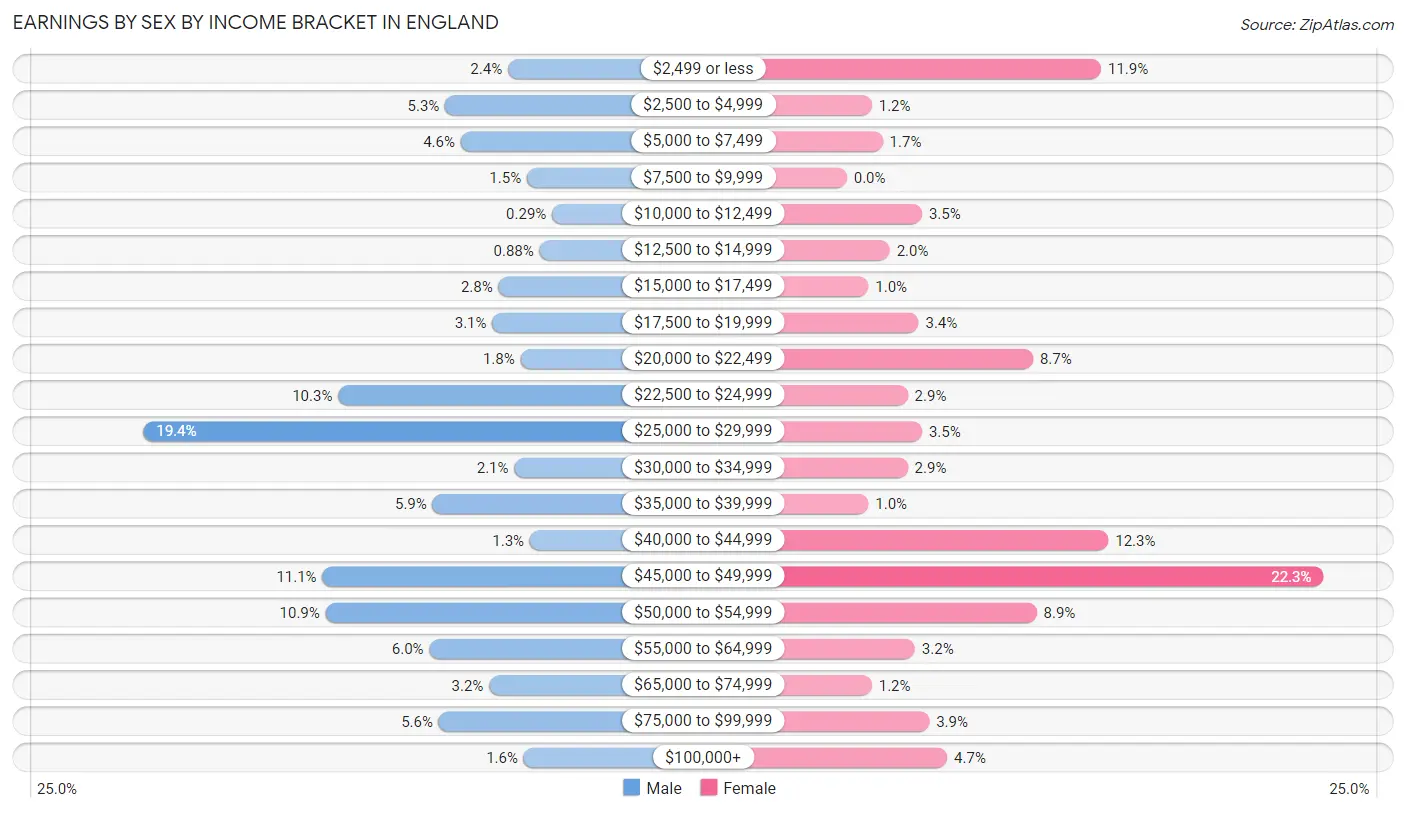
| Income | Male | Female |
| $2,499 or less | 16 (2.4%) | 71 (11.9%) |
| $2,500 to $4,999 | 36 (5.3%) | 7 (1.2%) |
| $5,000 to $7,499 | 31 (4.6%) | 10 (1.7%) |
| $7,500 to $9,999 | 10 (1.5%) | 0 (0.0%) |
| $10,000 to $12,499 | 2 (0.3%) | 21 (3.5%) |
| $12,500 to $14,999 | 6 (0.9%) | 12 (2.0%) |
| $15,000 to $17,499 | 19 (2.8%) | 6 (1.0%) |
| $17,500 to $19,999 | 21 (3.1%) | 20 (3.4%) |
| $20,000 to $22,499 | 12 (1.8%) | 52 (8.7%) |
| $22,500 to $24,999 | 70 (10.3%) | 17 (2.9%) |
| $25,000 to $29,999 | 132 (19.4%) | 21 (3.5%) |
| $30,000 to $34,999 | 14 (2.1%) | 17 (2.9%) |
| $35,000 to $39,999 | 40 (5.9%) | 6 (1.0%) |
| $40,000 to $44,999 | 9 (1.3%) | 73 (12.2%) |
| $45,000 to $49,999 | 75 (11.1%) | 133 (22.3%) |
| $50,000 to $54,999 | 74 (10.9%) | 53 (8.9%) |
| $55,000 to $64,999 | 41 (6.0%) | 19 (3.2%) |
| $65,000 to $74,999 | 22 (3.2%) | 7 (1.2%) |
| $75,000 to $99,999 | 38 (5.6%) | 23 (3.9%) |
| $100,000+ | 11 (1.6%) | 28 (4.7%) |
| Total | 679 (100.0%) | 596 (100.0%) |
Earnings by Sex by Educational Attainment in England
Average earnings in England are $29,836 for men and $44,306 for women, a difference of 32.7%. Men with an educational attainment of bachelor's degree enjoy the highest average annual earnings of $57,917, while those with high school diploma education earn the least with $28,684. Women with an educational attainment of graduate degree earn the most with the average annual earnings of $52,763, while those with high school diploma education have the smallest earnings of $33,125.
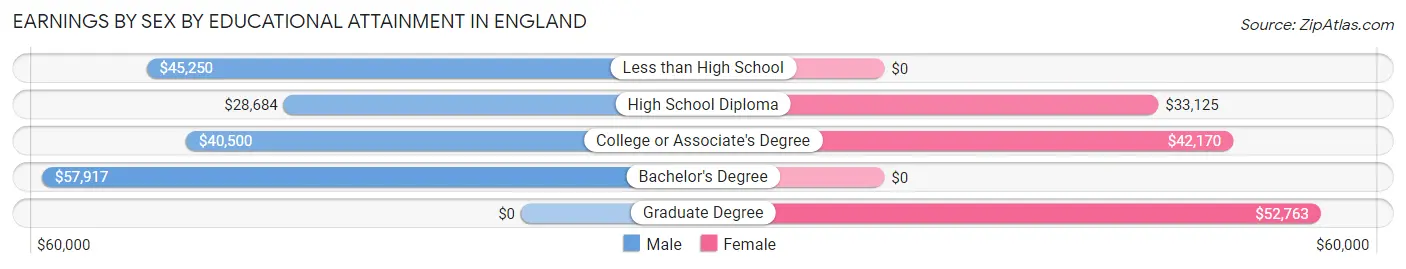
| Educational Attainment | Male Income | Female Income |
| Less than High School | $45,250 | $0 |
| High School Diploma | $28,684 | $33,125 |
| College or Associate's Degree | $40,500 | $42,170 |
| Bachelor's Degree | $57,917 | $0 |
| Graduate Degree | - | - |
| Total | $29,836 | $44,306 |
Family Income in England
Family Income Brackets in England
According to the England family income data, there are 143 families falling into the $100,000 to $149,999 income range, which is the most common income bracket and makes up 20.7% of all families.
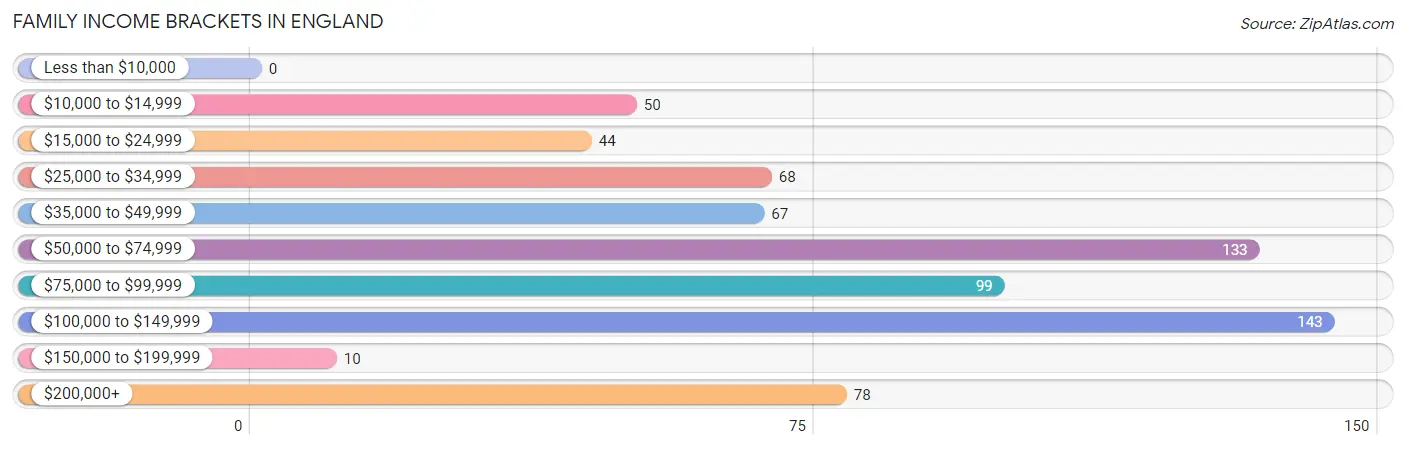
| Income Bracket | # Families | % Families |
| Less than $10,000 | 0 | 0.0% |
| $10,000 to $14,999 | 50 | 7.2% |
| $15,000 to $24,999 | 44 | 6.4% |
| $25,000 to $34,999 | 68 | 9.8% |
| $35,000 to $49,999 | 67 | 9.7% |
| $50,000 to $74,999 | 133 | 19.2% |
| $75,000 to $99,999 | 99 | 14.3% |
| $100,000 to $149,999 | 143 | 20.7% |
| $150,000 to $199,999 | 10 | 1.4% |
| $200,000+ | 78 | 11.3% |
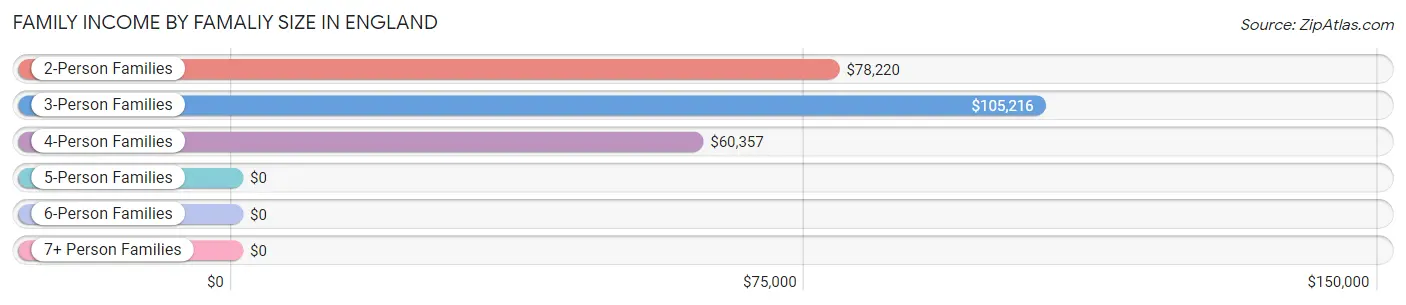
Family Income by Famaliy Size in England
3-person families (77 | 11.1%) account for the highest median family income in England with $105,216 per family, while 2-person families (371 | 53.6%) have the highest median income of $39,110 per family member.
| Income Bracket | # Families | Median Income |
| 2-Person Families | 371 (53.6%) | $78,220 |
| 3-Person Families | 77 (11.1%) | $105,216 |
| 4-Person Families | 168 (24.3%) | $60,357 |
| 5-Person Families | 57 (8.2%) | $0 |
| 6-Person Families | 19 (2.8%) | $0 |
| 7+ Person Families | 0 (0.0%) | $0 |
| Total | 692 (100.0%) | $70,500 |
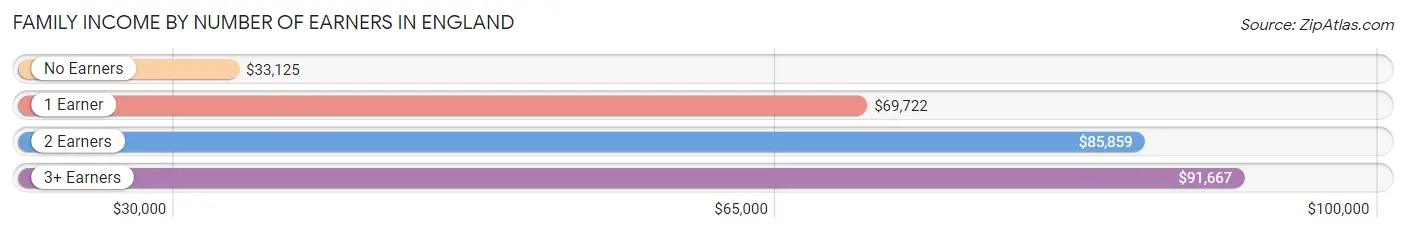
Family Income by Number of Earners in England
The median family income in England is $70,500, with families comprising 3+ earners (66) having the highest median family income of $91,667, while families with no earners (143) have the lowest median family income of $33,125, accounting for 9.5% and 20.7% of families, respectively.
| Number of Earners | # Families | Median Income |
| No Earners | 143 (20.7%) | $33,125 |
| 1 Earner | 116 (16.8%) | $69,722 |
| 2 Earners | 367 (53.0%) | $85,859 |
| 3+ Earners | 66 (9.5%) | $91,667 |
| Total | 692 (100.0%) | $70,500 |
Household Income in England
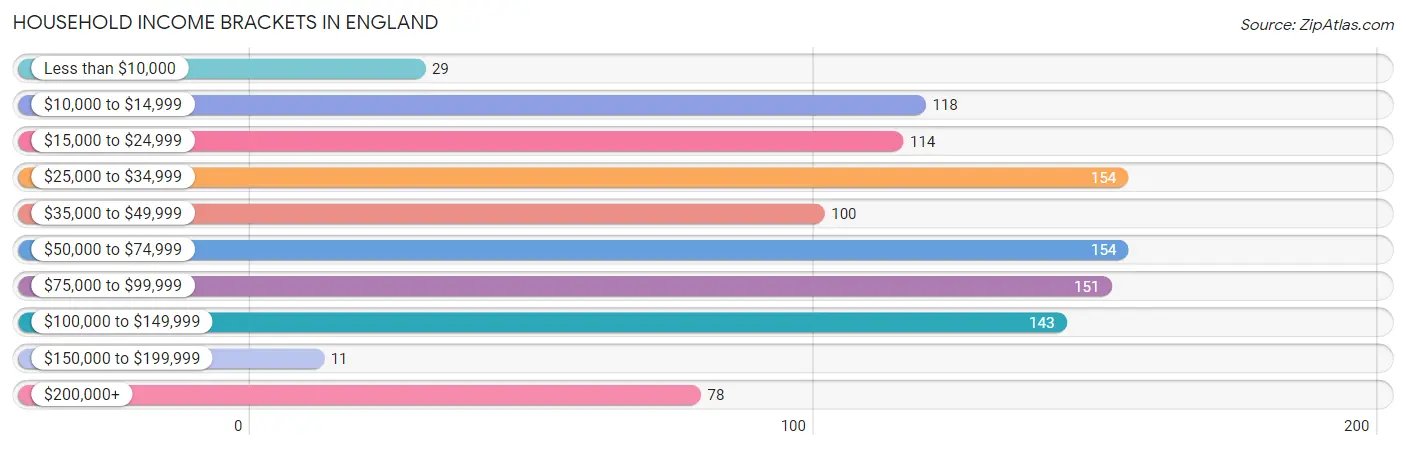
Household Income Brackets in England
With 154 households falling in the category, the $25,000 to $34,999 income range is the most frequent in England, accounting for 14.6% of all households. In contrast, only 11 households (1.1%) fall into the $150,000 to $199,999 income bracket, making it the least populous group.
| Income Bracket | # Households | % Households |
| Less than $10,000 | 29 | 2.8% |
| $10,000 to $14,999 | 118 | 11.2% |
| $15,000 to $24,999 | 114 | 10.8% |
| $25,000 to $34,999 | 154 | 14.7% |
| $35,000 to $49,999 | 100 | 9.5% |
| $50,000 to $74,999 | 154 | 14.7% |
| $75,000 to $99,999 | 151 | 14.4% |
| $100,000 to $149,999 | 143 | 13.6% |
| $150,000 to $199,999 | 11 | 1.0% |
| $200,000+ | 78 | 7.4% |
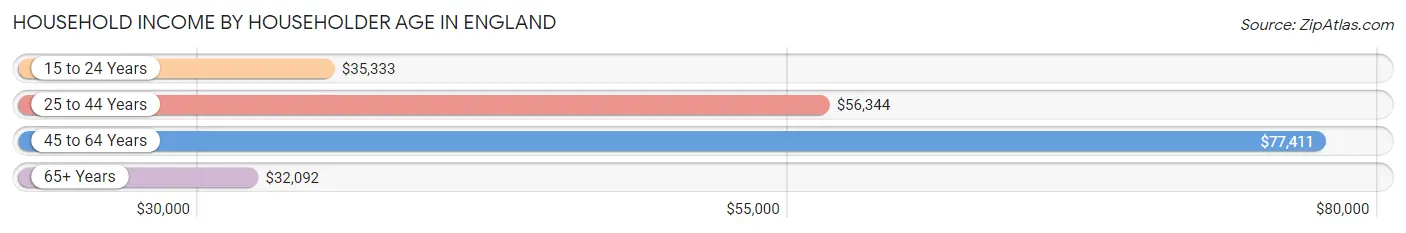
Household Income by Householder Age in England
The median household income in England is $53,036, with the highest median household income of $77,411 found in the 45 to 64 years age bracket for the primary householder. A total of 455 households (43.3%) fall into this category. Meanwhile, the 65+ years age bracket for the primary householder has the lowest median household income of $32,092, with 265 households (25.2%) in this group.
| Income Bracket | # Households | Median Income |
| 15 to 24 Years | 26 (2.5%) | $35,333 |
| 25 to 44 Years | 305 (29.0%) | $56,344 |
| 45 to 64 Years | 455 (43.3%) | $77,411 |
| 65+ Years | 265 (25.2%) | $32,092 |
| Total | 1,051 (100.0%) | $53,036 |
Poverty in England
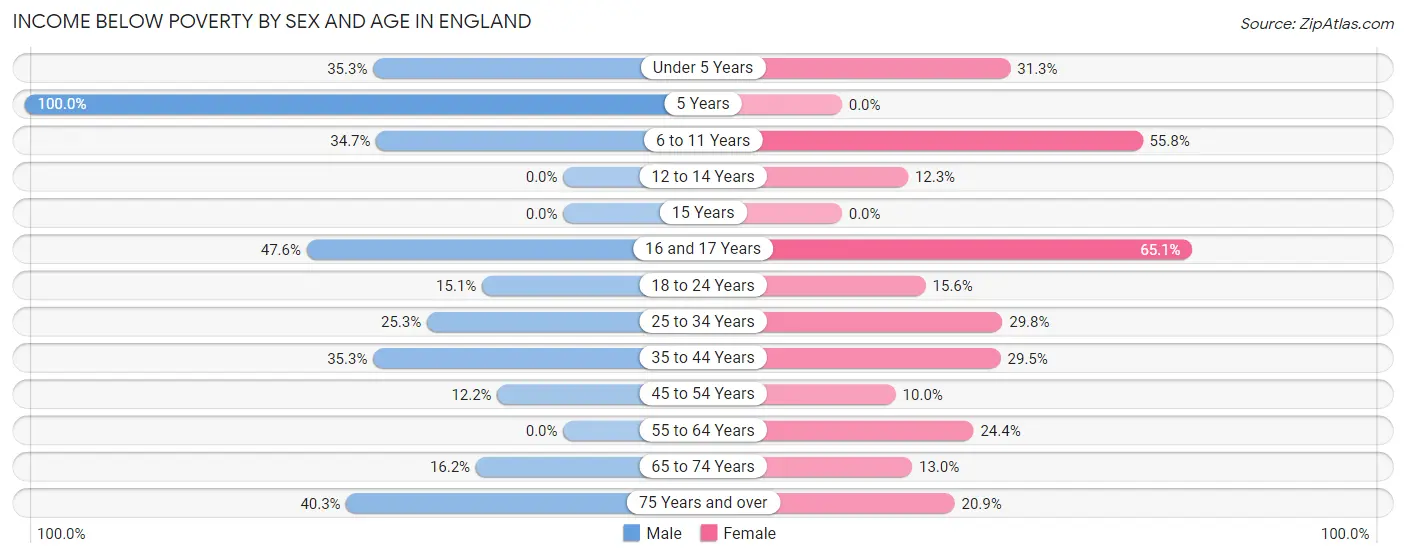
Income Below Poverty by Sex and Age in England
With 23.3% poverty level for males and 26.4% for females among the residents of England, 5 year old males and 16 and 17 year old females are the most vulnerable to poverty, with 15 males (100.0%) and 41 females (65.1%) in their respective age groups living below the poverty level.
| Age Bracket | Male | Female |
| Under 5 Years | 18 (35.3%) | 46 (31.3%) |
| 5 Years | 15 (100.0%) | 0 (0.0%) |
| 6 to 11 Years | 42 (34.7%) | 24 (55.8%) |
| 12 to 14 Years | 0 (0.0%) | 7 (12.3%) |
| 15 Years | 0 (0.0%) | 0 (0.0%) |
| 16 and 17 Years | 20 (47.6%) | 41 (65.1%) |
| 18 to 24 Years | 11 (15.1%) | 7 (15.6%) |
| 25 to 34 Years | 64 (25.3%) | 42 (29.8%) |
| 35 to 44 Years | 48 (35.3%) | 51 (29.5%) |
| 45 to 54 Years | 17 (12.2%) | 9 (10.0%) |
| 55 to 64 Years | 0 (0.0%) | 76 (24.4%) |
| 65 to 74 Years | 12 (16.2%) | 15 (13.0%) |
| 75 Years and over | 31 (40.3%) | 18 (20.9%) |
| Total | 278 (23.3%) | 336 (26.4%) |
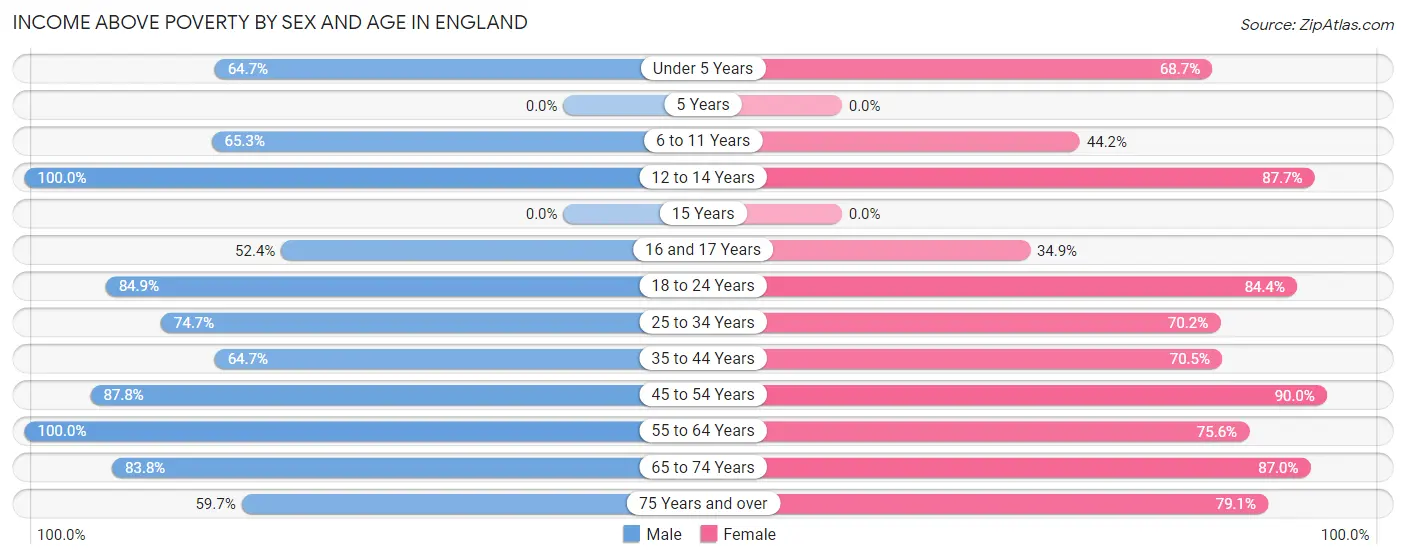
Income Above Poverty by Sex and Age in England
According to the poverty statistics in England, males aged 12 to 14 years and females aged 45 to 54 years are the age groups that are most secure financially, with 100.0% of males and 90.0% of females in these age groups living above the poverty line.
| Age Bracket | Male | Female |
| Under 5 Years | 33 (64.7%) | 101 (68.7%) |
| 5 Years | 0 (0.0%) | 0 (0.0%) |
| 6 to 11 Years | 79 (65.3%) | 19 (44.2%) |
| 12 to 14 Years | 31 (100.0%) | 50 (87.7%) |
| 15 Years | 0 (0.0%) | 0 (0.0%) |
| 16 and 17 Years | 22 (52.4%) | 22 (34.9%) |
| 18 to 24 Years | 62 (84.9%) | 38 (84.4%) |
| 25 to 34 Years | 189 (74.7%) | 99 (70.2%) |
| 35 to 44 Years | 88 (64.7%) | 122 (70.5%) |
| 45 to 54 Years | 122 (87.8%) | 81 (90.0%) |
| 55 to 64 Years | 182 (100.0%) | 235 (75.6%) |
| 65 to 74 Years | 62 (83.8%) | 100 (87.0%) |
| 75 Years and over | 46 (59.7%) | 68 (79.1%) |
| Total | 916 (76.7%) | 935 (73.6%) |
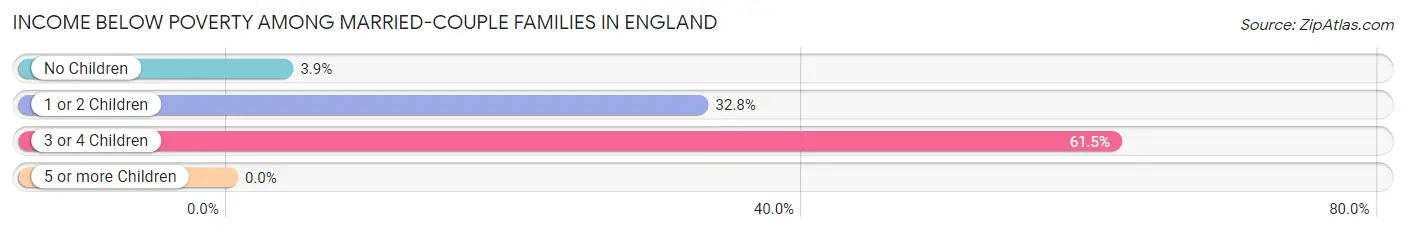
Income Below Poverty Among Married-Couple Families in England
The poverty statistics for married-couple families in England show that 19.7% or 101 of the total 514 families live below the poverty line. Families with 3 or 4 children have the highest poverty rate of 61.5%, comprising of 32 families. On the other hand, families with no children have the lowest poverty rate of 3.9%, which includes 11 families.
| Children | Above Poverty | Below Poverty |
| No Children | 274 (96.1%) | 11 (3.9%) |
| 1 or 2 Children | 119 (67.2%) | 58 (32.8%) |
| 3 or 4 Children | 20 (38.5%) | 32 (61.5%) |
| 5 or more Children | 0 (0.0%) | 0 (0.0%) |
| Total | 413 (80.3%) | 101 (19.7%) |
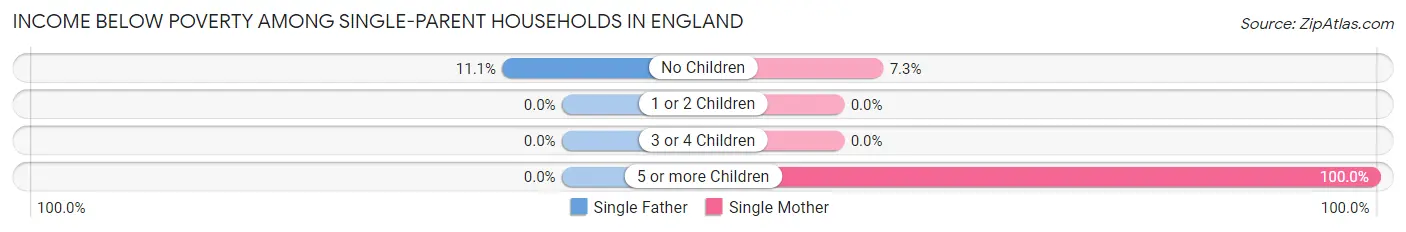
Income Below Poverty Among Single-Parent Households in England
According to the poverty data in England, 11.1% or 7 single-father households and 10.4% or 12 single-mother households are living below the poverty line. Among single-father households, those with no children have the highest poverty rate, with 7 households (11.1%) experiencing poverty. Likewise, among single-mother households, those with 5 or more children have the highest poverty rate, with 8 households (100.0%) falling below the poverty line.
| Children | Single Father | Single Mother |
| No Children | 7 (11.1%) | 4 (7.3%) |
| 1 or 2 Children | 0 (0.0%) | 0 (0.0%) |
| 3 or 4 Children | 0 (0.0%) | 0 (0.0%) |
| 5 or more Children | 0 (0.0%) | 8 (100.0%) |
| Total | 7 (11.1%) | 12 (10.4%) |
Income Below Poverty Among Married-Couple vs Single-Parent Households in England
The poverty data for England shows that 101 of the married-couple family households (19.7%) and 19 of the single-parent households (10.7%) are living below the poverty level. Within the married-couple family households, those with 3 or 4 children have the highest poverty rate, with 32 households (61.5%) falling below the poverty line. Among the single-parent households, those with 5 or more children have the highest poverty rate, with 8 household (100.0%) living below poverty.
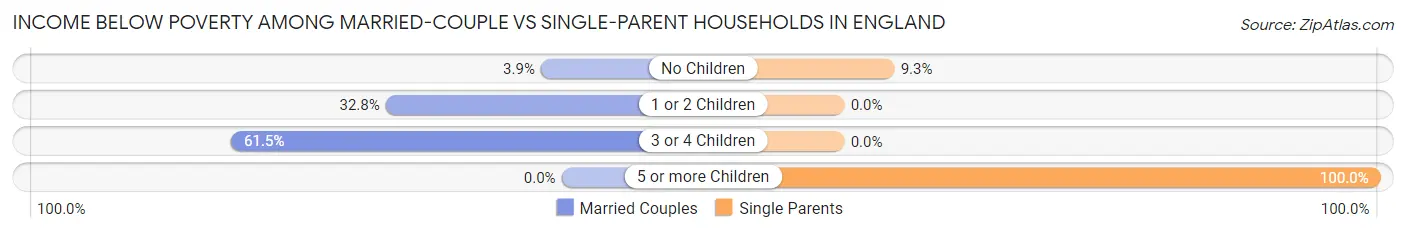
| Children | Married-Couple Families | Single-Parent Households |
| No Children | 11 (3.9%) | 11 (9.3%) |
| 1 or 2 Children | 58 (32.8%) | 0 (0.0%) |
| 3 or 4 Children | 32 (61.5%) | 0 (0.0%) |
| 5 or more Children | 0 (0.0%) | 8 (100.0%) |
| Total | 101 (19.7%) | 19 (10.7%) |
Employment Characteristics in England
Employment by Class of Employer in England
Among the 1,081 employed individuals in England, private company employees (668 | 61.8%), state government employees (112 | 10.4%), and not-for-profit organizations (90 | 8.3%) make up the most common classes of employment.
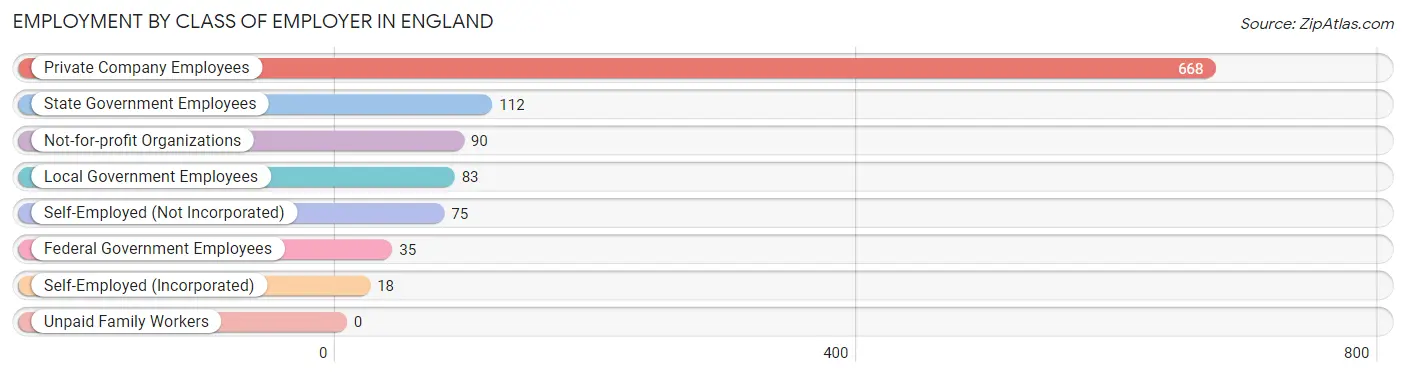
| Employer Class | # Employees | % Employees |
| Private Company Employees | 668 | 61.8% |
| Self-Employed (Incorporated) | 18 | 1.7% |
| Self-Employed (Not Incorporated) | 75 | 6.9% |
| Not-for-profit Organizations | 90 | 8.3% |
| Local Government Employees | 83 | 7.7% |
| State Government Employees | 112 | 10.4% |
| Federal Government Employees | 35 | 3.2% |
| Unpaid Family Workers | 0 | 0.0% |
| Total | 1,081 | 100.0% |
Employment Status by Age in England
According to the labor force statistics for England, out of the total population over 16 years of age (2,059), 57.2% or 1,178 individuals are in the labor force, with 5.5% or 65 of them unemployed. The age group with the highest labor force participation rate is 30 to 34 years, with 87.2% or 143 individuals in the labor force. Within the labor force, the 35 to 44 years age range has the highest percentage of unemployed individuals, with 19.4% or 49 of them being unemployed.
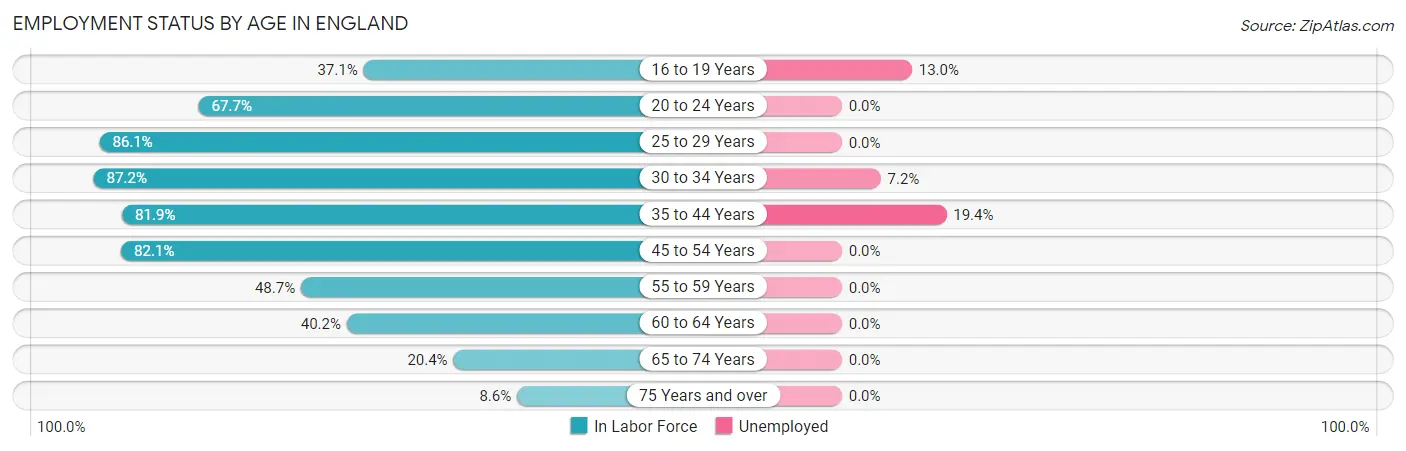
| Age Bracket | In Labor Force | Unemployed |
| 16 to 19 Years | 46 (37.1%) | 6 (13.0%) |
| 20 to 24 Years | 67 (67.7%) | 0 (0.0%) |
| 25 to 29 Years | 198 (86.1%) | 0 (0.0%) |
| 30 to 34 Years | 143 (87.2%) | 10 (7.2%) |
| 35 to 44 Years | 253 (81.9%) | 49 (19.4%) |
| 45 to 54 Years | 188 (82.1%) | 0 (0.0%) |
| 55 to 59 Years | 130 (48.7%) | 0 (0.0%) |
| 60 to 64 Years | 94 (40.2%) | 0 (0.0%) |
| 65 to 74 Years | 42 (20.4%) | 0 (0.0%) |
| 75 Years and over | 17 (8.6%) | 0 (0.0%) |
| Total | 1,178 (57.2%) | 65 (5.5%) |
Employment Status by Educational Attainment in England
According to labor force statistics for England, 70.2% of individuals (1,006) out of the total population between 25 and 64 years of age (1,433) are in the labor force, with 5.9% or 59 of them being unemployed. The group with the highest labor force participation rate are those with the educational attainment of bachelor's degree or higher, with 90.3% or 242 individuals in the labor force. Within the labor force, individuals with bachelor's degree or higher education have the highest percentage of unemployment, with 12.2% or 30 of them being unemployed.
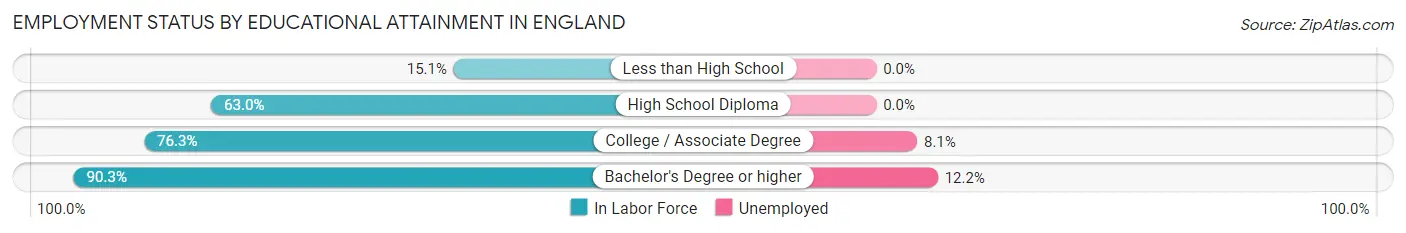
| Educational Attainment | In Labor Force | Unemployed |
| Less than High School | 11 (15.1%) | 0 (0.0%) |
| High School Diploma | 382 (63.0%) | 0 (0.0%) |
| College / Associate Degree | 371 (76.3%) | 39 (8.1%) |
| Bachelor's Degree or higher | 242 (90.3%) | 33 (12.2%) |
| Total | 1,006 (70.2%) | 85 (5.9%) |
Employment Occupations by Sex in England
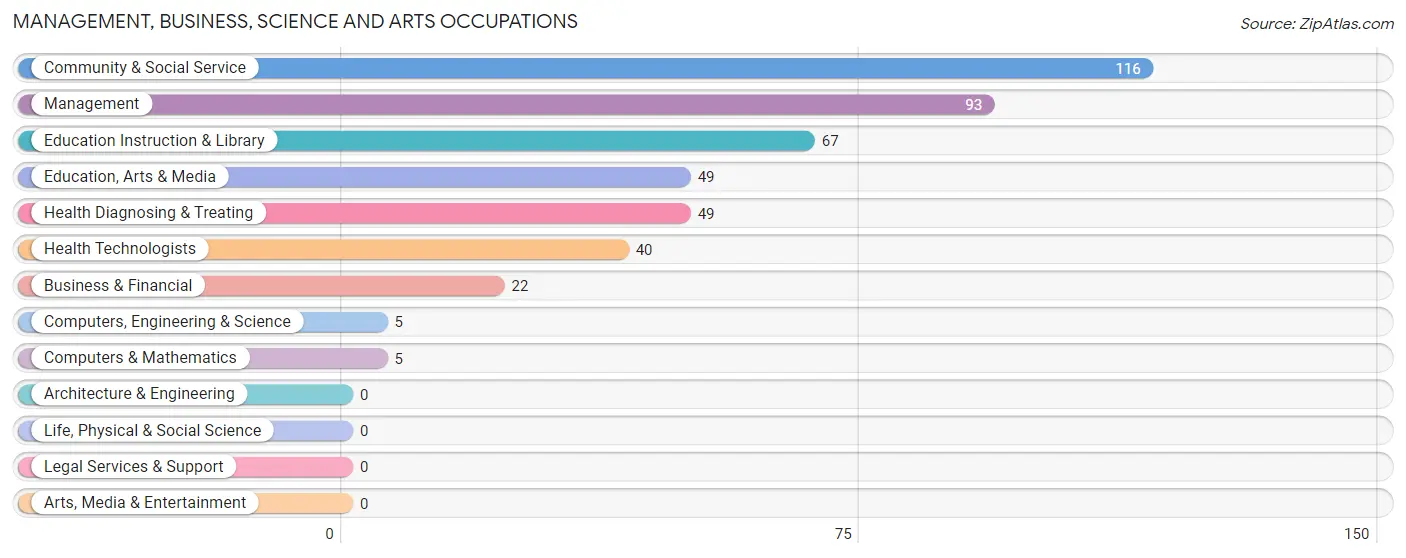
Management, Business, Science and Arts Occupations
The most common Management, Business, Science and Arts occupations in England are Community & Social Service (116 | 10.5%), Management (93 | 8.4%), Education Instruction & Library (67 | 6.0%), Education, Arts & Media (49 | 4.4%), and Health Diagnosing & Treating (49 | 4.4%).
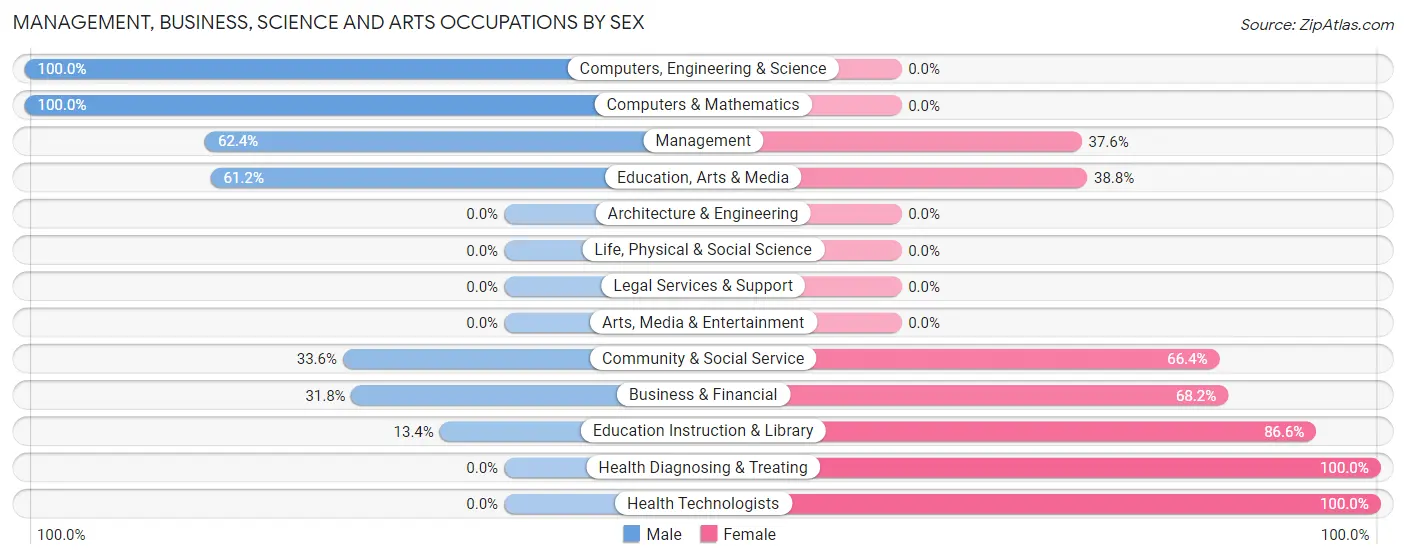
Management, Business, Science and Arts Occupations by Sex
Within the Management, Business, Science and Arts occupations in England, the most male-oriented occupations are Computers, Engineering & Science (100.0%), Computers & Mathematics (100.0%), and Management (62.4%), while the most female-oriented occupations are Health Diagnosing & Treating (100.0%), Health Technologists (100.0%), and Education Instruction & Library (86.6%).
| Occupation | Male | Female |
| Management | 58 (62.4%) | 35 (37.6%) |
| Business & Financial | 7 (31.8%) | 15 (68.2%) |
| Computers, Engineering & Science | 5 (100.0%) | 0 (0.0%) |
| Computers & Mathematics | 5 (100.0%) | 0 (0.0%) |
| Architecture & Engineering | 0 (0.0%) | 0 (0.0%) |
| Life, Physical & Social Science | 0 (0.0%) | 0 (0.0%) |
| Community & Social Service | 39 (33.6%) | 77 (66.4%) |
| Education, Arts & Media | 30 (61.2%) | 19 (38.8%) |
| Legal Services & Support | 0 (0.0%) | 0 (0.0%) |
| Education Instruction & Library | 9 (13.4%) | 58 (86.6%) |
| Arts, Media & Entertainment | 0 (0.0%) | 0 (0.0%) |
| Health Diagnosing & Treating | 0 (0.0%) | 49 (100.0%) |
| Health Technologists | 0 (0.0%) | 40 (100.0%) |
| Total (Category) | 109 (38.3%) | 176 (61.8%) |
| Total (Overall) | 582 (52.5%) | 526 (47.5%) |
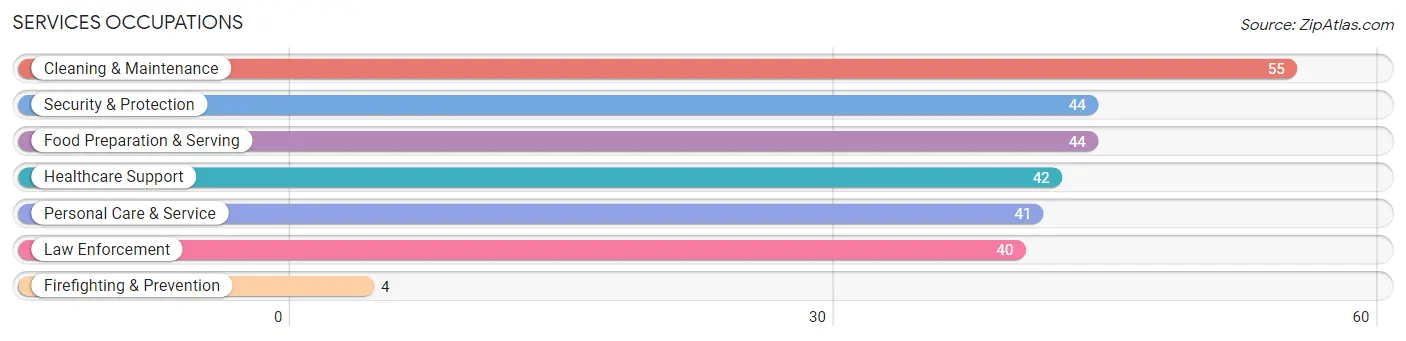
Services Occupations
The most common Services occupations in England are Cleaning & Maintenance (55 | 5.0%), Security & Protection (44 | 4.0%), Food Preparation & Serving (44 | 4.0%), Healthcare Support (42 | 3.8%), and Personal Care & Service (41 | 3.7%).
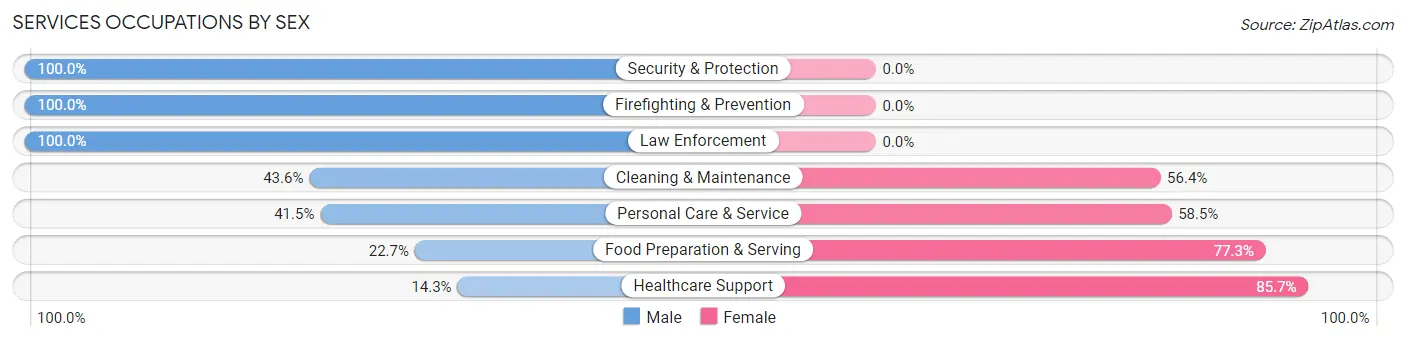
Services Occupations by Sex
Within the Services occupations in England, the most male-oriented occupations are Security & Protection (100.0%), Firefighting & Prevention (100.0%), and Law Enforcement (100.0%), while the most female-oriented occupations are Healthcare Support (85.7%), Food Preparation & Serving (77.3%), and Personal Care & Service (58.5%).
| Occupation | Male | Female |
| Healthcare Support | 6 (14.3%) | 36 (85.7%) |
| Security & Protection | 44 (100.0%) | 0 (0.0%) |
| Firefighting & Prevention | 4 (100.0%) | 0 (0.0%) |
| Law Enforcement | 40 (100.0%) | 0 (0.0%) |
| Food Preparation & Serving | 10 (22.7%) | 34 (77.3%) |
| Cleaning & Maintenance | 24 (43.6%) | 31 (56.4%) |
| Personal Care & Service | 17 (41.5%) | 24 (58.5%) |
| Total (Category) | 101 (44.7%) | 125 (55.3%) |
| Total (Overall) | 582 (52.5%) | 526 (47.5%) |
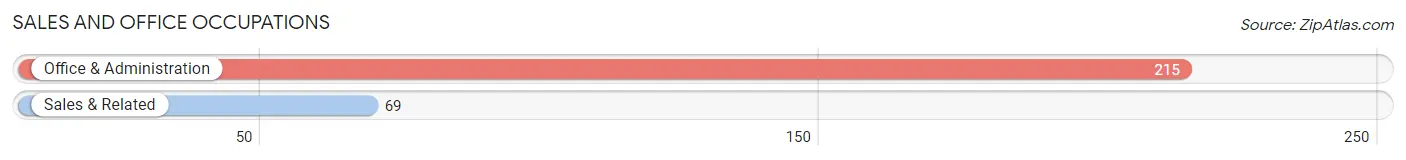
Sales and Office Occupations
The most common Sales and Office occupations in England are Office & Administration (215 | 19.4%), and Sales & Related (69 | 6.2%).
Sales and Office Occupations by Sex
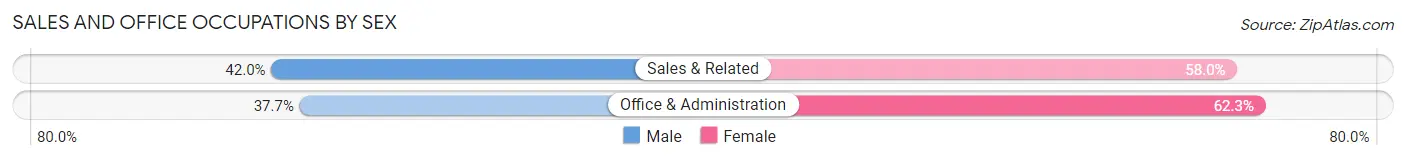
| Occupation | Male | Female |
| Sales & Related | 29 (42.0%) | 40 (58.0%) |
| Office & Administration | 81 (37.7%) | 134 (62.3%) |
| Total (Category) | 110 (38.7%) | 174 (61.3%) |
| Total (Overall) | 582 (52.5%) | 526 (47.5%) |
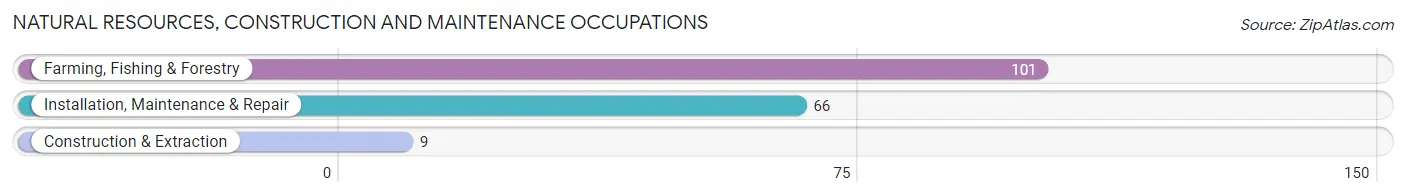
Natural Resources, Construction and Maintenance Occupations
The most common Natural Resources, Construction and Maintenance occupations in England are Farming, Fishing & Forestry (101 | 9.1%), Installation, Maintenance & Repair (66 | 6.0%), and Construction & Extraction (9 | 0.8%).
Natural Resources, Construction and Maintenance Occupations by Sex
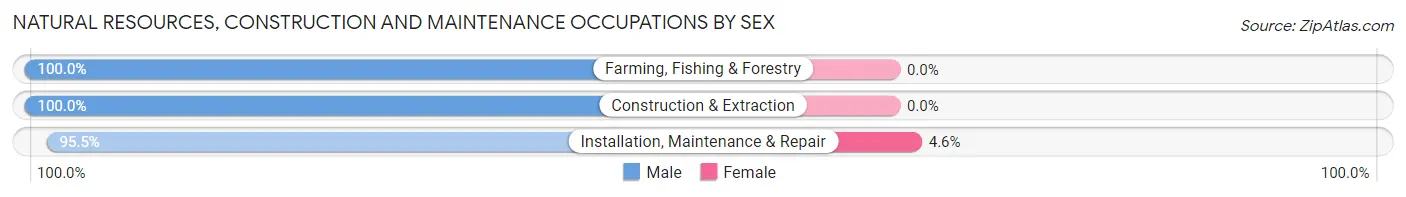
| Occupation | Male | Female |
| Farming, Fishing & Forestry | 101 (100.0%) | 0 (0.0%) |
| Construction & Extraction | 9 (100.0%) | 0 (0.0%) |
| Installation, Maintenance & Repair | 63 (95.5%) | 3 (4.5%) |
| Total (Category) | 173 (98.3%) | 3 (1.7%) |
| Total (Overall) | 582 (52.5%) | 526 (47.5%) |
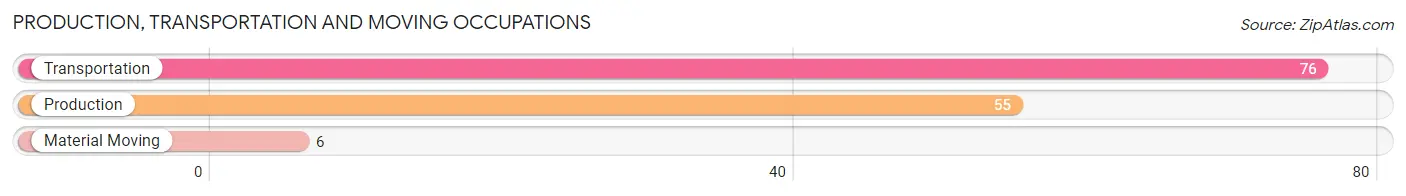
Production, Transportation and Moving Occupations
The most common Production, Transportation and Moving occupations in England are Transportation (76 | 6.9%), Production (55 | 5.0%), and Material Moving (6 | 0.5%).
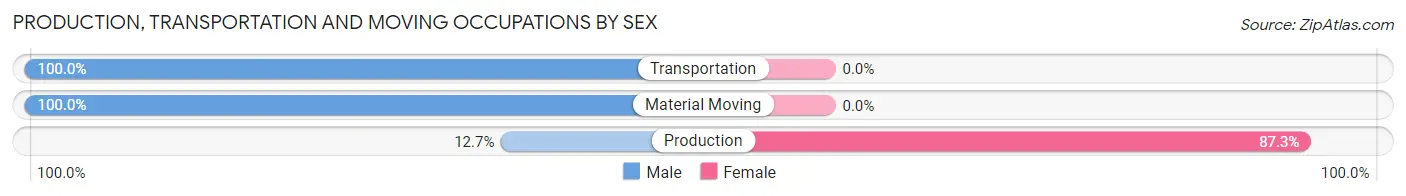
Production, Transportation and Moving Occupations by Sex
| Occupation | Male | Female |
| Production | 7 (12.7%) | 48 (87.3%) |
| Transportation | 76 (100.0%) | 0 (0.0%) |
| Material Moving | 6 (100.0%) | 0 (0.0%) |
| Total (Category) | 89 (65.0%) | 48 (35.0%) |
| Total (Overall) | 582 (52.5%) | 526 (47.5%) |
Employment Industries by Sex in England
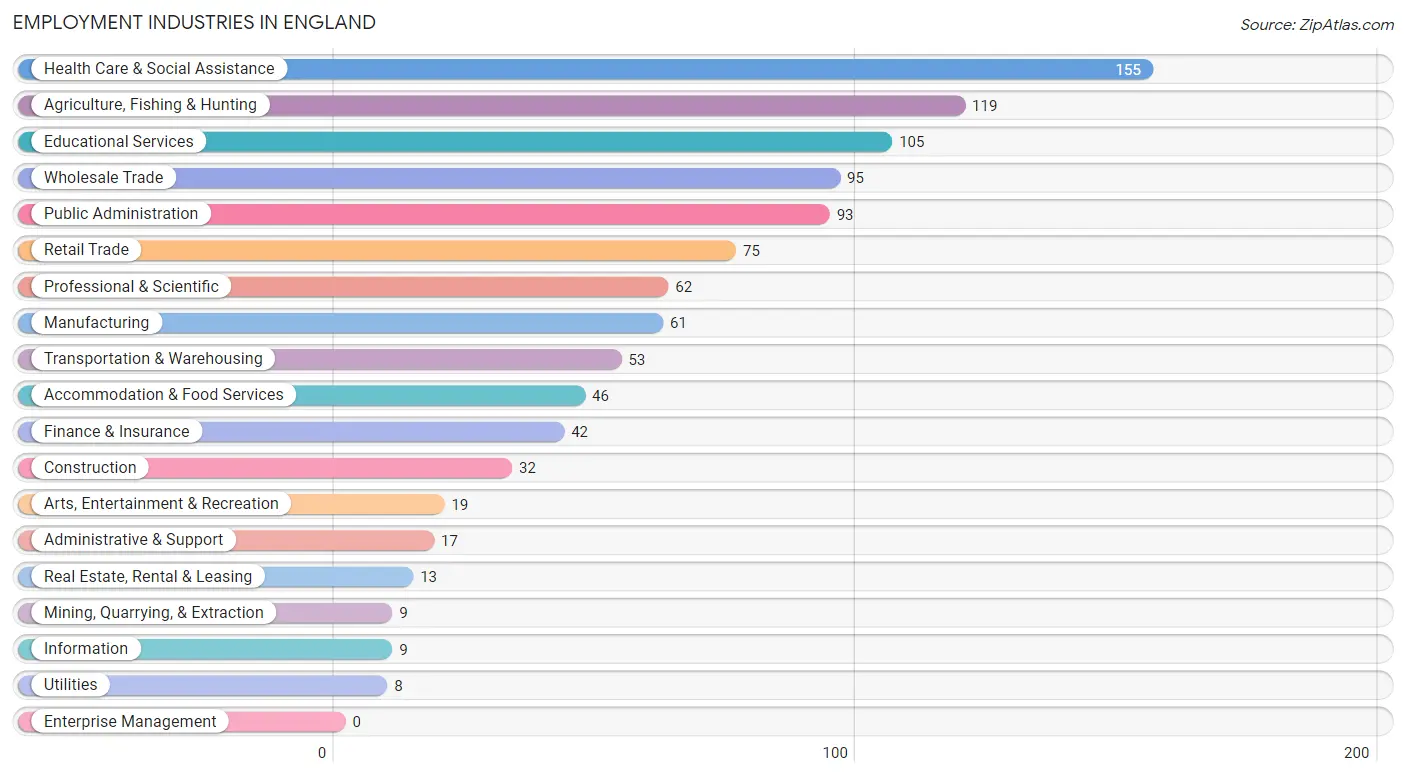
Employment Industries in England
The major employment industries in England include Health Care & Social Assistance (155 | 14.0%), Agriculture, Fishing & Hunting (119 | 10.7%), Educational Services (105 | 9.5%), Wholesale Trade (95 | 8.6%), and Public Administration (93 | 8.4%).
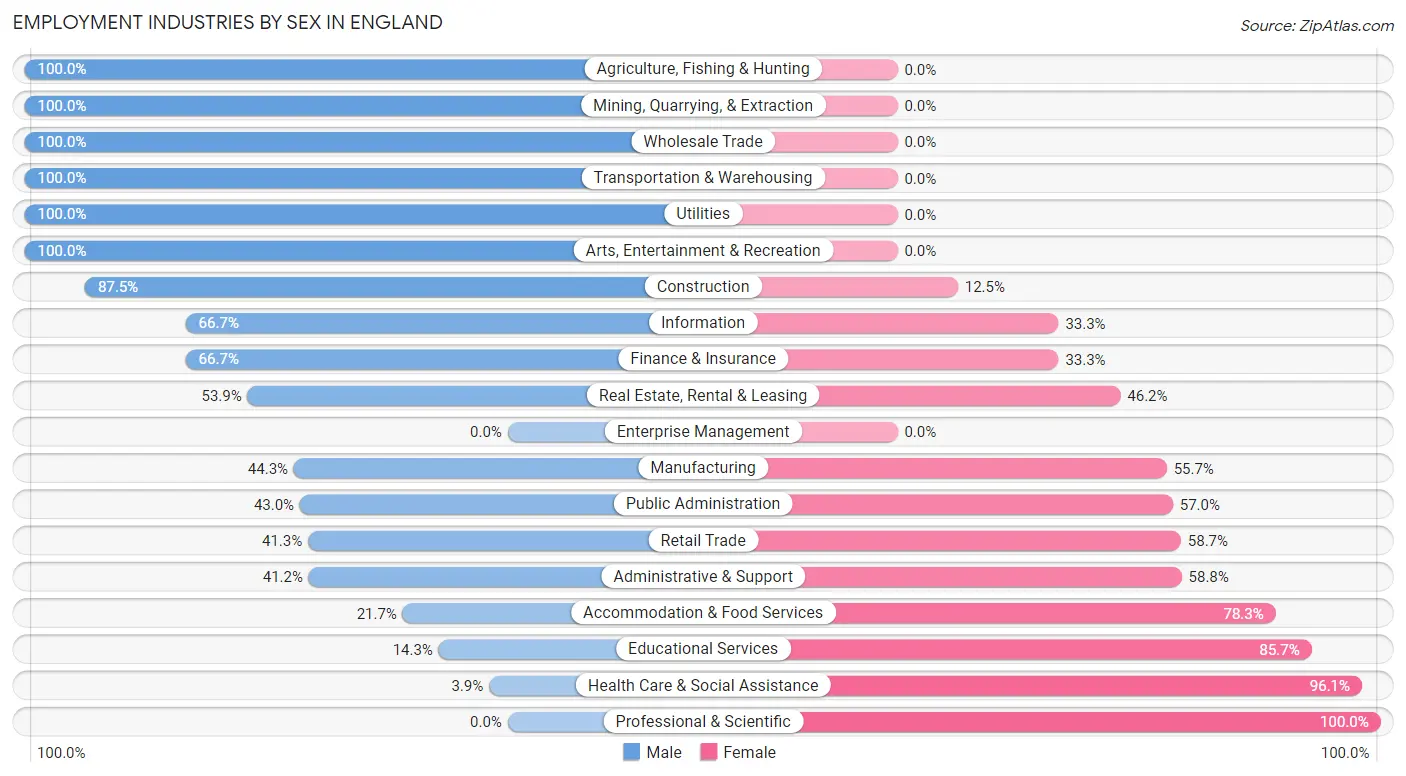
Employment Industries by Sex in England
The England industries that see more men than women are Agriculture, Fishing & Hunting (100.0%), Mining, Quarrying, & Extraction (100.0%), and Wholesale Trade (100.0%), whereas the industries that tend to have a higher number of women are Professional & Scientific (100.0%), Health Care & Social Assistance (96.1%), and Educational Services (85.7%).
| Industry | Male | Female |
| Agriculture, Fishing & Hunting | 119 (100.0%) | 0 (0.0%) |
| Mining, Quarrying, & Extraction | 9 (100.0%) | 0 (0.0%) |
| Construction | 28 (87.5%) | 4 (12.5%) |
| Manufacturing | 27 (44.3%) | 34 (55.7%) |
| Wholesale Trade | 95 (100.0%) | 0 (0.0%) |
| Retail Trade | 31 (41.3%) | 44 (58.7%) |
| Transportation & Warehousing | 53 (100.0%) | 0 (0.0%) |
| Utilities | 8 (100.0%) | 0 (0.0%) |
| Information | 6 (66.7%) | 3 (33.3%) |
| Finance & Insurance | 28 (66.7%) | 14 (33.3%) |
| Real Estate, Rental & Leasing | 7 (53.8%) | 6 (46.2%) |
| Professional & Scientific | 0 (0.0%) | 62 (100.0%) |
| Enterprise Management | 0 (0.0%) | 0 (0.0%) |
| Administrative & Support | 7 (41.2%) | 10 (58.8%) |
| Educational Services | 15 (14.3%) | 90 (85.7%) |
| Health Care & Social Assistance | 6 (3.9%) | 149 (96.1%) |
| Arts, Entertainment & Recreation | 19 (100.0%) | 0 (0.0%) |
| Accommodation & Food Services | 10 (21.7%) | 36 (78.3%) |
| Public Administration | 40 (43.0%) | 53 (57.0%) |
| Total | 582 (52.5%) | 526 (47.5%) |
Education in England
School Enrollment in England
The most common levels of schooling among the 548 students in England are middle school (130 | 23.7%), high school (113 | 20.6%), and elementary school (107 | 19.5%).
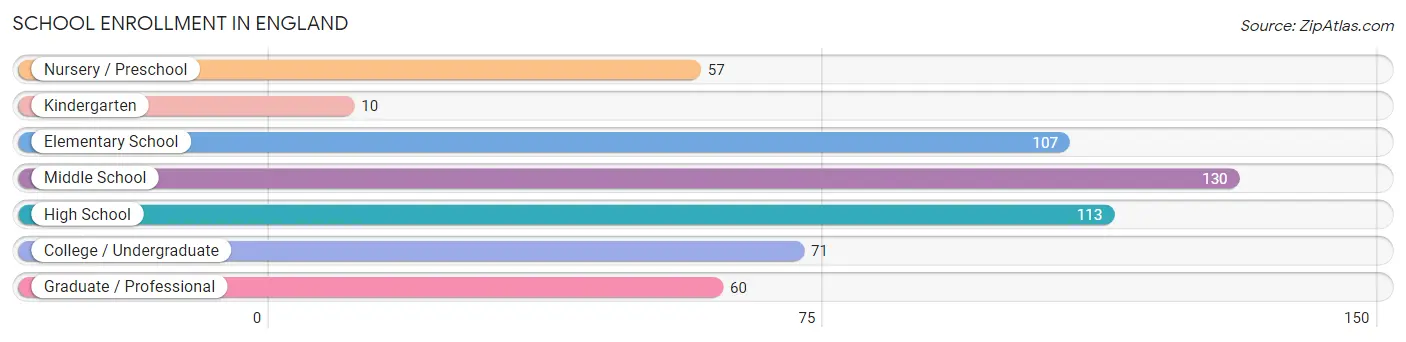
| School Level | # Students | % Students |
| Nursery / Preschool | 57 | 10.4% |
| Kindergarten | 10 | 1.8% |
| Elementary School | 107 | 19.5% |
| Middle School | 130 | 23.7% |
| High School | 113 | 20.6% |
| College / Undergraduate | 71 | 13.0% |
| Graduate / Professional | 60 | 11.0% |
| Total | 548 | 100.0% |
School Enrollment by Age by Funding Source in England
Out of a total of 548 students who are enrolled in schools in England, 122 (22.3%) attend a private institution, while the remaining 426 (77.7%) are enrolled in public schools. The age group of 3 to 4 year olds has the highest likelihood of being enrolled in private schools, with 48 (84.2% in the age bracket) enrolled. Conversely, the age group of 10 to 14 year olds has the lowest likelihood of being enrolled in a private school, with 195 (100.0% in the age bracket) attending a public institution.
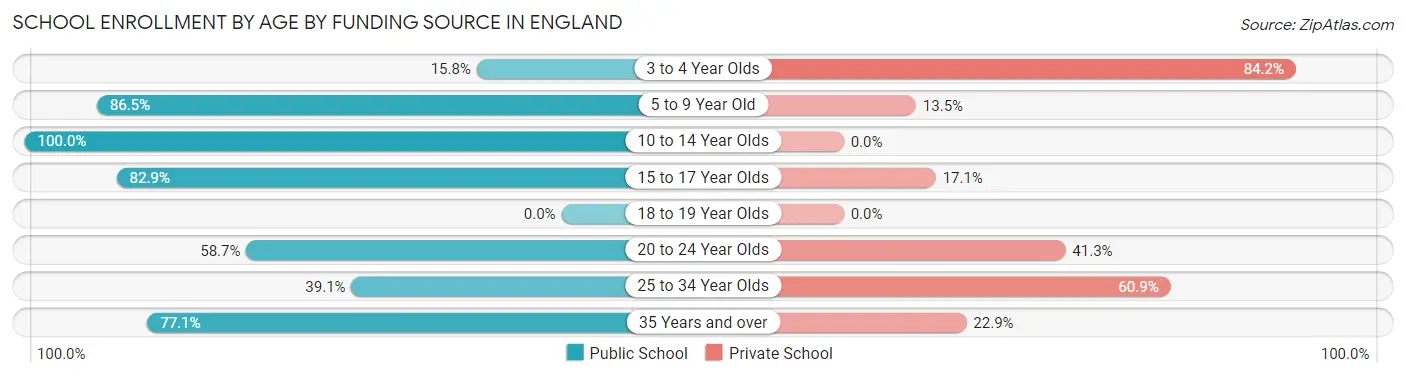
| Age Bracket | Public School | Private School |
| 3 to 4 Year Olds | 9 (15.8%) | 48 (84.2%) |
| 5 to 9 Year Old | 45 (86.5%) | 7 (13.5%) |
| 10 to 14 Year Olds | 195 (100.0%) | 0 (0.0%) |
| 15 to 17 Year Olds | 87 (82.9%) | 18 (17.1%) |
| 18 to 19 Year Olds | 0 (0.0%) | 0 (0.0%) |
| 20 to 24 Year Olds | 27 (58.7%) | 19 (41.3%) |
| 25 to 34 Year Olds | 9 (39.1%) | 14 (60.9%) |
| 35 Years and over | 54 (77.1%) | 16 (22.9%) |
| Total | 426 (77.7%) | 122 (22.3%) |
Educational Attainment by Field of Study in England
Education (101 | 25.4%), science & technology (71 | 17.8%), business (56 | 14.1%), social sciences (49 | 12.3%), and arts & humanities (34 | 8.5%) are the most common fields of study among 398 individuals in England who have obtained a bachelor's degree or higher.
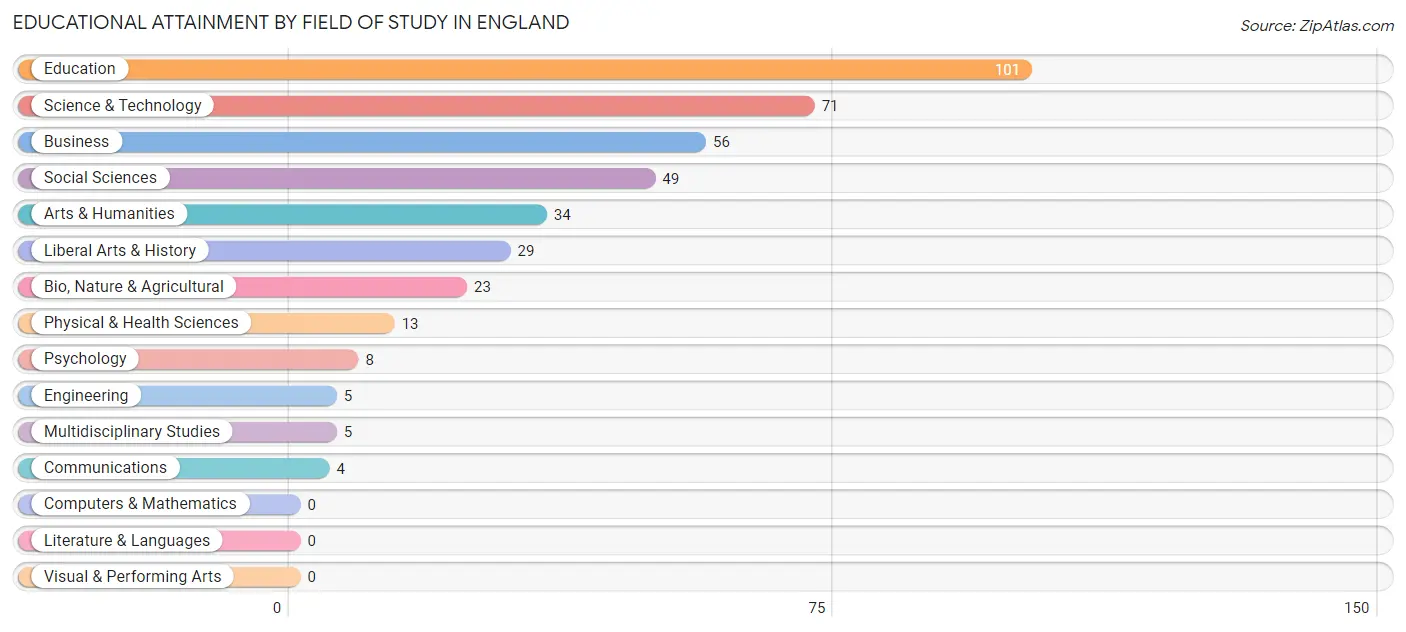
| Field of Study | # Graduates | % Graduates |
| Computers & Mathematics | 0 | 0.0% |
| Bio, Nature & Agricultural | 23 | 5.8% |
| Physical & Health Sciences | 13 | 3.3% |
| Psychology | 8 | 2.0% |
| Social Sciences | 49 | 12.3% |
| Engineering | 5 | 1.3% |
| Multidisciplinary Studies | 5 | 1.3% |
| Science & Technology | 71 | 17.8% |
| Business | 56 | 14.1% |
| Education | 101 | 25.4% |
| Literature & Languages | 0 | 0.0% |
| Liberal Arts & History | 29 | 7.3% |
| Visual & Performing Arts | 0 | 0.0% |
| Communications | 4 | 1.0% |
| Arts & Humanities | 34 | 8.5% |
| Total | 398 | 100.0% |
Transportation & Commute in England
Vehicle Availability by Sex in England
The most prevalent vehicle ownership categories in England are males with 2 vehicles (238, accounting for 40.6%) and females with 2 vehicles (271, making up 48.2%).
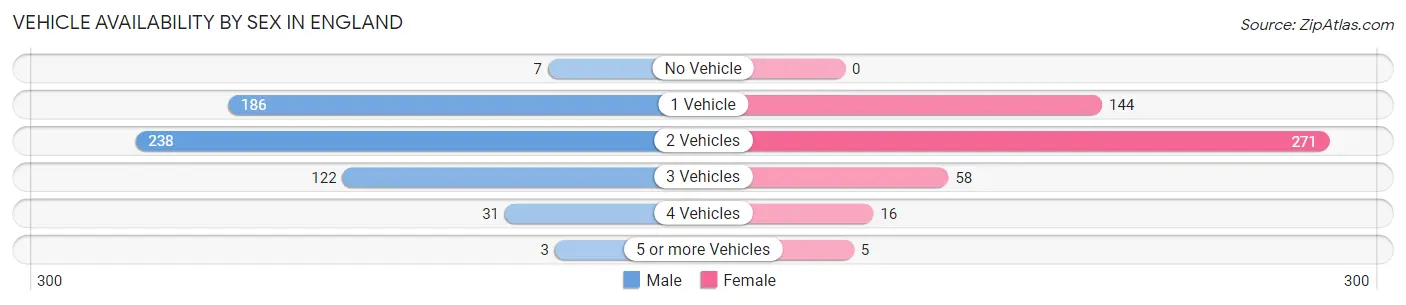
| Vehicles Available | Male | Female |
| No Vehicle | 7 (1.2%) | 0 (0.0%) |
| 1 Vehicle | 186 (31.7%) | 144 (29.1%) |
| 2 Vehicles | 238 (40.6%) | 271 (54.9%) |
| 3 Vehicles | 122 (20.8%) | 58 (11.7%) |
| 4 Vehicles | 31 (5.3%) | 16 (3.2%) |
| 5 or more Vehicles | 3 (0.5%) | 5 (1.0%) |
| Total | 587 (100.0%) | 494 (100.0%) |
Commute Time in England
The most frequently occuring commute durations in England are 45 to 59 minutes (264 commuters, 24.6%), 10 to 14 minutes (139 commuters, 13.0%), and 35 to 39 minutes (124 commuters, 11.6%).
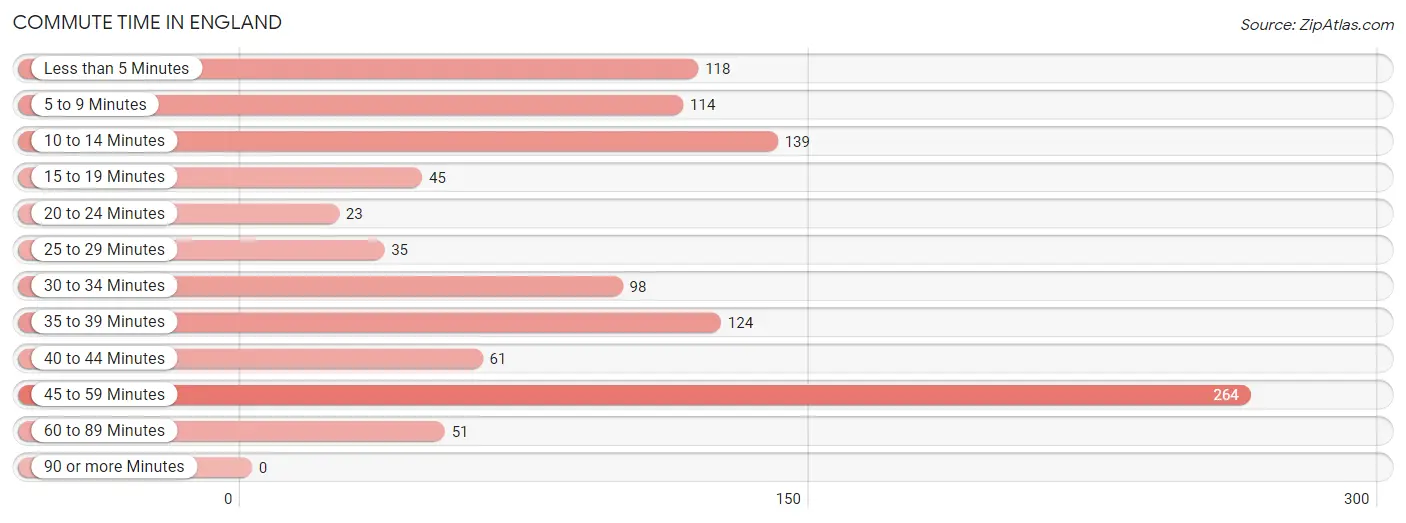
| Commute Time | # Commuters | % Commuters |
| Less than 5 Minutes | 118 | 11.0% |
| 5 to 9 Minutes | 114 | 10.6% |
| 10 to 14 Minutes | 139 | 13.0% |
| 15 to 19 Minutes | 45 | 4.2% |
| 20 to 24 Minutes | 23 | 2.1% |
| 25 to 29 Minutes | 35 | 3.3% |
| 30 to 34 Minutes | 98 | 9.1% |
| 35 to 39 Minutes | 124 | 11.6% |
| 40 to 44 Minutes | 61 | 5.7% |
| 45 to 59 Minutes | 264 | 24.6% |
| 60 to 89 Minutes | 51 | 4.8% |
| 90 or more Minutes | 0 | 0.0% |
Commute Time by Sex in England
The most common commute times in England are 45 to 59 minutes (208 commuters, 35.4%) for males and 5 to 9 minutes (74 commuters, 15.3%) for females.
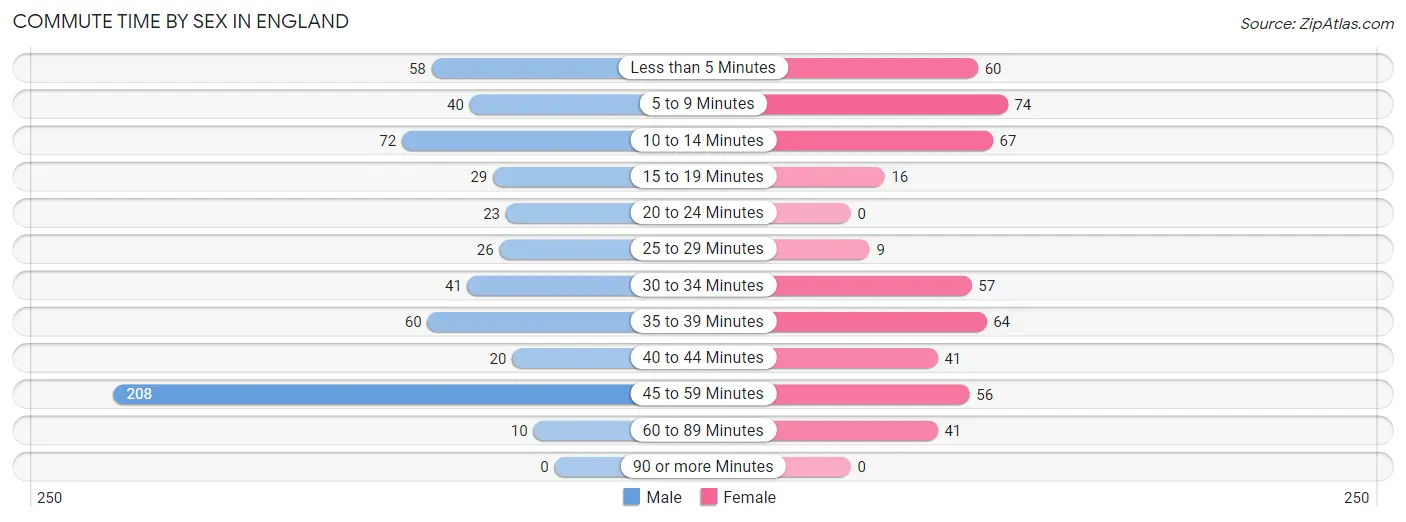
| Commute Time | Male | Female |
| Less than 5 Minutes | 58 (9.9%) | 60 (12.4%) |
| 5 to 9 Minutes | 40 (6.8%) | 74 (15.3%) |
| 10 to 14 Minutes | 72 (12.3%) | 67 (13.8%) |
| 15 to 19 Minutes | 29 (4.9%) | 16 (3.3%) |
| 20 to 24 Minutes | 23 (3.9%) | 0 (0.0%) |
| 25 to 29 Minutes | 26 (4.4%) | 9 (1.9%) |
| 30 to 34 Minutes | 41 (7.0%) | 57 (11.7%) |
| 35 to 39 Minutes | 60 (10.2%) | 64 (13.2%) |
| 40 to 44 Minutes | 20 (3.4%) | 41 (8.5%) |
| 45 to 59 Minutes | 208 (35.4%) | 56 (11.6%) |
| 60 to 89 Minutes | 10 (1.7%) | 41 (8.5%) |
| 90 or more Minutes | 0 (0.0%) | 0 (0.0%) |
Time of Departure to Work by Sex in England
The most frequent times of departure to work in England are 7:00 AM to 7:29 AM (138, 23.5%) for males and 7:00 AM to 7:29 AM (98, 20.2%) for females.
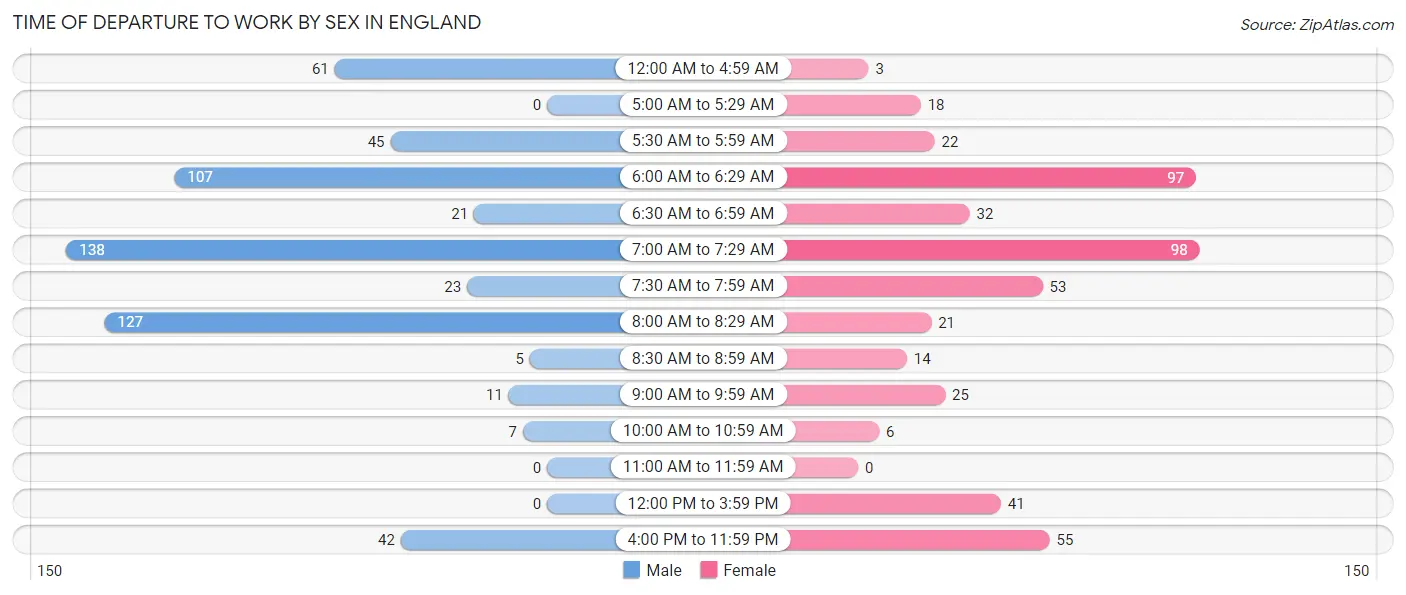
| Time of Departure | Male | Female |
| 12:00 AM to 4:59 AM | 61 (10.4%) | 3 (0.6%) |
| 5:00 AM to 5:29 AM | 0 (0.0%) | 18 (3.7%) |
| 5:30 AM to 5:59 AM | 45 (7.7%) | 22 (4.5%) |
| 6:00 AM to 6:29 AM | 107 (18.2%) | 97 (20.0%) |
| 6:30 AM to 6:59 AM | 21 (3.6%) | 32 (6.6%) |
| 7:00 AM to 7:29 AM | 138 (23.5%) | 98 (20.2%) |
| 7:30 AM to 7:59 AM | 23 (3.9%) | 53 (10.9%) |
| 8:00 AM to 8:29 AM | 127 (21.6%) | 21 (4.3%) |
| 8:30 AM to 8:59 AM | 5 (0.9%) | 14 (2.9%) |
| 9:00 AM to 9:59 AM | 11 (1.9%) | 25 (5.1%) |
| 10:00 AM to 10:59 AM | 7 (1.2%) | 6 (1.2%) |
| 11:00 AM to 11:59 AM | 0 (0.0%) | 0 (0.0%) |
| 12:00 PM to 3:59 PM | 0 (0.0%) | 41 (8.5%) |
| 4:00 PM to 11:59 PM | 42 (7.2%) | 55 (11.3%) |
| Total | 587 (100.0%) | 485 (100.0%) |
Housing Occupancy in England
Occupancy by Ownership in England
Of the total 1,051 dwellings in England, owner-occupied units account for 631 (60.0%), while renter-occupied units make up 420 (40.0%).
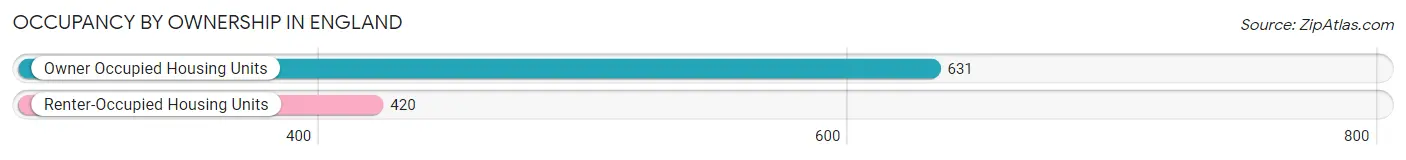
| Occupancy | # Housing Units | % Housing Units |
| Owner Occupied Housing Units | 631 | 60.0% |
| Renter-Occupied Housing Units | 420 | 40.0% |
| Total Occupied Housing Units | 1,051 | 100.0% |
Occupancy by Household Size in England
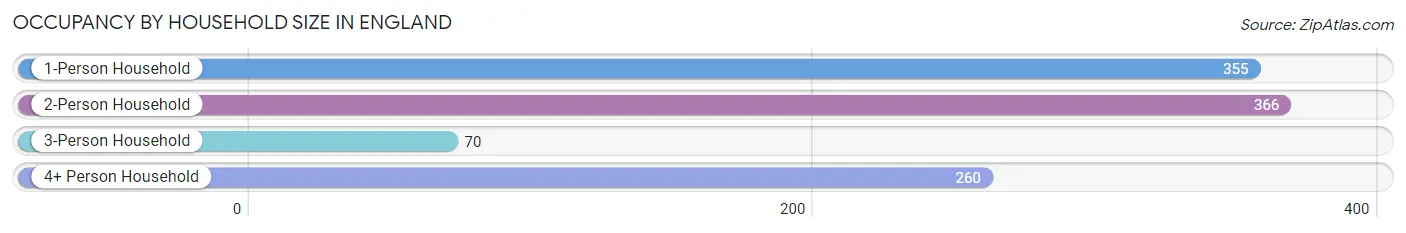
| Household Size | # Housing Units | % Housing Units |
| 1-Person Household | 355 | 33.8% |
| 2-Person Household | 366 | 34.8% |
| 3-Person Household | 70 | 6.7% |
| 4+ Person Household | 260 | 24.7% |
| Total Housing Units | 1,051 | 100.0% |
Occupancy by Ownership by Household Size in England
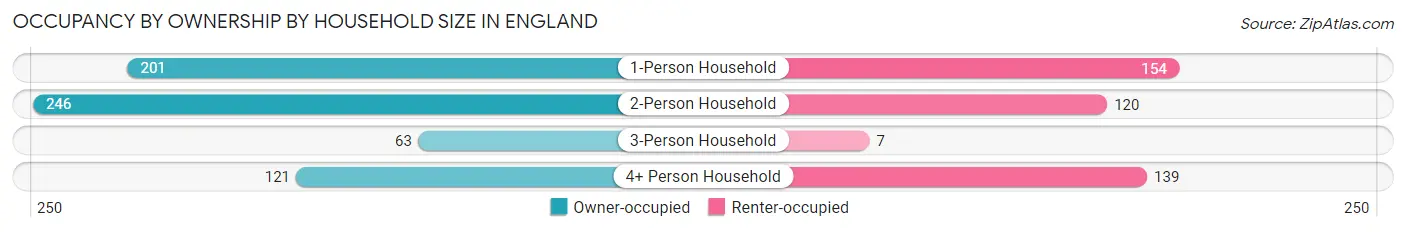
| Household Size | Owner-occupied | Renter-occupied |
| 1-Person Household | 201 (56.6%) | 154 (43.4%) |
| 2-Person Household | 246 (67.2%) | 120 (32.8%) |
| 3-Person Household | 63 (90.0%) | 7 (10.0%) |
| 4+ Person Household | 121 (46.5%) | 139 (53.5%) |
| Total Housing Units | 631 (60.0%) | 420 (40.0%) |
Occupancy by Educational Attainment in England
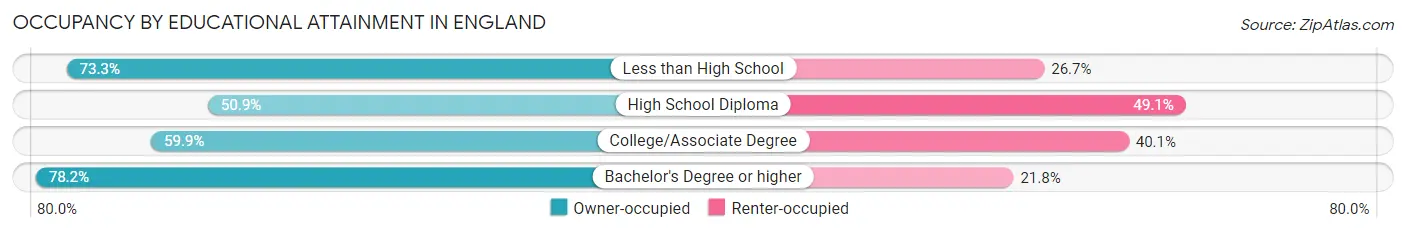
| Household Size | Owner-occupied | Renter-occupied |
| Less than High School | 44 (73.3%) | 16 (26.7%) |
| High School Diploma | 248 (50.9%) | 239 (49.1%) |
| College/Associate Degree | 181 (59.9%) | 121 (40.1%) |
| Bachelor's Degree or higher | 158 (78.2%) | 44 (21.8%) |
Occupancy by Age of Householder in England
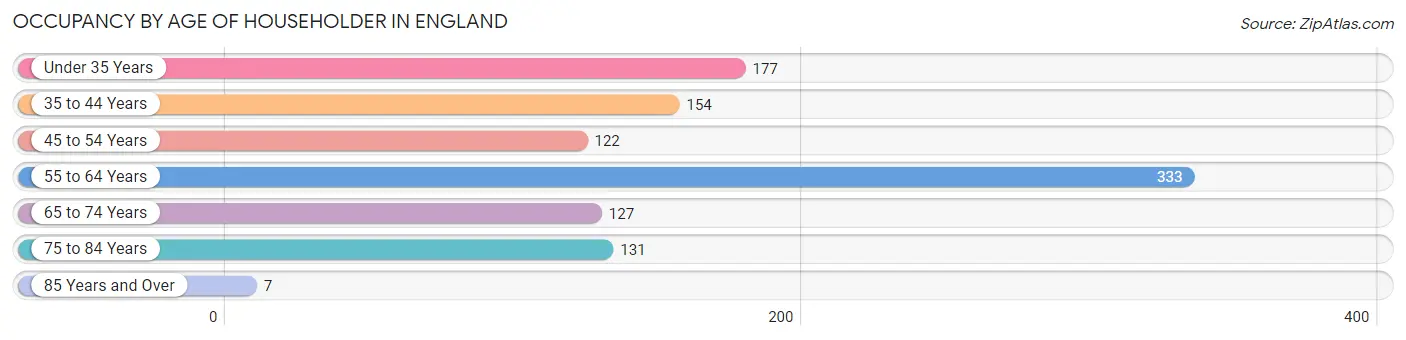
| Age Bracket | # Households | % Households |
| Under 35 Years | 177 | 16.8% |
| 35 to 44 Years | 154 | 14.6% |
| 45 to 54 Years | 122 | 11.6% |
| 55 to 64 Years | 333 | 31.7% |
| 65 to 74 Years | 127 | 12.1% |
| 75 to 84 Years | 131 | 12.5% |
| 85 Years and Over | 7 | 0.7% |
| Total | 1,051 | 100.0% |
Housing Finances in England
Median Income by Occupancy in England
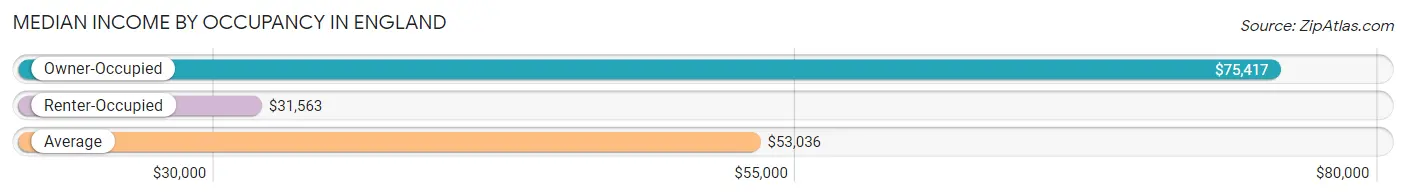
| Occupancy Type | # Households | Median Income |
| Owner-Occupied | 631 (60.0%) | $75,417 |
| Renter-Occupied | 420 (40.0%) | $31,563 |
| Average | 1,051 (100.0%) | $53,036 |
Occupancy by Householder Income Bracket in England
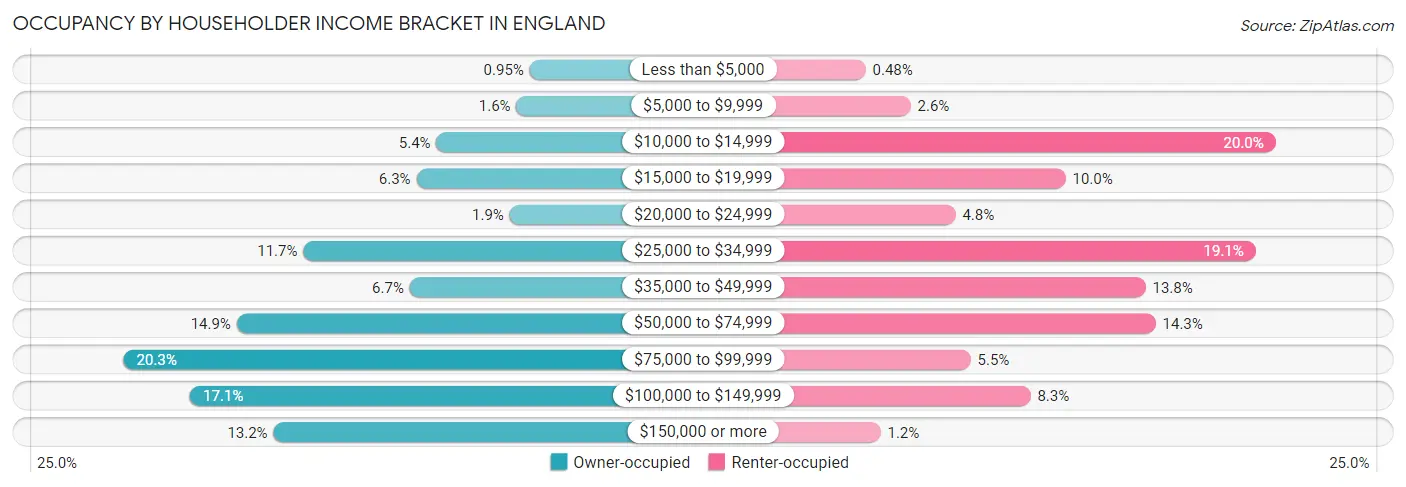
| Income Bracket | Owner-occupied | Renter-occupied |
| Less than $5,000 | 6 (0.9%) | 2 (0.5%) |
| $5,000 to $9,999 | 10 (1.6%) | 11 (2.6%) |
| $10,000 to $14,999 | 34 (5.4%) | 84 (20.0%) |
| $15,000 to $19,999 | 40 (6.3%) | 42 (10.0%) |
| $20,000 to $24,999 | 12 (1.9%) | 20 (4.8%) |
| $25,000 to $34,999 | 74 (11.7%) | 80 (19.1%) |
| $35,000 to $49,999 | 42 (6.7%) | 58 (13.8%) |
| $50,000 to $74,999 | 94 (14.9%) | 60 (14.3%) |
| $75,000 to $99,999 | 128 (20.3%) | 23 (5.5%) |
| $100,000 to $149,999 | 108 (17.1%) | 35 (8.3%) |
| $150,000 or more | 83 (13.2%) | 5 (1.2%) |
| Total | 631 (100.0%) | 420 (100.0%) |
Monthly Housing Cost Tiers in England
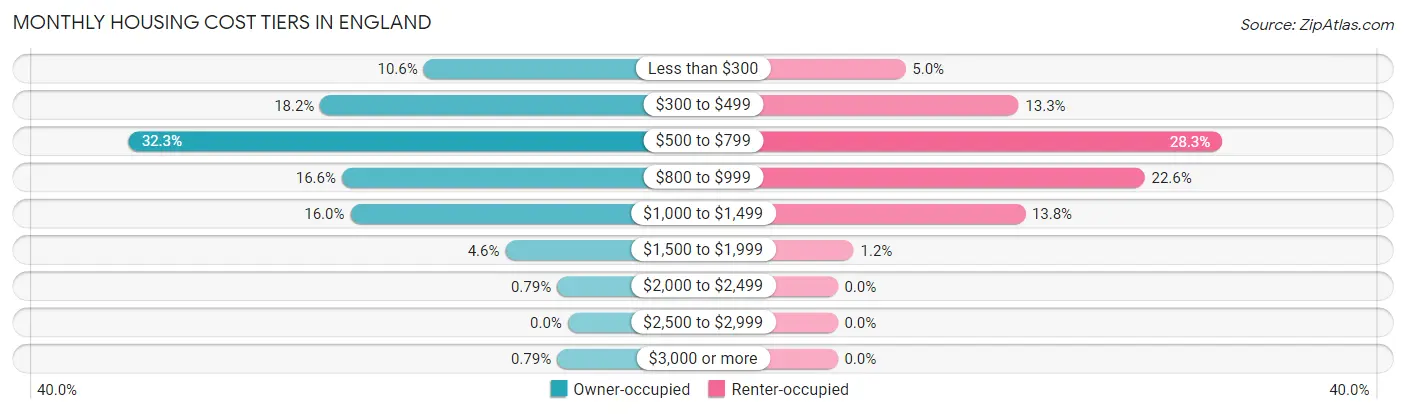
| Monthly Cost | Owner-occupied | Renter-occupied |
| Less than $300 | 67 (10.6%) | 21 (5.0%) |
| $300 to $499 | 115 (18.2%) | 56 (13.3%) |
| $500 to $799 | 204 (32.3%) | 119 (28.3%) |
| $800 to $999 | 105 (16.6%) | 95 (22.6%) |
| $1,000 to $1,499 | 101 (16.0%) | 58 (13.8%) |
| $1,500 to $1,999 | 29 (4.6%) | 5 (1.2%) |
| $2,000 to $2,499 | 5 (0.8%) | 0 (0.0%) |
| $2,500 to $2,999 | 0 (0.0%) | 0 (0.0%) |
| $3,000 or more | 5 (0.8%) | 0 (0.0%) |
| Total | 631 (100.0%) | 420 (100.0%) |
Physical Housing Characteristics in England
Housing Structures in England
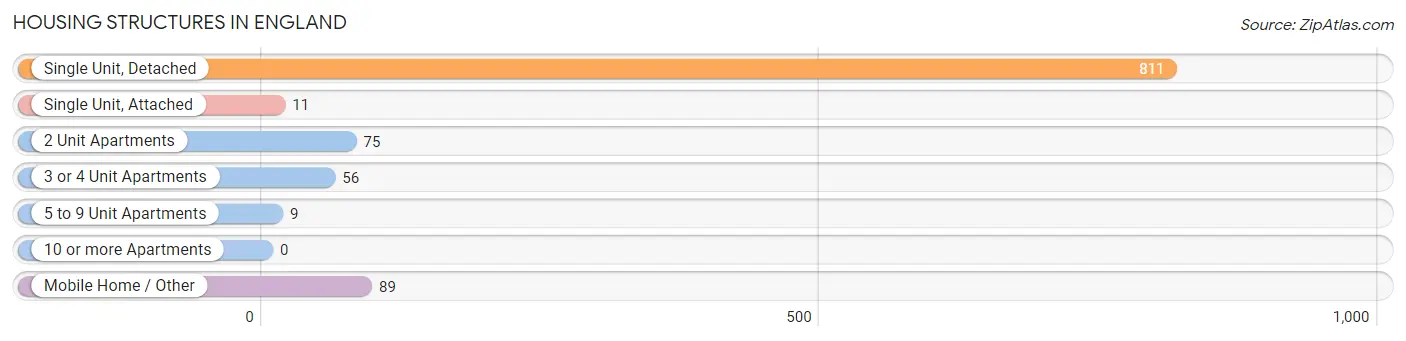
| Structure Type | # Housing Units | % Housing Units |
| Single Unit, Detached | 811 | 77.2% |
| Single Unit, Attached | 11 | 1.1% |
| 2 Unit Apartments | 75 | 7.1% |
| 3 or 4 Unit Apartments | 56 | 5.3% |
| 5 to 9 Unit Apartments | 9 | 0.9% |
| 10 or more Apartments | 0 | 0.0% |
| Mobile Home / Other | 89 | 8.5% |
| Total | 1,051 | 100.0% |
Housing Structures by Occupancy in England
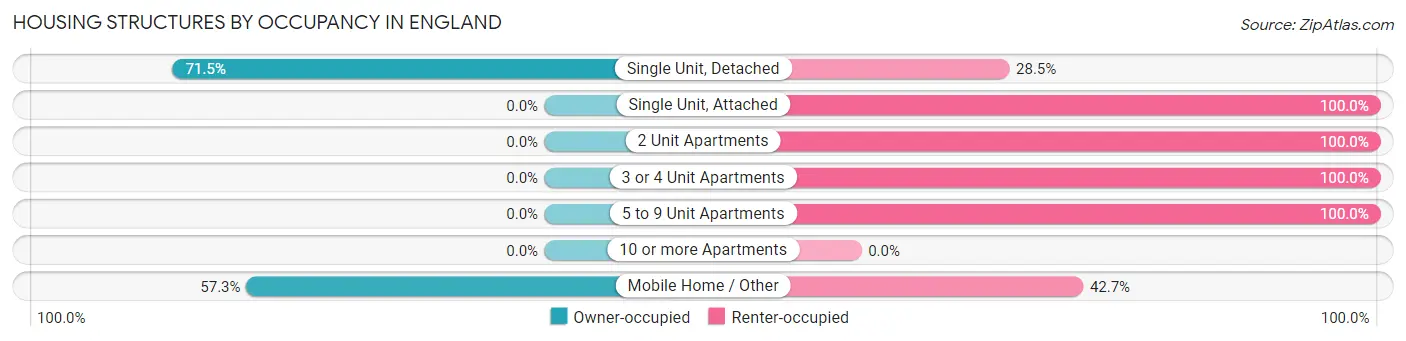
| Structure Type | Owner-occupied | Renter-occupied |
| Single Unit, Detached | 580 (71.5%) | 231 (28.5%) |
| Single Unit, Attached | 0 (0.0%) | 11 (100.0%) |
| 2 Unit Apartments | 0 (0.0%) | 75 (100.0%) |
| 3 or 4 Unit Apartments | 0 (0.0%) | 56 (100.0%) |
| 5 to 9 Unit Apartments | 0 (0.0%) | 9 (100.0%) |
| 10 or more Apartments | 0 (0.0%) | 0 (0.0%) |
| Mobile Home / Other | 51 (57.3%) | 38 (42.7%) |
| Total | 631 (60.0%) | 420 (40.0%) |
Housing Structures by Number of Rooms in England
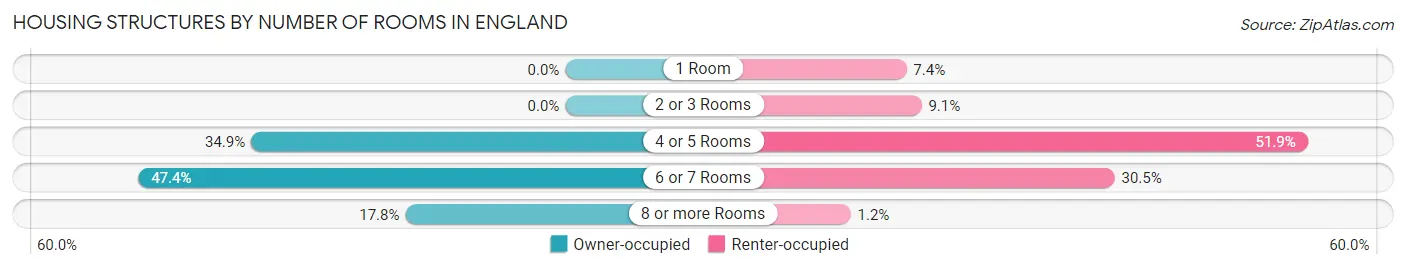
| Number of Rooms | Owner-occupied | Renter-occupied |
| 1 Room | 0 (0.0%) | 31 (7.4%) |
| 2 or 3 Rooms | 0 (0.0%) | 38 (9.0%) |
| 4 or 5 Rooms | 220 (34.9%) | 218 (51.9%) |
| 6 or 7 Rooms | 299 (47.4%) | 128 (30.5%) |
| 8 or more Rooms | 112 (17.7%) | 5 (1.2%) |
| Total | 631 (100.0%) | 420 (100.0%) |
Housing Structure by Heating Type in England
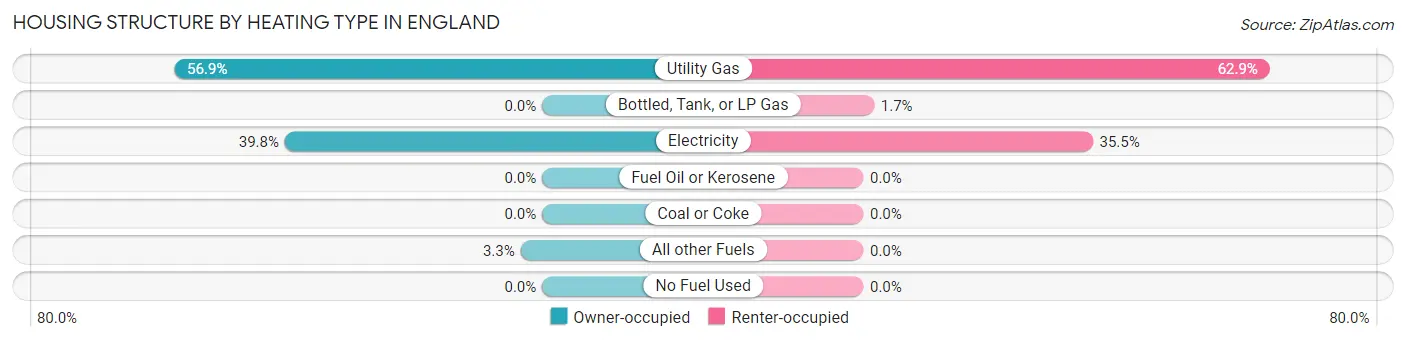
| Heating Type | Owner-occupied | Renter-occupied |
| Utility Gas | 359 (56.9%) | 264 (62.9%) |
| Bottled, Tank, or LP Gas | 0 (0.0%) | 7 (1.7%) |
| Electricity | 251 (39.8%) | 149 (35.5%) |
| Fuel Oil or Kerosene | 0 (0.0%) | 0 (0.0%) |
| Coal or Coke | 0 (0.0%) | 0 (0.0%) |
| All other Fuels | 21 (3.3%) | 0 (0.0%) |
| No Fuel Used | 0 (0.0%) | 0 (0.0%) |
| Total | 631 (100.0%) | 420 (100.0%) |
Household Vehicle Usage in England
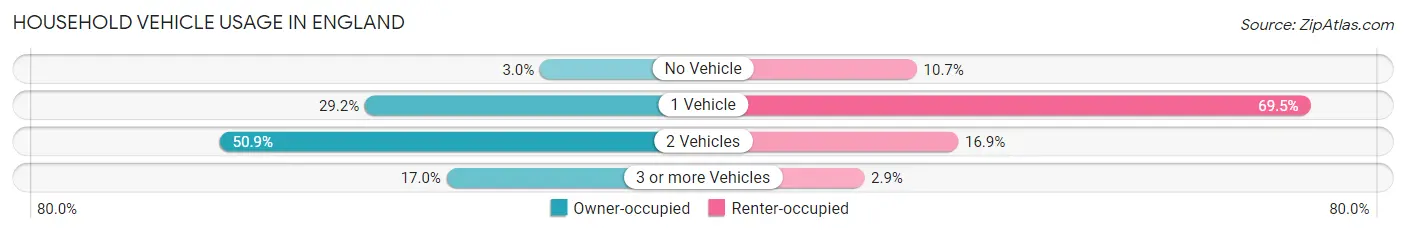
| Vehicles per Household | Owner-occupied | Renter-occupied |
| No Vehicle | 19 (3.0%) | 45 (10.7%) |
| 1 Vehicle | 184 (29.2%) | 292 (69.5%) |
| 2 Vehicles | 321 (50.9%) | 71 (16.9%) |
| 3 or more Vehicles | 107 (17.0%) | 12 (2.9%) |
| Total | 631 (100.0%) | 420 (100.0%) |
Real Estate & Mortgages in England
Real Estate and Mortgage Overview in England
| Characteristic | Without Mortgage | With Mortgage |
| Housing Units | 354 | 277 |
| Median Property Value | $92,900 | $124,000 |
| Median Household Income | $72,292 | $23 |
| Monthly Housing Costs | $498 | $5 |
| Real Estate Taxes | $886 | $31 |
Property Value by Mortgage Status in England
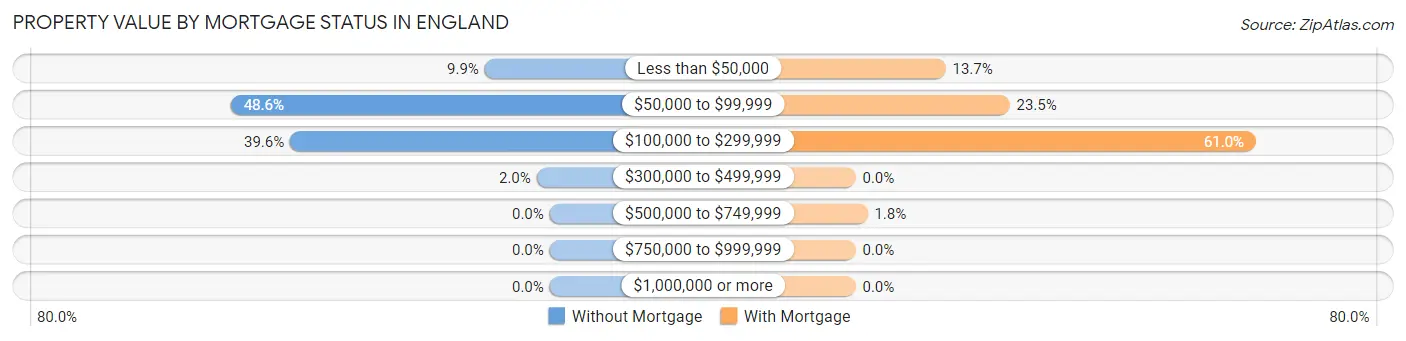
| Property Value | Without Mortgage | With Mortgage |
| Less than $50,000 | 35 (9.9%) | 38 (13.7%) |
| $50,000 to $99,999 | 172 (48.6%) | 65 (23.5%) |
| $100,000 to $299,999 | 140 (39.6%) | 169 (61.0%) |
| $300,000 to $499,999 | 7 (2.0%) | 0 (0.0%) |
| $500,000 to $749,999 | 0 (0.0%) | 5 (1.8%) |
| $750,000 to $999,999 | 0 (0.0%) | 0 (0.0%) |
| $1,000,000 or more | 0 (0.0%) | 0 (0.0%) |
| Total | 354 (100.0%) | 277 (100.0%) |
Household Income by Mortgage Status in England
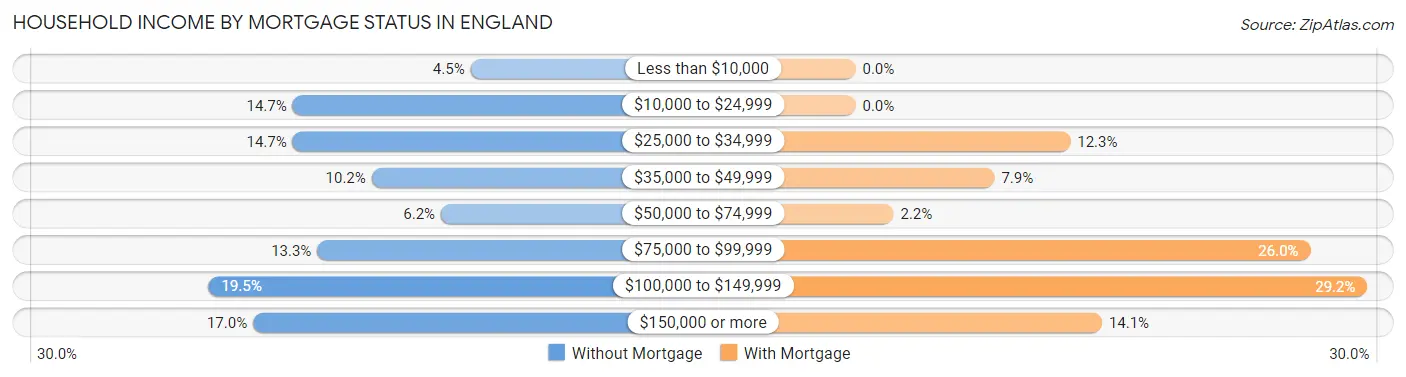
| Household Income | Without Mortgage | With Mortgage |
| Less than $10,000 | 16 (4.5%) | 0 (0.0%) |
| $10,000 to $24,999 | 52 (14.7%) | 0 (0.0%) |
| $25,000 to $34,999 | 52 (14.7%) | 34 (12.3%) |
| $35,000 to $49,999 | 36 (10.2%) | 22 (7.9%) |
| $50,000 to $74,999 | 22 (6.2%) | 6 (2.2%) |
| $75,000 to $99,999 | 47 (13.3%) | 72 (26.0%) |
| $100,000 to $149,999 | 69 (19.5%) | 81 (29.2%) |
| $150,000 or more | 60 (17.0%) | 39 (14.1%) |
| Total | 354 (100.0%) | 277 (100.0%) |
Property Value to Household Income Ratio in England
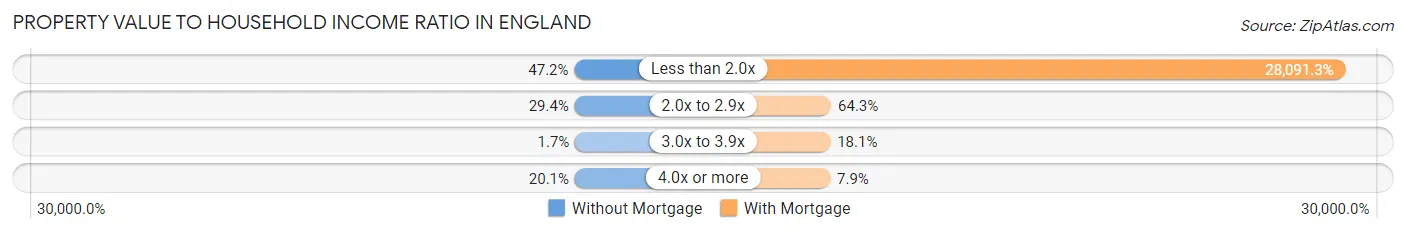
| Value-to-Income Ratio | Without Mortgage | With Mortgage |
| Less than 2.0x | 167 (47.2%) | 77,813 (28,091.3%) |
| 2.0x to 2.9x | 104 (29.4%) | 178 (64.3%) |
| 3.0x to 3.9x | 6 (1.7%) | 50 (18.0%) |
| 4.0x or more | 71 (20.1%) | 22 (7.9%) |
| Total | 354 (100.0%) | 277 (100.0%) |
Real Estate Taxes by Mortgage Status in England
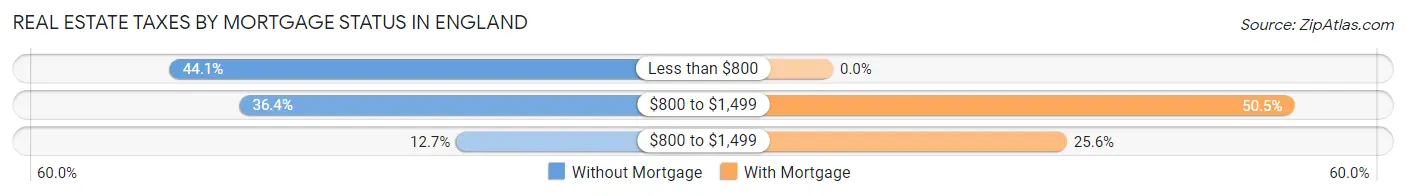
| Property Taxes | Without Mortgage | With Mortgage |
| Less than $800 | 156 (44.1%) | 0 (0.0%) |
| $800 to $1,499 | 129 (36.4%) | 140 (50.5%) |
| $800 to $1,499 | 45 (12.7%) | 71 (25.6%) |
| Total | 354 (100.0%) | 277 (100.0%) |
Health & Disability in England
Health Insurance Coverage by Age in England
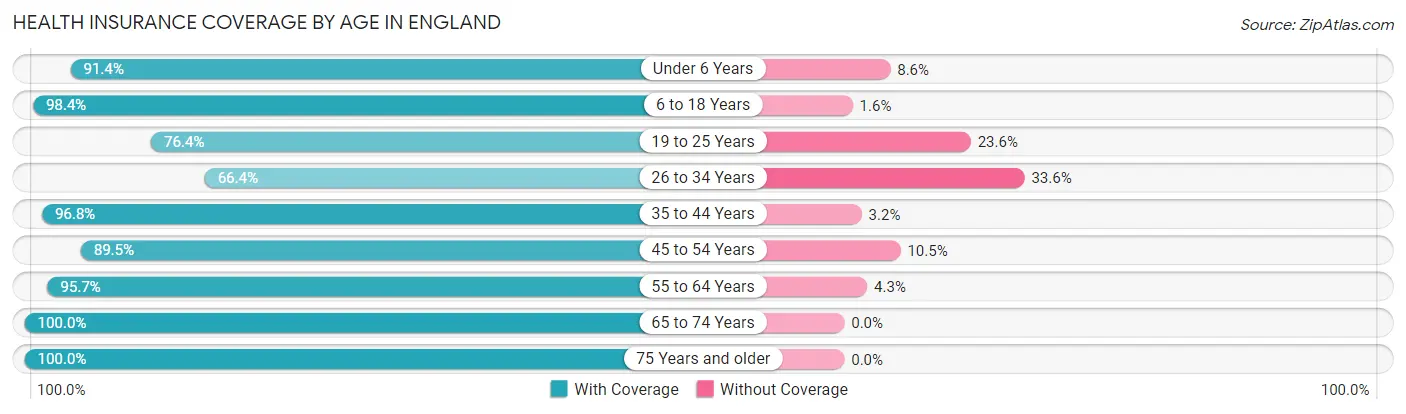
| Age Bracket | With Coverage | Without Coverage |
| Under 6 Years | 213 (91.4%) | 20 (8.6%) |
| 6 to 18 Years | 378 (98.4%) | 6 (1.6%) |
| 19 to 25 Years | 94 (76.4%) | 29 (23.6%) |
| 26 to 34 Years | 249 (66.4%) | 126 (33.6%) |
| 35 to 44 Years | 299 (96.8%) | 10 (3.2%) |
| 45 to 54 Years | 205 (89.5%) | 24 (10.5%) |
| 55 to 64 Years | 472 (95.7%) | 21 (4.3%) |
| 65 to 74 Years | 189 (100.0%) | 0 (0.0%) |
| 75 Years and older | 163 (100.0%) | 0 (0.0%) |
| Total | 2,262 (90.5%) | 236 (9.5%) |
Health Insurance Coverage by Citizenship Status in England
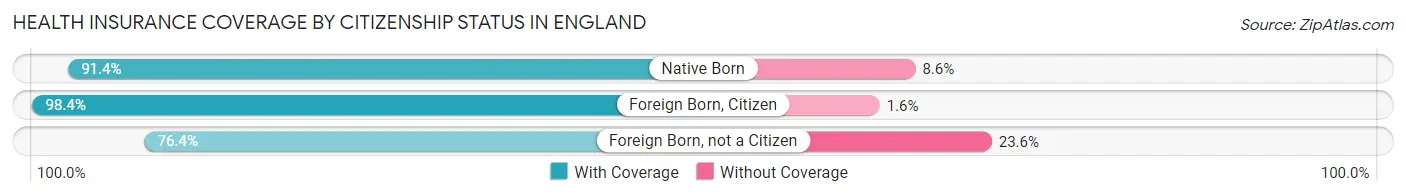
| Citizenship Status | With Coverage | Without Coverage |
| Native Born | 213 (91.4%) | 20 (8.6%) |
| Foreign Born, Citizen | 378 (98.4%) | 6 (1.6%) |
| Foreign Born, not a Citizen | 94 (76.4%) | 29 (23.6%) |
Health Insurance Coverage by Household Income in England
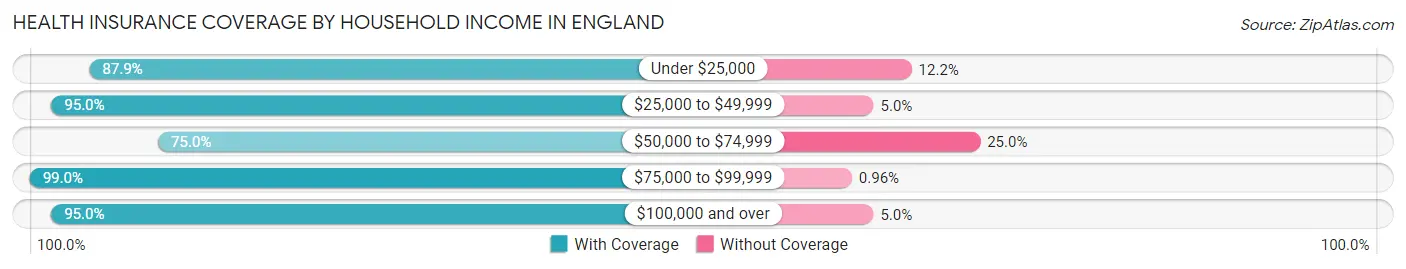
| Household Income | With Coverage | Without Coverage |
| Under $25,000 | 506 (87.8%) | 70 (12.1%) |
| $25,000 to $49,999 | 454 (95.0%) | 24 (5.0%) |
| $50,000 to $74,999 | 309 (75.0%) | 103 (25.0%) |
| $75,000 to $99,999 | 309 (99.0%) | 3 (1.0%) |
| $100,000 and over | 684 (95.0%) | 36 (5.0%) |
Public vs Private Health Insurance Coverage by Age in England
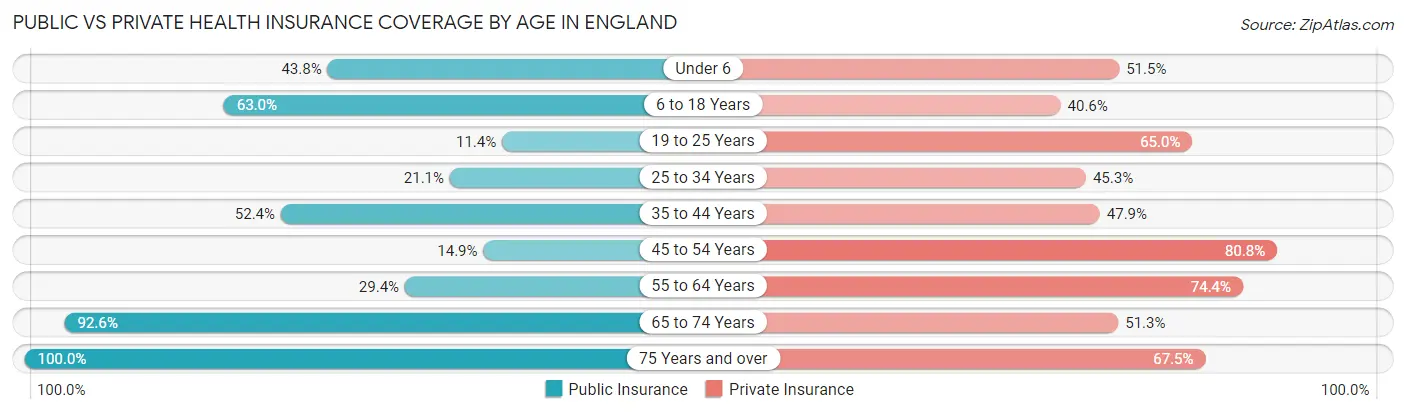
| Age Bracket | Public Insurance | Private Insurance |
| Under 6 | 102 (43.8%) | 120 (51.5%) |
| 6 to 18 Years | 242 (63.0%) | 156 (40.6%) |
| 19 to 25 Years | 14 (11.4%) | 80 (65.0%) |
| 25 to 34 Years | 79 (21.1%) | 170 (45.3%) |
| 35 to 44 Years | 162 (52.4%) | 148 (47.9%) |
| 45 to 54 Years | 34 (14.8%) | 185 (80.8%) |
| 55 to 64 Years | 145 (29.4%) | 367 (74.4%) |
| 65 to 74 Years | 175 (92.6%) | 97 (51.3%) |
| 75 Years and over | 163 (100.0%) | 110 (67.5%) |
| Total | 1,116 (44.7%) | 1,433 (57.4%) |
Disability Status by Sex by Age in England

| Age Bracket | Male | Female |
| Under 5 Years | 0 (0.0%) | 24 (16.3%) |
| 5 to 17 Years | 0 (0.0%) | 9 (5.0%) |
| 18 to 34 Years | 48 (14.9%) | 14 (7.5%) |
| 35 to 64 Years | 169 (37.0%) | 111 (19.3%) |
| 65 to 74 Years | 17 (23.0%) | 21 (18.3%) |
| 75 Years and over | 60 (77.9%) | 56 (65.1%) |
Disability Class by Sex by Age in England
Disability Class: Hearing Difficulty
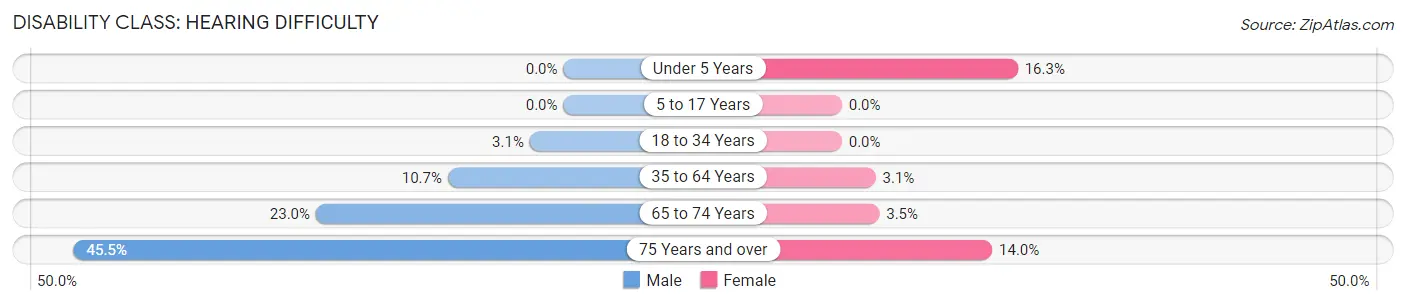
| Age Bracket | Male | Female |
| Under 5 Years | 0 (0.0%) | 24 (16.3%) |
| 5 to 17 Years | 0 (0.0%) | 0 (0.0%) |
| 18 to 34 Years | 10 (3.1%) | 0 (0.0%) |
| 35 to 64 Years | 49 (10.7%) | 18 (3.1%) |
| 65 to 74 Years | 17 (23.0%) | 4 (3.5%) |
| 75 Years and over | 35 (45.5%) | 12 (14.0%) |
Disability Class: Vision Difficulty
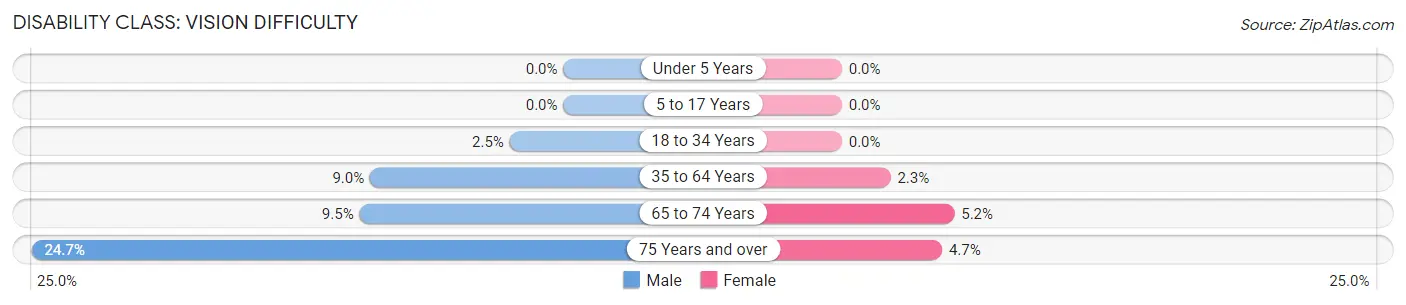
| Age Bracket | Male | Female |
| Under 5 Years | 0 (0.0%) | 0 (0.0%) |
| 5 to 17 Years | 0 (0.0%) | 0 (0.0%) |
| 18 to 34 Years | 8 (2.5%) | 0 (0.0%) |
| 35 to 64 Years | 41 (9.0%) | 13 (2.3%) |
| 65 to 74 Years | 7 (9.5%) | 6 (5.2%) |
| 75 Years and over | 19 (24.7%) | 4 (4.6%) |
Disability Class: Cognitive Difficulty
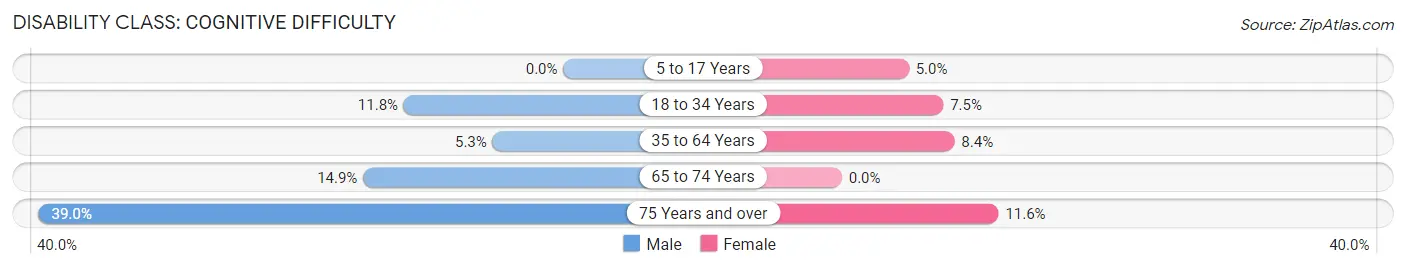
| Age Bracket | Male | Female |
| 5 to 17 Years | 0 (0.0%) | 9 (5.0%) |
| 18 to 34 Years | 38 (11.8%) | 14 (7.5%) |
| 35 to 64 Years | 24 (5.2%) | 48 (8.4%) |
| 65 to 74 Years | 11 (14.9%) | 0 (0.0%) |
| 75 Years and over | 30 (39.0%) | 10 (11.6%) |
Disability Class: Ambulatory Difficulty
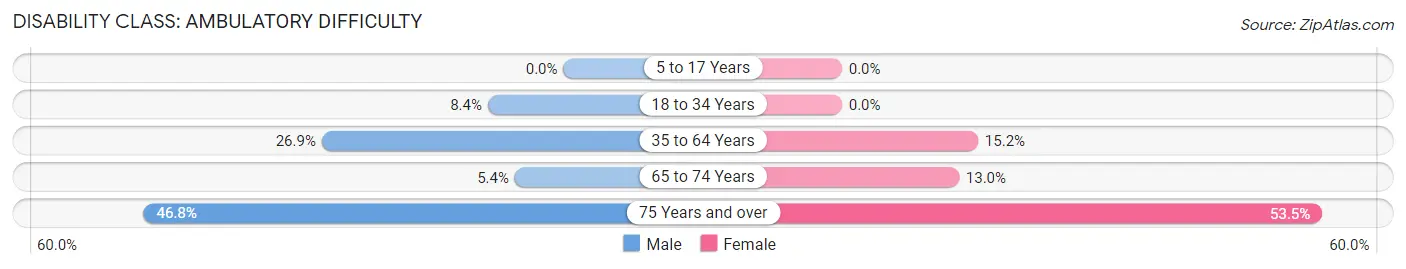
| Age Bracket | Male | Female |
| 5 to 17 Years | 0 (0.0%) | 0 (0.0%) |
| 18 to 34 Years | 27 (8.4%) | 0 (0.0%) |
| 35 to 64 Years | 123 (26.9%) | 87 (15.2%) |
| 65 to 74 Years | 4 (5.4%) | 15 (13.0%) |
| 75 Years and over | 36 (46.8%) | 46 (53.5%) |
Disability Class: Self-Care Difficulty
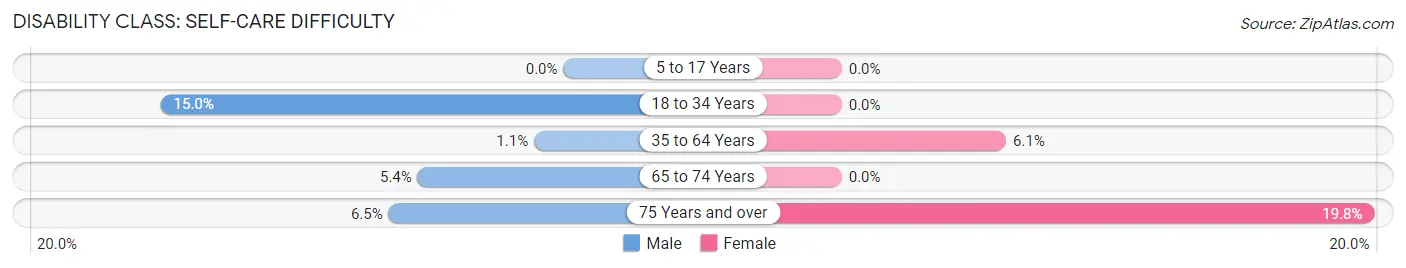
| Age Bracket | Male | Female |
| 5 to 17 Years | 0 (0.0%) | 0 (0.0%) |
| 18 to 34 Years | 48 (14.9%) | 0 (0.0%) |
| 35 to 64 Years | 5 (1.1%) | 35 (6.1%) |
| 65 to 74 Years | 4 (5.4%) | 0 (0.0%) |
| 75 Years and over | 5 (6.5%) | 17 (19.8%) |
Technology Access in England
Computing Device Access in England
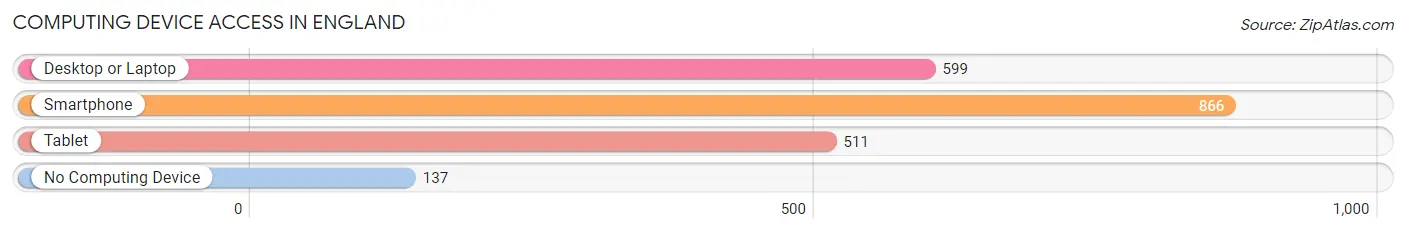
| Device Type | # Households | % Households |
| Desktop or Laptop | 599 | 57.0% |
| Smartphone | 866 | 82.4% |
| Tablet | 511 | 48.6% |
| No Computing Device | 137 | 13.0% |
| Total | 1,051 | 100.0% |
Internet Access in England
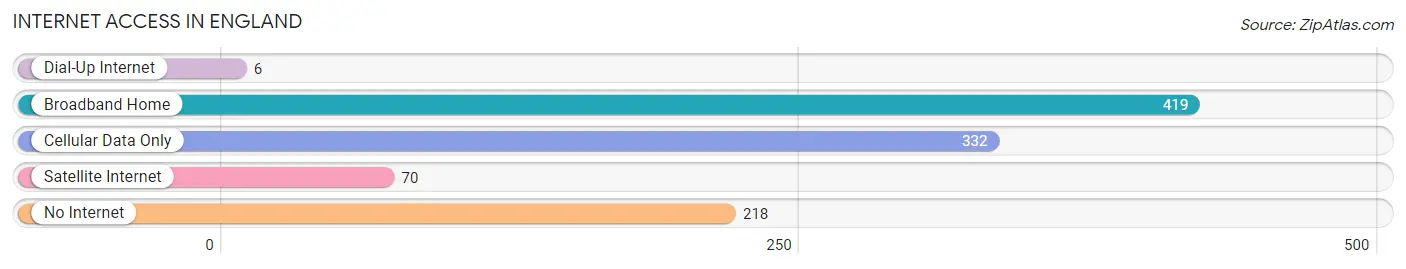
| Internet Type | # Households | % Households |
| Dial-Up Internet | 6 | 0.6% |
| Broadband Home | 419 | 39.9% |
| Cellular Data Only | 332 | 31.6% |
| Satellite Internet | 70 | 6.7% |
| No Internet | 218 | 20.7% |
| Total | 1,051 | 100.0% |
England Summary
England is a country located in the United Kingdom, and is the largest and most populous constituent country of the United Kingdom. It is located to the north-west of mainland Europe, and is bordered by Wales to the west and Scotland to the north. England is a highly developed country, and is the world’s sixth-largest economy by nominal GDP.
Geography
England is located in the south-east of the island of Great Britain, and is bordered by the North Sea to the east, the English Channel to the south, and the Irish Sea to the west. The country is divided into nine regions, including the East Midlands, East of England, London, North East, North West, South East, South West, West Midlands, and Yorkshire and the Humber. England is home to a variety of landscapes, including rolling hills, mountains, and coastal plains. The highest point in England is Scafell Pike, located in the Lake District, at 978 metres (3,209 ft).
Economy
England has a highly developed economy, and is the world’s sixth-largest economy by nominal GDP. The country is a major centre for finance, manufacturing, and services, and is home to a number of major international companies. The service sector is the largest contributor to the economy, accounting for around 79% of GDP. The manufacturing sector is the second-largest contributor, accounting for around 17% of GDP. The country is also a major exporter of goods and services, and is a member of the European Union.
Demographics
As of 2020, the population of England was estimated to be 56.1 million. The population is predominantly white, with around 87.2% of the population identifying as white British. The largest ethnic minority groups are Asian (7.2%), Black (3.3%), and Mixed (2.2%). The majority of the population is Christian (59.3%), followed by those who identify as having no religion (25.7%). The official language of England is English, and is spoken by the majority of the population.
England is a highly developed country, with a rich history, diverse geography, and a strong economy. The country is home to a diverse population, and is a major centre for finance, manufacturing, and services. The country is a major exporter of goods and services, and is a member of the European Union.
Common Questions
What is the Total Population of England?
Total Population of England is 2,562.
What is the Total Male Population of England?
Total Male Population of England is 1,254.
What is the Total Female Population of England?
Total Female Population of England is 1,308.
What is the Ratio of Males per 100 Females in England?
There are 95.87 Males per 100 Females in England.
What is the Ratio of Females per 100 Males in England?
There are 104.31 Females per 100 Males in England.
What is the Median Population Age in England?
Median Population Age in England is 40.1 Years.
What is the Average Family Size in England
Average Family Size in England is 3.0 People.
What is the Average Household Size in England
Average Household Size in England is 2.4 People.
What is Per Capita Income in England?
Per Capita income in England is $34,387.
What is the Median Family Income in England?
Median Family Income in England is $70,500.
What is the Median Household income in England?
Median Household Income in England is $53,036.
What is Income or Wage Gap in England?
Income or Wage Gap in England is 28.5%.
Women in England earn 71.5 cents for every dollar earned by a man.
What is Inequality or Gini Index in England?
Inequality or Gini Index in England is 0.53.
How Large is the Labor Force in England?
There are 1,178 People in the Labor Forcein in England.
What is the Percentage of People in the Labor Force in England?
57.2% of People are in the Labor Force in England.
What is the Unemployment Rate in England?
Unemployment Rate in England is 5.5%.